


Report Overview
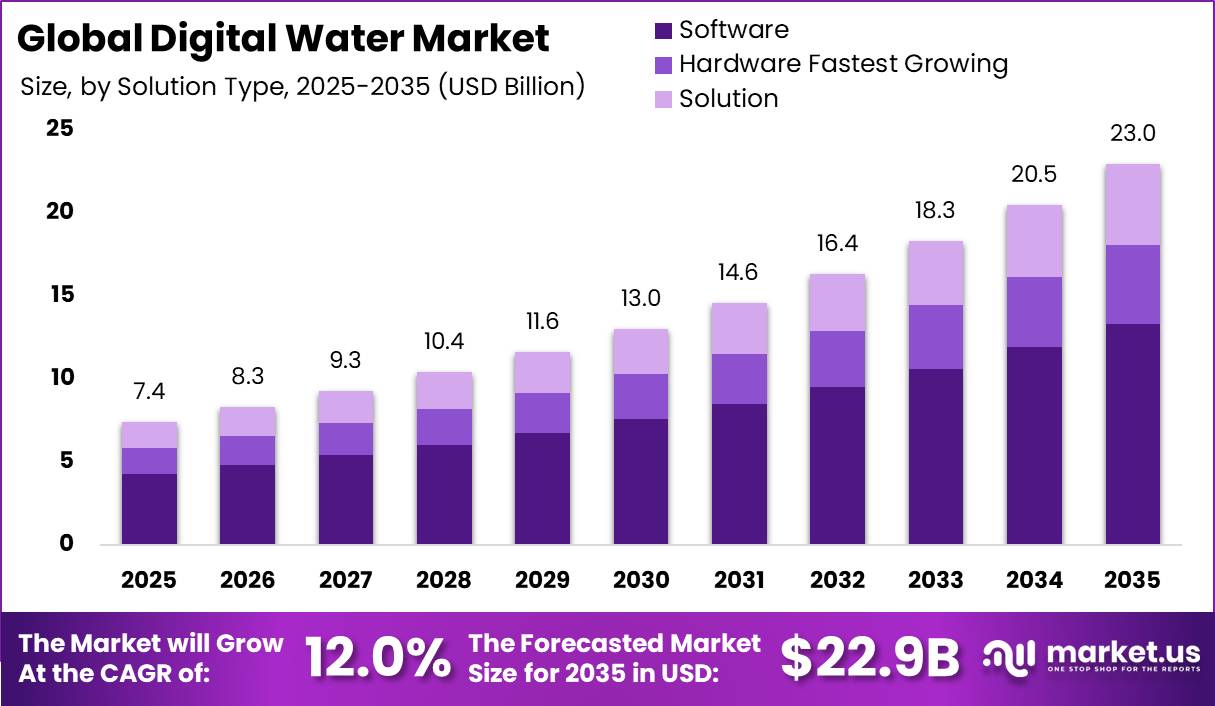
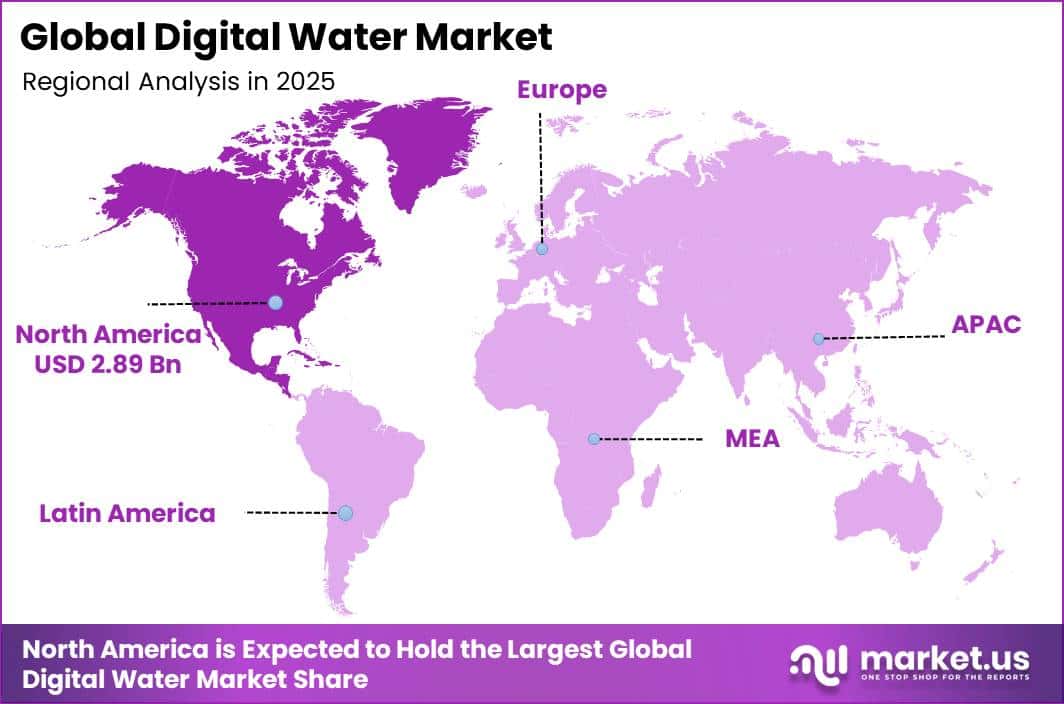
In 2025, the Global Digital Water Market was valued at USD 7.4 billion. The market is projected to grow at a CAGR of 12.0% during 2026–2035, reaching approximately USD 22.9 billion by 2035. North America dominated the global market in 2025, accounting for more than 39.0% of the total market share and generating approximately USD 2.8 billion in revenue.
This growth is closely linked to rising water scarcity and increasing investment in modern water infrastructure. Around 2.2 billion people still lack safely managed drinking water, while nearly 4 billion people experience severe water scarcity for at least one month each year. At the same time, drought causes more than USD 307 billion in economic losses annually.
These pressures are encouraging governments and water utilities to invest in smart meters, leak detection, digital sensors, real-time monitoring, analytics, and automated water-management systems. Closing the global water investment gap is estimated to require an additional USD 131 billion to USD 141 billion each year through 2030, while multilateral development banks approved USD 19.6 billion in 2024 for water-sector financing.
Key Takeaway
- The Digital Water Market is valued at USD 7.4 billion in 2025, projected to reach USD 22.9 billion by 2035 at a CAGR of 12.0%.
- Software dominated the market with a 58.0% share, driven by the need to reduce non-revenue water losses.
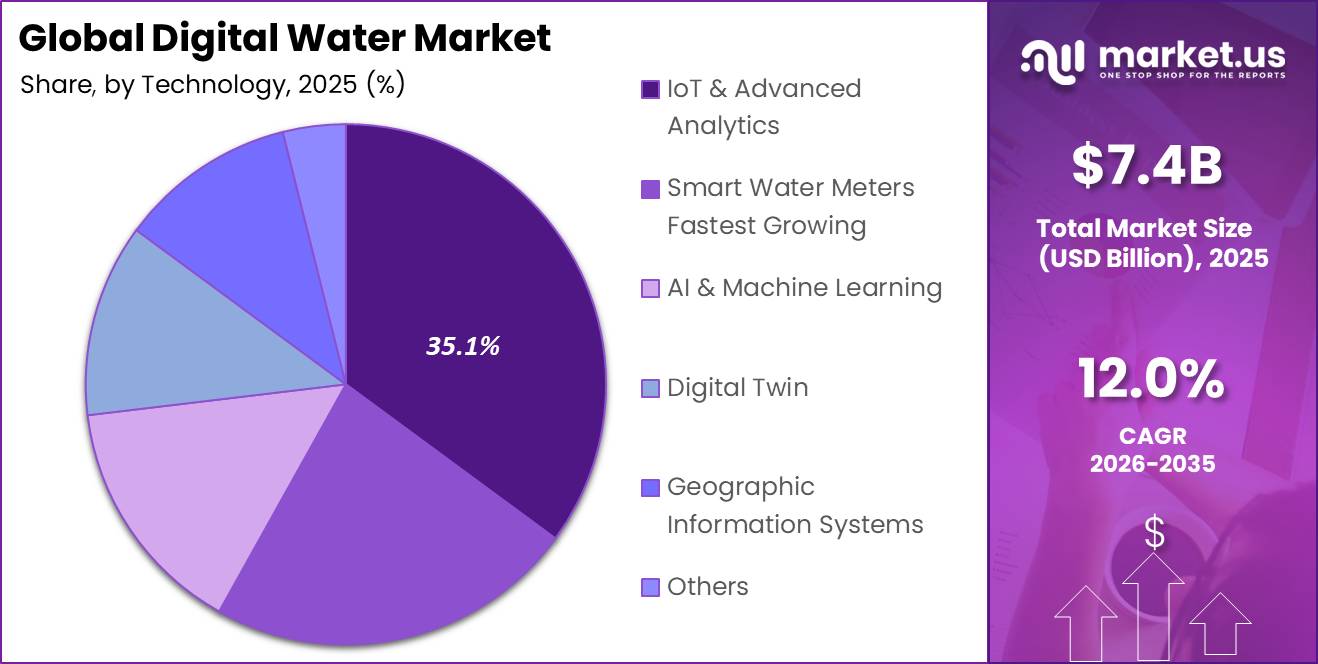
- IoT and Advanced Analytics led the technology segment with a 35.1% share, supported by rising demand for water-efficiency solutions.
- Municipal held the largest end-user share at 64.0%, driven by urbanization and pressure on aging city water networks.
- North America led the market with a 39.0% share, generating around USD 2.8 billion in revenue in 2025.
Market Statistics and Data Insights
- UN-Water reports that 2.1 billion people still lack safely managed drinking water, while 3.4 billion people lack safely managed sanitation, and unsafe WASH contributes to at least 1.4 million preventable deaths annually. These figures support continued investment in monitoring, treatment control, and digital water-quality systems.
- The World Bank states that around 4 billion people experience water scarcity, water supports an estimated 1.7 billion jobs, and 14 countries announced national water compacts under the Water Forward initiative in 2026.
- Agriculture accounts for around 72% of global freshwater withdrawals, approximately 4 billion people experience severe water scarcity for at least one month annually, and around 720 million people live in countries with high or critical water-stress levels.
- FAO AQUASTAT estimates that irrigation requires around 1,500 km³ of water, but withdrawals reach about 2,673 km³, resulting in a global water-requirement ratio of only 56%. This efficiency gap strongly supports IoT irrigation monitoring, flow analytics, and smart control systems.
- World Bank data places global non-revenue water losses at around 126 billion cubic metres annually, representing nearly USD 40 billion in lost water and revenue. An assessment of 43 projects also found performance-based NRW contracts significantly improved loss-reduction performance.
- The same World Bank analysis found that performance-based non-revenue-water projects were around 68% more effective than programs managed by utilities alone, demonstrating the commercial value of analytics, network monitoring and outcome-based digital services.
- The European Commission states that smart water meters can reduce consumption by up to 25%, broader digital systems can provide another 5–8% saving, and leak-detection technologies can reduce consumption by an additional 7–14%.
- Ofwat has allowed more than £1.7 billion for the installation of 10.4 million smart water meters in England and Wales and more than £700 million for leakage-reduction work.
- Anglian Water reported more than 1.3 million connected smart meters, giving nearly 60% of customers access to water-use information. Smart-meter data had also identified more than 600,000 customer leaks since 2021. AWWA’s 2026 State of the Water Industry survey collected responses from 2,171 water professionals. Around 56% expected some positive impact from generative AI, while 49% said their organizations did not yet have a policy governing AI use.
- Veolia announced more than USD 750 million in new water-technology contracts across energy and semiconductor applications, including a USD 550 million semiconductor water contract running for 16 years.
By Solution Type
The Software segment held a dominant 58.0% share, supported by the growing need to reduce non-revenue water losses across global utility networks. Utilities worldwide lose nearly 126 billion cubic meters of water every year, representing around USD 40 billion in lost revenue. In developing countries alone, about 45 million cubic meters of water is lost each day through leakage, enough to serve nearly 200 million people if recovered.
Meanwhile, Hardware is emerging as the fastest-growing device segment because digital water platforms depend on smart meters, sensors, IoT-enabled flow monitors, and other connected equipment for real-time data. With the annual water-sector funding gap estimated at around USD 131.4 billion to USD 140.8 billion, utilities are increasing investment in physical monitoring infrastructure, creating strong demand for hardware alongside software-based water management solutions.
By Technology
The IoT and Advanced Analytics segment held a leading 35.1% share, supported by the growing need to improve water efficiency in agriculture. The sector withdraws around 2,673 cubic kilometers of water each year, while global water requirement efficiency is only about 56%. In water-stressed areas such as North Africa, more than 50% of renewable water resources are used for irrigation.
With irrigated land covering over 307 million hectares worldwide, connected sensors and advanced analytics are becoming important for tracking water flow, soil moisture, consumption, and leakage across large farming areas. IoT platforms bring this information into one system, helping users identify problems early and reduce unnecessary water use.
By End-User
The Municipal segment held a dominant 64.0% share, supported by rising urban populations and increasing pressure on city water networks. Around 4 billion people, representing about 55% of the global population, now live in urban areas. This growing concentration of people is increasing demand for reliable water supply, sanitation, billing, and leakage control.
Many municipal networks are also aging, making digital platforms, smart monitoring systems, and automated controls important for tracking water use and reducing losses. Municipal utilities manage large numbers of connected consumers and therefore require centralized systems that can monitor consumption, billing, pressure, and network performance at scale.
Meanwhile, the Industrial segment is growing at the fastest rate as manufacturing activity expands and water use becomes more intensive. Industrial water withdrawals could rise toward 22% of global freshwater use, increasing the need for accurate monitoring across factories and processing facilities. Industries require continuous control of water used in cooling, production, cleaning, and wastewater treatment.
Key Market Segments
By Solution Type
- Software
- Hardware
- Solution
By Technology
- Smart Water Meters
- IoT and Advanced Analytics
- AI and Machine Learning
- Digital Twin
- Geographic Information Systems
- Others
By End-User
- Municipal
- Industrial
- Commercial and Residential
Geopolitical Impact Analysis
Ongoing US-China trade tensions are increasing costs across the digital water hardware supply chain. US Section 301 tariffs on semiconductors have reached 50%, while an additional 25% duty on advanced computing chips became effective in January 2026. These measures are raising input costs for sensors, PLCs, SCADA controllers, smart meters, and other connected water devices.
A further 15% tariff on polysilicon is expected to take effect in December 2026, adding pressure on semiconductor-related manufacturing. Raw material costs are also rising. Copper prices moved above USD 14,000 per tonne in May 2026, increasing by roughly one-third since January 2025.
Cobalt prices climbed around 130%, while gallium and germanium prices in Europe reached around 3 to 5 times Chinese domestic levels, making advanced sensor components more expensive. Logistics disruptions are adding another layer of pressure. More than 75% of container ships have been rerouted around the Cape of Good Hope due to Red Sea instability, extending Asia-Europe shipping times by 10 to 14 days and Asia-US East Coast routes by 8 to 12 days.
Freight rates have increased by around 15% to 40%, depending on the route. Disruptions around the Strait of Hormuz also caused container traffic to fall by more than 95% at peak levels, affecting roughly 0.5 million TEUs. Together, these pressures are increasing landed costs and delivery times for smart meters, IoT sensors, and digital water control equipment.
Regional Analysis
North America held the leading position in the digital water market with a 39.0% share, generating around USD 2.8 billion in 2025. The region benefits from strong public funding, mature water infrastructure, and early adoption of smart monitoring systems. These factors continue to support investment in digital platforms, sensors, and automated water-management technologies.
In FY2026, the US Environmental Protection Agency allocated USD 7.1 billion through State Revolving Fund grants, including USD 3.4 billion for clean water projects and USD 3.6 billion for drinking water improvements. Canada also committed USD 115 billion over five years, including USD 54 billion for core infrastructure. The EPA further plans to mobilize USD 45 billion in non-federal capital by September 2026.
Europe is emerging as the fastest-growing regional market, supported by strong EU funding for water management and environmental improvement. Under the EU Cohesion Policy, around EUR 16.9 billion through 2027 is being directed toward water-related projects. Of this amount, approximately EUR 13.2 billion is being provided directly through EU funds, supporting upgrades in treatment, monitoring, and distribution infrastructure.
Additional growth is supported by the EU’s “Restore our Ocean and Waters” mission, which has committed about EUR 1.9 billion to pollution reduction and aquatic ecosystem restoration. These investments are increasing demand for real-time water-quality monitoring, smart sensors, analytics platforms, and digital reporting systems.
Key Regions and Countries
North America
- US
- Canada
Europe
- Germany
- France
- The UK
- Spain
- Italy
- Rest of Europe
Asia Pacific
- China
- Japan
- South Korea
- India
- Australia
- Rest of APAC
Latin America
- Brazil
- Mexico
- Rest of Latin America
Middle East and Africa
- GCC
- South Africa
- Rest of MEA
Market Dynamics
Drivers
| Driver | (~) % CAGR | Geographic Relevance | Impact Timeline |
|---|---|---|---|
| Non-revenue water loss reduction mandates | +2.8% | Global, concentrated in North America and Europe | Short term (2 years or less) |
| Utility shift from CapEx hardware to SaaS analytics licensing | +2.3% | North America, Western Europe | Short term (2 years or less) |
| Public revolving fund disbursements tied to digital reporting | +1.9% | United States, European Union | Medium term (2 to 4 years) |
| Industrial water-quality compliance automation | +1.4% | Asia-Pacific, North America | Medium term (2 to 4 years) |
| Municipal smart metering rollouts | +1.1% | Global | Short term (2 years or less) |
Non-revenue water loss reduction mandates
Utilities are under growing pressure to reduce physical and commercial water losses. Utilities using pressure-management and leak-detection analytics between 2024 and 2026 reported billing-recovery improvements of around 8% to 12%, supporting stronger demand for digital water platforms.
This shift is increasing recurring software revenue, with gross margins of about 65% to 72%, compared with 35% to 40% for hardware-only contracts. Customer acquisition payback periods can also fall from roughly 30 months to below 18 months, encouraging vendors to invest more in cloud-based analytics and subscription services.
Restraints
| Restraint | (~) % CAGR | Geographic Relevance | Impact Timeline |
|---|---|---|---|
| Semiconductor and sensor-component tariff escalation | -1.6% | United States, China-linked supply chains | Short term (2 years or less) |
| Municipal capital budget constraints under high interest rates | -1.2% | Latin America, Sub-Saharan Africa | Short term (2 years or less) |
| Legacy procurement rules blocking subscription-based contracts | -0.9% | Southern Europe, parts of Asia-Pacific | Medium term (2 to 4 years) |
Semiconductor and sensor-component tariff escalation
Tariffs on advanced chips and sensor materials are increasing hardware costs across the digital water market. Duties of up to 50%, along with an additional 15% tariff on chip-grade polysilicon from late 2026, could raise smart meter and IoT sensor material costs by around 9% to 14%. Copper prices also increased by roughly 33% between January 2025 and April 2026.
These pressures may reduce hardware vendor gross margins by around 200 to 350 basis points or delay shipments by 10 to 14 days due to longer logistics routes. As a result, some municipal utilities may postpone planned hardware upgrades until revised pricing and procurement budgets are finalized.
Challenges
| Challenge | (~) % CAGR | Geographic Relevance | Mitigation Horizon |
|---|---|---|---|
| Water utility digital talent shortage | -1.3% | North America, Europe | Long term (4 years or more) |
| Legacy SCADA interoperability gaps | -1.0% | Global, acute in Asia-Pacific | Medium term (2 to 4 years) |
| Cybersecurity risk in connected water networks | -0.8% | North America, Europe | Medium term (2 to 4 years) |
| Fragmented utility ownership structures | -0.6% | Latin America, Southeast Asia | Long term (4 years or more) |
Water utility digital talent shortage
The main challenge comes from an aging utility workforce and a shortage of digital skills. Around 25% to 30% of data-analytics and OT-cybersecurity positions in water utilities remain unfilled, slowing the adoption of advanced digital platforms.
As a result, some deployments can face delays of around 4 to 8 months while utilities wait for trained operators. Vendors are responding by offering managed services, training, and remote support, which can account for roughly 15% to 20% of total contract value.
Opportunities
| Opportunity | (~) % CAGR | Geographic Relevance | Execution Window |
|---|---|---|---|
| AI-driven predictive maintenance monetization | +2.1% | Global | Medium term (2 to 4 years) |
| Decentralized water systems for emerging-market utilities | +1.7% | Sub-Saharan Africa, South Asia | Long term (4 years or more) |
| Industrial water reuse and circularity platforms | +1.5% | European Union, Middle East | Medium term (2 to 4 years) |
| Cross-utility data-sharing consortium models | +1.0% | North America, Europe | Long term (4 years or more) |
AI-driven predictive maintenance monetization
This opportunity remains largely untapped because most digital water analytics are still used for reactive leak detection and billing, rather than outcome-based predictive maintenance. If vendors adopt pricing models linked to avoided failures and performance outcomes, gross margins on software-supported services could improve by around 10% to 15% above current blended levels.
Further upside could come from scale. Cost per managed asset may decline by roughly 20% to 30% once predictive models are trained using pooled data from multiple utilities. However, this depends on stronger data-sharing partnerships, consortium development, and more mature algorithms, meaning the opportunity is not yet fully reflected in the current market forecast.
Key Players Analysis
The Digital water market is led by large industrial technology companies with strong automation, software, and infrastructure portfolios. Siemens AG reported EUR 78.9 billion in FY2025 revenue and invested EUR 6.6 billion in RandD, equal to 8.3% of revenue. Its Digital Industries software business generated EUR 5.3 billion in annual recurring revenue, growing 13% year-over-year.
Schneider Electric recorded EUR 40.2 billion in FY2025 revenue, up 8.9%, while allocating around 7% of revenue to RandD cash-out and 2.6% to tangible CapEx. Honeywell generated USD 37.4 billion in FY2025 sales, while its Energy and Sustainability Solutions segment grew 19% to USD 3.1 billion. Xylem reported USD 9.04 billion in revenue, up 5.5%, with USD 226 million in RandD spending, equal to 2.5% of revenue.
Among Tier-2 players, Itron generated USD 2.3 billion in FY2025 revenue, down 3%, while its Outcomes software business reached USD 360 million and annual recurring revenue increased 20% to USD 368 million. Bentley Systems recorded USD 1.5 billion in revenue, up 11.0%, including USD 1.3 billion from subscriptions.
Its RandD spending reached USD 307.6 million, or 20.5% of revenue. Engineering firms such as Tetra Tech, Jacobs Solutions, and WSP Global mainly compete through consulting, systems integration, and digital water project delivery.
Top Key Players in the Market
- Schneider Electric
- Xylem Inc.
- Veolia
- Siemens AG
- ABB
- Bentley Systems
- Innovyze
- Copperleaf Technologies Inc.
- SUEZ
- Itron
- Honeywell
- General Electric
- Autodesk
- Tetra Tech, Inc.
- Jacobs Engineering Group
- WSP
- Hatch Ltd.
- Sweco AB
- Eviden
- Atonix Digital
- Analytical Technology Inc.
Recent Developments
- In 2025, Veolia signed an agreement on May 7 to acquire CDPQ’s remaining 30% stake in Water Technologies and Solutions for USD 1.7 billion, equivalent to around EUR 1.5 billion. The transaction gives Veolia 100% ownership of WTS and is expected to generate approximately EUR 90 million in additional annual run-rate cost synergies by 2027. For clarification, WTS itself generated around EUR 3.3 billion in FY2024 revenue, while Veolia’s broader Water Technologies segment generated approximately EUR 4.9 billion.
- In 2025, Xylem acquired Vacom Systems at the beginning of the second quarter to expand its advanced wastewater-treatment capabilities. The transaction had a total cash consideration of USD 42 million, of which USD 37 million was paid at closing. Vacom specializes in non-fouling and non-scaling evaporator and crystallizer technologies used in complex wastewater-treatment applications.
Report Scope
| Report Features | Description |
|---|---|
| Market Value (2025) | USD 7.4 Billion |
| Forecast Revenue (2035) | USD 22.9 Billion |
| CAGR (2026-2035) | 12.0% |
| Base Year for Estimation | 2025 |
| Historic Period | 2020-2024 |
| Forecast Period | 2026-2035 |
| Report Coverage | Revenue Forecast, Market Dynamics, Competitive Landscape, Recent Developments |
| Segments Covered | By Solution Type: (Software, Hardware, Solution), By Technology: (Smart Water Meters, IoT and Advanced Analytics, AI and Machine Learning, Digital Twin, Geographic Information Systems, Others), By End-User: (Municipal, Industrial, Commercial and Residential) |
| Regional Analysis | North America – US, Canada; Europe – Germany, France, The UK, Spain, Italy, Rest of Europe; Asia Pacific – China, Japan, South Korea, India, Australia, Singapore, Rest of APAC; Latin America – Brazil, Mexico, Rest of Latin America; Middle East and Africa – GCC, South Africa, Rest of MEA |
| Competitive Landscape | Schneider Electric, Xylem Inc., Veolia, Siemens AG, ABB, Bentley Systems, Innovyze, Copperleaf Technologies Inc., SUEZ, Itron, Honeywell, General Electric, Autodesk, Tetra Tech, Inc., Jacobs Engineering Group, WSP, Hatch Ltd., Sweco AB, Eviden, Atonix Digital, Analytical Technology Inc. |
| Customization Scope | Customization for segments, region/country-level will be provided. Moreover, additional customization can be done based on the requirements. |
| Purchase Options | We have three licenses to opt for: Single User License, Multi-User License (Up to 5 Users), Corporate Use License (Unlimited Users and Printable PDF) |





























