


Report Overview
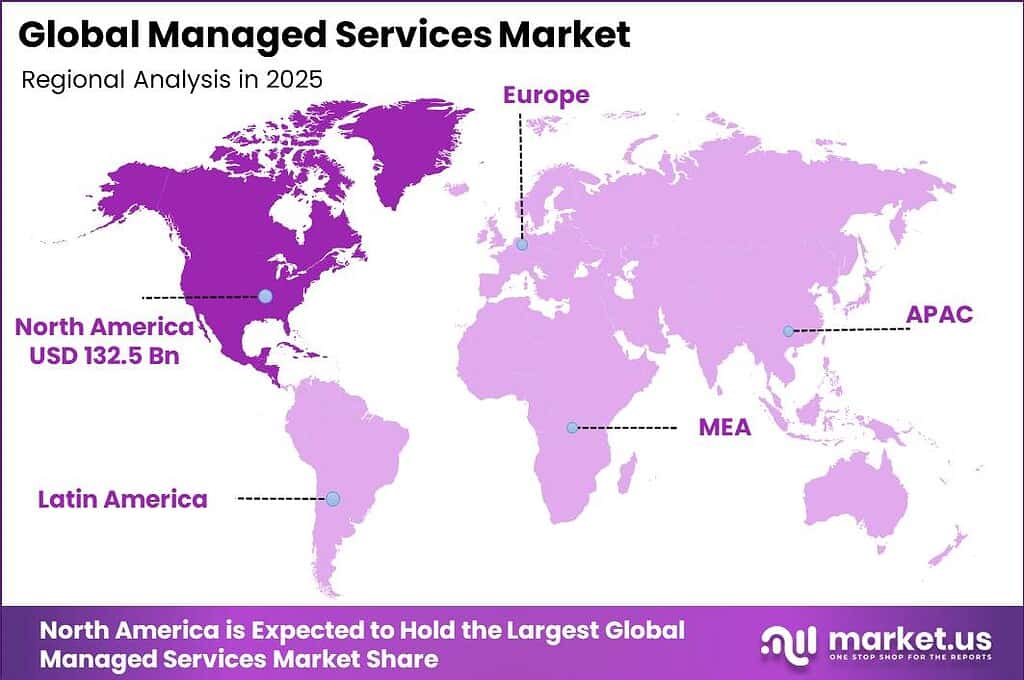
In 2025, the Global Managed Services Market was valued at USD 401.4 billion. The market is projected to grow at a CAGR of 9.7% during 2026–2035, reaching approximately USD 1014.4 billion by 2035. North America dominated the global market in 2025, accounting for more than 33.0% of the total market share and generating approximately USD 132.5 billion in revenue.
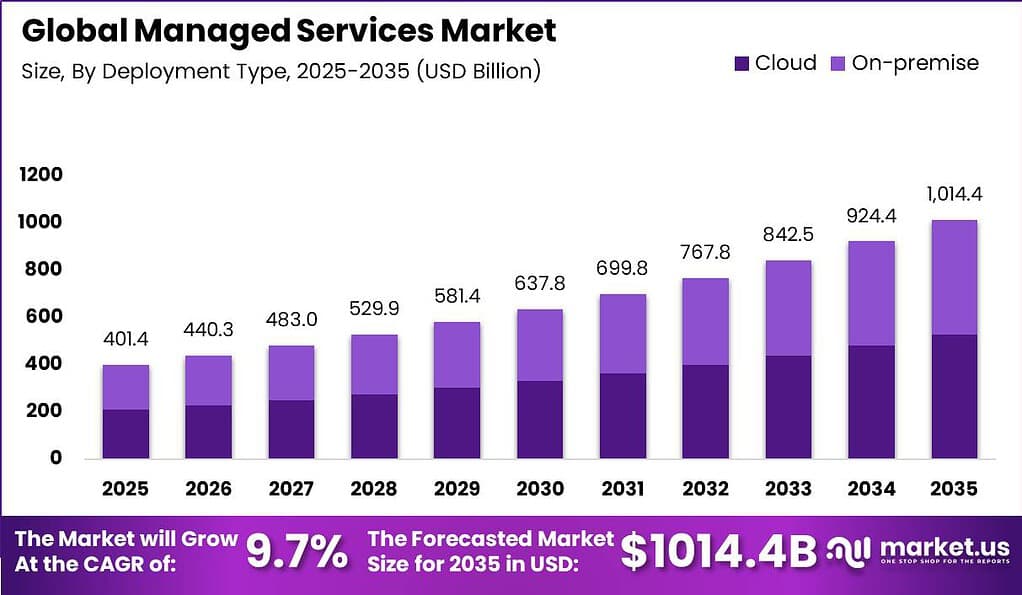
This strong growth outlook is supported by the rapid digitalization of economies and the surge in online activity. According to the International Telecommunication Union, the number of internet users worldwide exceeded 5.4 billion by 2023, sharply increasing the volume of data, applications, and online services that enterprises must manage securely. The World Bank notes that services now account for more than 65% of global GDP, with IT, finance, and professional services heavily dependent on reliable, secure digital infrastructure.
North America’s leading position, with more than one-third of global managed services revenue in 2025, is closely linked to its heavy digital investment and advanced IT usage. The U.S. Bureau of Economic Analysis reports that the information sector alone added over USD 1.5 trillion to U.S. GDP in 2023, while the OECD shows that over 95% of enterprises in major North American economies have internet access and high adoption of cloud computing and digital tools.
This deep digital footprint creates constant demand for managed network operations, cybersecurity, compliance, and cloud optimization services. According to the U.S. Cybersecurity and Infrastructure Security Agency, reported cyber incidents against businesses continue to rise, pushing organizations to rely on managed security operations centers for 24/7 threat monitoring and response.
Key Takeaway
- The global managed services market was valued at USD 401.38 billion in 2025.
- The global managed services market is projected to grow at a CAGR of 9.71% and is estimated to reach USD 1,014.38 billion by 2035.
- On the basis of service type, the managed infrastructure segment dominated the market, accounting for 39.0% of the total market share.
- Based on deployment type, the cloud segment dominated the market, accounting for 52.0% of the total market share.
- By enterprise size, the large enterprises segment dominated the market, accounting for 67.0% of the total market share.
- On the basis of vertical/end-use, the BFSI segment dominated the market, accounting for 33.5% of the total market share.
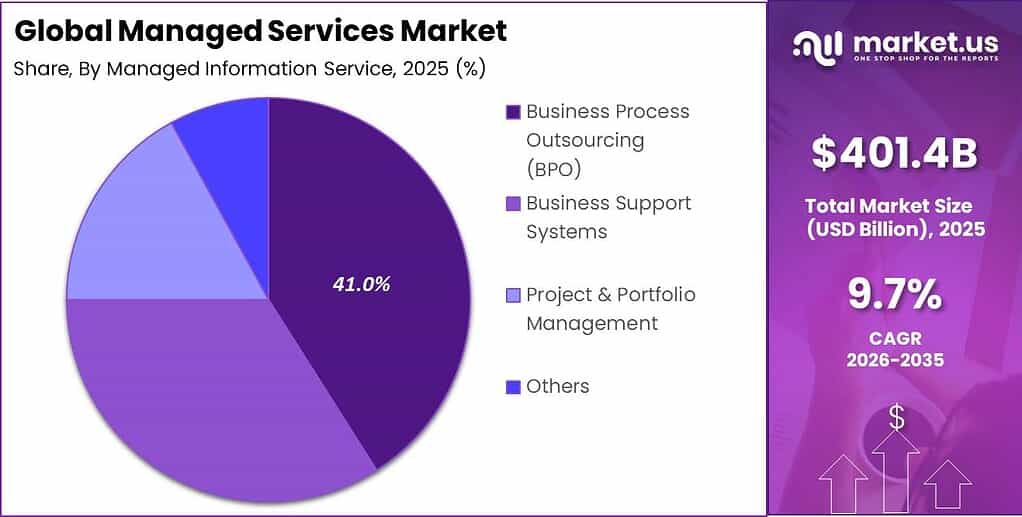
- Based on managed information services, the business process outsourcing (BPO) segment dominated the market, accounting for 41.0% of the total market share.
- North America was the most dominant region in the managed services market, accounting for 33.0% of the total market share, equivalent to approximately USD 132.5 billion.
By Service Type
In 2025, Managed Infrastructure held a dominant market position, capturing more than a 39% share across the forecast period. This strength reflects how companies in telecom, manufacturing, and banking rely on outside partners to keep core systems running as they modernize networks and data centers.
Managed IT infrastructure services were valued at about USD 128–129 billion in 2025 and are expected to reach more than USD 210 billion by 2030, underscoring the steady shift to outsourced operations. Through March and June 2025, many firms refreshed server capacity and upgraded connectivity to support cloud applications and data-heavy analytics.
Managed Security is emerging as a fast-growing segment in 2025, with demand tracking around an 11.5% CAGR as organizations respond to rising cyber risk and regulatory pressure. Global managed security services were worth roughly USD 38–39 billion in 2025 and are projected to climb beyond USD 44 billion in 2026, highlighting the shift toward continuous, outsourced protection.
By Deployment Type
In 2025, Cloud deployment held a dominant market position, capturing more than a 52% share of managed services workloads through the forecast period. Cloud managed services were valued at about USD 140–146 billion in 2025 and are expected to expand steadily as enterprises move more applications and data into hosted environments.
Surveys in early 2025 showed that around 52–54% of enterprise workloads were already running in the cloud, with public cloud accounting for the largest portion as providers added new availability zones and services. Through April and November 2025, many firms scheduled major migrations of collaboration tools, customer platforms, and analytics systems to align with budget cycles.
Hybrid Cloud is emerging as a fast-growing segment in 2025, with adoption projected to rise at about a 12% CAGR as organizations blend on-premises systems with public cloud for flexibility and control. While private cloud holds a strong share today, forecasts highlight hybrid as the fastest-growing deployment model, driven by firms that need to keep sensitive data close while tapping scalable resources for variable workloads.
By Enterprise Size
In 2025, Large Enterprises held a dominant market position, capturing more than a 67% share of managed services spending and expanding at a mid-single-digit CAGR as digital transformation accelerates. Data on the managed services market shows large organizations controlling about 66.95–75% of demand, while smaller firms are still catching up. Large enterprises commonly run hundreds of applications and sites, making outsourced infrastructure, security, and support an attractive way to maintain consistent performance.
Small & Medium Enterprises (SMEs) are emerging as a fast-growing segment in 2025, with managed services adoption expected to climb at around a 10.41% CAGR as cloud models and packaged offerings lower entry barriers. Research on the broader support services and business support markets shows CAGR figures near 8–11% for related outsourcing and technology-enabled service categories, reflecting strong momentum among smaller firms.
By Vertical
In 2025, BFSI held a dominant market position among managed services verticals, capturing more than a 33.55% share of demand and sustaining growth at high single-digit CAGR levels across infrastructure and security outsourcing. Sector data for managed IT infrastructure shows IT and telecommunications leading with about 25.75% revenue share, but banking and financial users contributing heavily to connectivity and data center modernization.
Financial institutions face strict uptime and compliance requirements for payments, trading, and digital channels, making external support for networks, servers, and monitoring a practical choice. During May and November 2025, many banks timed core system upgrades and branch connectivity projects to match regulatory and fiscal calendars.
Cybersecurity figures, with global spending rising from about USD 271.9 billion in 2025 to roughly USD 302 billion in 2026, further underline how BFSI relies on managed security to protect accounts and transactions. By 2026, as contactless payments and real-time transfers spread, managed partners became even more central to keeping BFSI systems resilient and compliant.
Healthcare and Life Sciences is emerging as a fast-growing segment in 2025, with managed infrastructure and related services projected to advance at close to a 10.5% CAGR as providers digitize care and research workflows. Industry data indicates healthcare posting one of the fastest growth rates among end-user groups in managed IT infrastructure, outpacing more mature sectors as hospitals expand electronic records, imaging, and remote consultation platforms.
Business Process Outsourcing
In 2025, Business Process Outsourcing (BPO) held a dominant market position within managed information services, capturing more than a 41% share and growing at a solid mid-single-digit CAGR as firms externalize routine operations. The broader business support services market, which includes many BPO activities.
Business Support Systems are emerging as a fast-growing segment in 2025, with operational and business support platforms projected to expand at roughly a 10% CAGR as organizations modernize billing, ordering, and service management.
Key Market Segments
By Service Type
- Managed Data Center
- Managed Security
- Managed Communications
- Managed Network
- Managed Infrastructure
- Managed Mobility
- Managed Information Services
- Managed Backup and Recovery
- Others
By Deployment Type
- On-premise
- Cloud
- Public Cloud
- Private Cloud
- Hybrid Cloud
By Enterprise Size
- Large Enterprises
- Small & Medium Enterprises (SMEs)
By Vertical / End-Use
- BFSI
- IT and Telecommunication
- Healthcare and Life Sciences
- Manufacturing
- Retail and E-commerce
- Government and Public Sector
- Energy and Utilities
- Media and Entertainment
- Others (Education, Non-Profit)
By Managed Information Service (MIS)
- Business Process Outsourcing (BPO)
- Business Support Systems
- Project & Portfolio Management
- Others
Market Dynamics
Drivers
| Driver | (~) % Impact on CAGR Forecast | Geographic Relevance | Impact Timeline |
|---|---|---|---|
| Cloud-first enterprise sourcing | +2.4% | North America, Western Europe, Asia-Pacific | Short term (≤ 2 years) |
| Post-pandemic remote operations | +1.8% | Global urban and distributed enterprises | Short term (≤ 2 years) |
| Complex hybrid IT estates | +1.6% | Global large and mid-market enterprises | Medium term (2–4 years) |
| CISO-led managed security shift | +1.9% | Highly regulated industries globally | Short term (≤ 2 years) |
| IT talent cost inflation | +1.4% | North America, Europe, select APAC hubs | Medium term (2–4 years) |
| Vendor consolidation by CFOs | +0.9% | Developed markets, large enterprise segment | Medium term (2–4 years) |
Cloud-first enterprise sourcing
Large enterprises shifting to cloud-first sourcing models between 2024 and 2026 have structurally altered managed services business models by standardizing on multi-year, outcome-based contracts for cloud management, observability, and resilience.
Hyperscale cloud infrastructure spending has grown at mid-teens percentages annually, while enterprise IT operating budgets have reallocated roughly 10–20% of internal run-the-business spend into externally managed cloud operations, producing an incremental managed services uplift of about +2.4% on the baseline managed services CAGR of 9.71% as cloud tenancy counts and workload volumes expand.
Commercially, this shows up in contract structures moving from time-and-materials to per-resource and per-workload subscriptions, with a typical large enterprise consolidating 3–5 internal platform teams into a single managed cloud partner, compressing internal unit support costs by roughly 15–25% while enabling providers to achieve EBIT margins in the mid-teens range on standardized service catalogs.
That margin structure is reinforced by automation ratios rising from roughly 30% of routine tickets being automated in 2024 to nearer 50% by 2026, cutting cost-per-incident by 20–30% and lowering per-account delivery headcount by 10–15 FTEs for global accounts, which in turn supports higher free cash flow conversion and accelerates managed services providers’ ability to invest in proprietary platforms rather than pure labor-arbitrage models.
Restraints
| Restraint | (~) % Impact on CAGR Forecast | Geographic Relevance | Impact Timeline |
|---|---|---|---|
| High interest rate environment | -2.3% | North America, Europe, selected emerging markets | Short term (≤ 2 years) |
| Data sovereignty contract barriers | -1.5% | EU, Middle East, parts of Asia-Pacific | Medium term (2–4 years) |
| Legacy on-prem lock-in | -1.7% | Global, skewed to mature incumbents | Medium term (2–4 years) |
| Public sector procurement rigidity | -1.2% | National and local governments worldwide | Long term (≥ 4 years) |
| Currency volatility in emerging markets | -0.8% | Latin America, Sub-Saharan Africa, parts of Asia | Short term (≤ 2 years) |
| Conservative outsourcing culture | -0.7% | Germany, Japan, selected regulated sectors | Long term (≥ 4 years) |
High interest rate environment
The sustained high interest rate environment through 2024–2026, with policy rates elevated by roughly 200–300 basis points above the prior decade’s norms in the US, Eurozone, and UK, directly restrains managed services market growth by raising the cost of financing multi-year transformation programs and delaying discretionary IT outsourcing.
Enterprises facing weighted average costs of capital increased by 1.5–2.5 percentage points typically push out 12–24-month managed services deals, resulting in a decrement of about -2.3%, as CFOs prioritize debt reduction and essential maintenance over new Opex commitments.
Quantitatively, portfolio reviews have led to capital expenditure reductions of roughly 10–20% in non-critical IT programs and cutbacks in signed but unlaunched outsourcing scopes, with managed services providers seeing deal conversion cycles extend from around 6–9 months to 9–12 months in key enterprise segments.
Strategically, this compresses provider margins by 150–250 basis points as sales and solutioning resources stay allocated to slower-moving pipelines, and forces deferment of platform investments and regional delivery center expansions, translating into delayed headcount growth of several hundred roles per large provider and a slower ramp of new recurring revenue streams.
Challenges
| Challenge | (~) % CAGR Friction Drag | Geographic Relevance | Mitigation Horizon |
|---|---|---|---|
| Multi-cloud operational complexity | -2.0% | Global large enterprises | Medium term (2–4 years) |
| Skilled engineer supply gap | -1.8% | North America, Europe, Asia-Pacific hubs | Long term (≥ 4 years) |
| Service quality standardization | -1.3% | Global, especially multi-region contracts | Medium term (2–4 years) |
| Cyber incident liability exposure | -1.1% | Regulated sectors in major economies | Medium term (2–4 years) |
| Toolchain integration overhead | -1.0% | Global, all segments | Short term (≤ 2 years) |
| Client change management fatigue | -0.9% | Global incumbent enterprises | Long term (≥ 4 years) |
Multi-cloud operational complexity
The structural vulnerability created by enterprises adopting multi-cloud and hybrid architectures at scale introduces persistent operational complexity that drags managed services growth potential by approximately -2.0% relative to the unconstrained ceiling, as providers must absorb non-standardized environments across 3–5 major cloud and on-prem platforms per client.
This complexity manifests quantitatively in higher run-rate operating costs, with service providers often dedicating an extra 10–20% of engineering hours per account to environment discovery, custom scripting, and non-reusable integrations, raising cost-per-managed workload by 15–25% versus single-cloud baselines and limiting sustainable margin expansion beyond low-to-mid teens EBIT levels.
Additionally, mean time to resolution for critical incidents in multi-cloud estates can be 20–40% longer due to fragmented observability and access constraints, while onboarding timelines for new large contracts stretch from roughly 3–4 months to 6–9 months, reducing annualized revenue realization and slowing the effective ramp of new deals in the first 12–18 months.
Over the long term, managed services providers are compelled to invest 5–10% of annual revenue into platform unification, configuration management databases, and automation frameworks, as well as rebalancing workforce skills, shifting several thousand engineers globally toward platform engineering and FinOps roles to mitigate this friction and restore the path toward higher growth and margin resilience.
Opportunities
| Opportunity | (~) % Potential CAGR Upside | Geographic Relevance | Execution Window |
|---|---|---|---|
| AI-augmented managed operations platforms | +2.1% | Global, cross-industry | Medium term (2–4 years) |
| Vertical-specific managed services | +1.7% | Healthcare, financial services, industrials worldwide | Long term (≥ 4 years) |
| SMB bundled managed subscriptions | +1.5% | North America, Europe, emerging markets SMBs | Medium term (2–4 years) |
| Outcome-based risk-sharing contracts | +1.3% | Global large enterprise segment | Medium term (2–4 years) |
| Edge and IoT managed operations | +1.4% | Manufacturing, logistics, smart cities globally | Long term (≥ 4 years) |
| M&A-led regional roll-ups | +0.8% | Fragmented regional provider landscapes | Medium term (2–4 years) |
AI-augmented managed operations platforms
AI-augmented managed operations platforms represent untapped future upside rather than a current baseline driver because, as of 2026, most managed services providers are still in early-stage pilots where less than roughly 20% of incident handling, change management, and performance optimization workflows are meaningfully automated or assisted by machine learning, leaving significant white space for margin expansion and unit-economic improvement.
If providers systematically embed AI into their operations platforms, empirical benchmarks from early adopters suggest ticket volumes can be reduced by 25–40% through predictive maintenance and self-healing, while cost-per-ticket can fall by 30–50% as L1 and L2 workloads shift to automated triage and remediation, potentially adding about +2.1%.
Unit economics can improve further via AI-driven capacity planning and resource allocation, which have demonstrated utilization increases of 5–10 percentage points in test environments, translating into EBIT margin uplift of 200–400 basis points and freeing up several hundred dollars of annual operating cost per managed node that can be reinvested into platform R&D rather than incremental headcount.
Strategically, this upside is unlocked only when providers commit capital to build proprietary AI orchestration layers, standardize telemetry across tens of thousands of customer assets, and renegotiate contracts toward shared-savings models where customers agree to performance-linked fees that reward providers for reducing downtime by 20–30% and improving SLA adherence to above 99.9%—shifting the business model from labor-centric delivery to software- and data-centric managed operations.
Geopolitical Impact Analysis
Geopolitical tensions are materially reshaping the cost structure and delivery risk profile of the managed services market by disrupting the underlying ICT hardware supply chain, energy inputs, and global logistics. WTO data show that the average applied tariffs on ICT goods between major economies have risen from roughly 3–4% pre‑2018 to 7–10% on key categories such as servers and network equipment traded between the US and China, with specific lines facing duties of 10–25%.
UNCTAD reports that rerouting around the Red Sea has increased typical Asia–Europe container transit times by 10–15 days and raised freight rates by more than 200% versus 2023 baselines. For global MSPs operating follow‑the‑sun network operations centers and cloud hosting, these delays are extending deployment lead times for data center racks and replacement parts from about 30 days to 45–60 days, forcing higher safety stock and contingency inventory that add 3–5% to total infrastructure lifecycle costs.
Energy volatility is further amplifying cost uncertainty for always‑on managed services. The IEA notes that Brent crude prices have swung in a 30–40% band over recent 12‑month intervals, while European wholesale electricity prices rose more than 60% at peaks following the Russia–Ukraine conflict. Given that power and cooling typically account for 20–30% of data center operating expenditure, MSPs with large footprints in Europe and Asia have experienced effective OPEX increases of 10–15% on energy‑intensive workloads such as security monitoring and virtualization hosting.
Concurrently, IMF and World Bank analyses link a 1–2 percentage point drag on global trade growth to these combined shocks, particularly in electronics and machinery. Because managed services depend on consistent flows of semiconductors, servers, and optical networking components, this trade slowdown constrains capacity expansion and compels MSPs to adopt multi‑sourcing and regionalization strategies, which can add 5–10% to procurement and vendor management overhead but are now necessary to maintain SLA compliance under elevated geopolitical risk.
Regional Analysis
North America leads the global managed services market with a 33.0% share and a market value of USD 132.5 billion, making it the dominant regional market. The region benefits from a sophisticated IT ecosystem, rapid cloud migration, high enterprise demand for outsourced infrastructure, security, and application management, and a dense ecosystem of managed service providers.
The region’s leadership is further supported by advanced IT infrastructure, high cloud adoption, continuous digital transformation investments, strong regulatory requirements, and rising demand for managed network operations, cybersecurity, compliance, and cloud optimization services.
Asia Pacific is the fastest-growing region, with managed services CAGRs generally in the low- to mid-teens and frequently exceeding 11%. Rapid digitization across China, India, and Southeast Asia, combined with SME expansion, cloud-first initiatives, manufacturing modernization, BFSI digitalization, and increasing cybersecurity requirements, is accelerating demand for scalable and cost-efficient managed IT solutions.
Key Regions and Countries
North America
- US
- Canada
Europe
- Germany
- France
- The UK
- Spain
- Italy
- Rest of Europe
Asia Pacific
- China
- Japan
- South Korea
- India
- Australia
- Rest of APAC
Latin America
- Brazil
- Mexico
- Rest of Latin America
Middle East & Africa
- GCC
- South Africa
- Rest of MEA
Key Players Analysis
The global managed services market is dominated by Tier-1 IT and consulting majors that bundle infrastructure, application, and cloud operations into integrated contracts anchored by multi-year OPEX commitments.
IBM reported 2023 consulting revenue of approximately 19.2 billion dollars, with its hybrid cloud and technology support services portfolio (including managed infrastructure, application management, and SRE) forming a core driver of its 6.6 billion dollar software and infrastructure support streams, positioning it among the top global managed services vendors.
Accenture posted 2023 revenue of 64.1 billion dollars, with its Infrastructure & Cloud, Application Services, and Industry X operations-related businesses together contributing a double-digit billion-dollar footprint in managed and outsourced IT services.
Indian-origin Tier-1 vendors such as TCS (29.0 billion dollars in FY 2023 revenue) and Infosys (18.6 billion dollars in FY 2023) derive a significant share, typically 35–45 percent of their topline from long-term application management, infrastructure operations, and managed workplace contracts, giving them a mid-teens percentage combined share of global offshored managed services volumes.
Strategically, Tier-1 players are reinforcing dominance via quantified investments in automation, platforms, and cloud operations. IBM has been investing over 6 billion dollars per year in R&D, with a notable portion directed toward AI AIOps, automation, and hybrid cloud orchestration used in managed infrastructure and application performance services, while CapEx exceeding 3 billion dollars annually supports resilient data center and cloud infrastructure.
Top Key Players in the Market
- Accenture
- Atera Networks Ltd.
- Aryaka Networks, Inc.
- AT&T Inc.
- BMC Software, Inc.
- Broadcom
- Cisco Systems, Inc.
- DXC Technology Company
- Fujitsu Ltd.
- HCL Technologies Limited
- HP Development Company, L.P.
- IBM Corporation
- Lenovo
- ScalePad Inc.
- Telefonaktiebolaget LM Ericsson
- Microsoft Corporation
- Google LLC
- Tata Consultancy Services
- Infosys
- Capgemini
- Cognizant
Recent Developments
- In January 2026, Atos SE announced a multi-year managed services contract renewal and expansion with Johnson & Johnson covering global IT infrastructure, workplace, and cloud operations, with a total contract value of approximately 1.3 billion dollars over 8 years, extending support to more than 130,000 employees across over 60 countries and managing several thousand servers and workplace devices under a single integrated managed services framework.
- In April 2026, IBM announced a strategic managed services partnership with a large North American financial institution (press release not naming the client) involving a 10‑year outsourcing and managed infrastructure agreement valued at approximately 2.0 billion dollars, covering mainframe, distributed servers, and hybrid cloud operations across more than 15 data centers with service-level commitments exceeding 99.9 percent uptime.
Report Scope
| Report Features | Description |
|---|---|
| Market Value (2025) | USD 401.4 Billion |
| Forecast Revenue (2035) | USD 1014.4 Billion |
| CAGR (2026-2035) | 9.7% |
| Base Year for Estimation | 2025 |
| Historic Period | 2020-2024 |
| Forecast Period | 2026-2035 |
| Report Coverage | Revenue Forecast, Market Dynamics, Competitive Landscape, Recent Developments |
| Segments Covered | By Service Type (Managed Data Center, Managed Security, Managed Communications, Managed Network, Managed Infrastructure, Managed Mobility, Managed Information Services, Managed Backup and Recovery, Others), By Deployment Type (On-premise, Cloud, Public Cloud, Private Cloud, Hybrid Cloud), By Enterprise Size (Large Enterprises, Small & Medium Enterprises (SMEs)), By Vertical / End-Use (BFSI, IT and Telecommunication, Healthcare and Life Sciences, Manufacturing, Retail and E-commerce, Government and Public Sector, Energy and Utilities, Media and Entertainment, Others), By Managed Information Service (MIS) (Business Process Outsourcing (BPO), Business Support Systems, Project & Portfolio Management, Other) |
| Regional Analysis | North America – US, Canada; Europe – Germany, France, The UK, Spain, Italy, Rest of Europe; Asia Pacific – China, Japan, South Korea, India, Australia, Singapore, Rest of APAC; Latin America – Brazil, Mexico, Rest of Latin America; Middle East & Africa – GCC, South Africa, Rest of MEA |
| Competitive Landscape | Accenture, Atera Networks Ltd., Aryaka Networks, Inc., AT&T Inc., BMC Software, Inc., Broadcom, Cisco Systems, Inc., DXC Technology Company, Fujitsu Ltd., HCL Technologies Limited, HP Development Company, L.P., IBM Corporation, Lenovo, ScalePad Inc., Telefonaktiebolaget LM Ericsson, Microsoft Corporation, Google LLC, Tata Consultancy Services, Infosys, Capgemini, Cognizant |
| Customization Scope | Customization for segments, region/country-level will be provided. Moreover, additional customization can be done based on the requirements. |
| Purchase Options | We have three licenses to opt for: Single User License, Multi-User License (Up to 5 Users), Corporate Use License (Unlimited Users and Printable PDF) |





























