
Quick Navigation
Report Overview
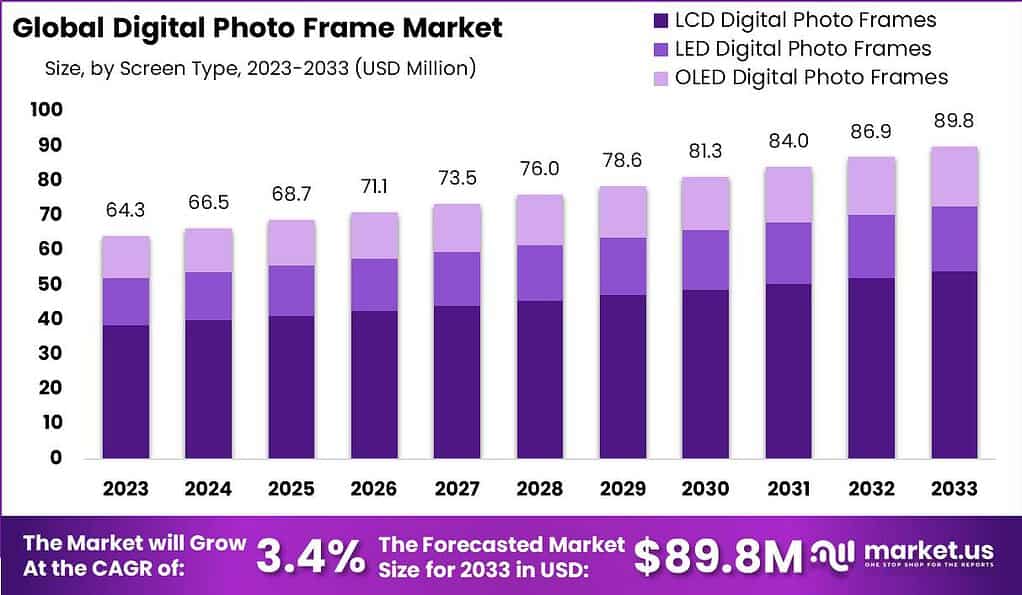
The Global Digital Photo Frame Market size is expected to be worth around USD 89.8 Million by 2033, from USD 64.3 Million in 2023, growing at a CAGR of 3.4% during the forecast period from 2024 to 2033.
A digital photo frame is a device that displays digital images, providing a modern and convenient way to showcase photographs. It typically consists of a high-resolution screen, internal memory or storage options, and various connectivity features such as USB ports or Wi-Fi capabilities. Users can upload their digital photos to the frame, which then cycles through the images in a slideshow format.
The market for digital photo frames has been influenced by several factors including the increasing availability of high-resolution digital cameras and smartphones, growing consumer interest in technologically advanced home decor products, and the rise of social media platforms where users regularly share and consume digital images. Advances in display technologies, such as OLED and high-definition screens, have further boosted the attractiveness of digital photo frames.
Market growth can be attributed to these technological enhancements as well as the aging population, particularly in regions like North America and Europe, where there is a higher preference for such convenient solutions to display cherished memories. Despite the prevalence of digital media on mobile and computer screens, digital photo frames retain a niche appeal due to their simplicity and the personalized touch they add to home and office spaces.
In 2023, Nixplay, a leading player in the digital photo frame market, successfully raised ~$15 million in a Series B funding round. This financial boost is intended to facilitate the expansion of Nixplay’s product portfolio and to enhance its footprint on the global stage. This strategic move underscores Nixplay’s commitment to broadening its market reach and reinforcing its competitive position in the industry.
Meanwhile, Aura, another key competitor in the digital frame sector, secured approximately ~$26 million in funding through a combination of debt and equity in 2022. This funding round was spearheaded by the Lago Innovation Fund. The capital injection is primarily being allocated to ramp up manufacturing capacities in the current quarter and to fund strategic initiatives planned for 2023.
Key Takeaways
- The Digital Photo Frame market is projected to reach USD 89.8 million by 2033, with a steady CAGR of 3.4% from 2024 to 2033. This growth is driven by factors such as increasing availability of high-resolution digital cameras and smartphones, alongside growing consumer interest in technologically advanced home decor products.
- LCD Digital Photo Frames held a dominant market position in 2023, capturing over 60% of the market share. This segment’s leadership is attributed to factors like cost-effectiveness, mature supply chain, and adaptability in various lighting conditions.
- Metal Digital Photo Frames led the market in 2023, holding more than a 35% share. This preference is driven by the premium aesthetics and durability of metal frames, making them suitable for contemporary home and office decor.
- The Plug-in segment dominated the market in 2023, capturing over 58% market share. Plug-in frames offer continuous operation without battery replacement, supporting higher functionalities and perceived eco-friendliness.
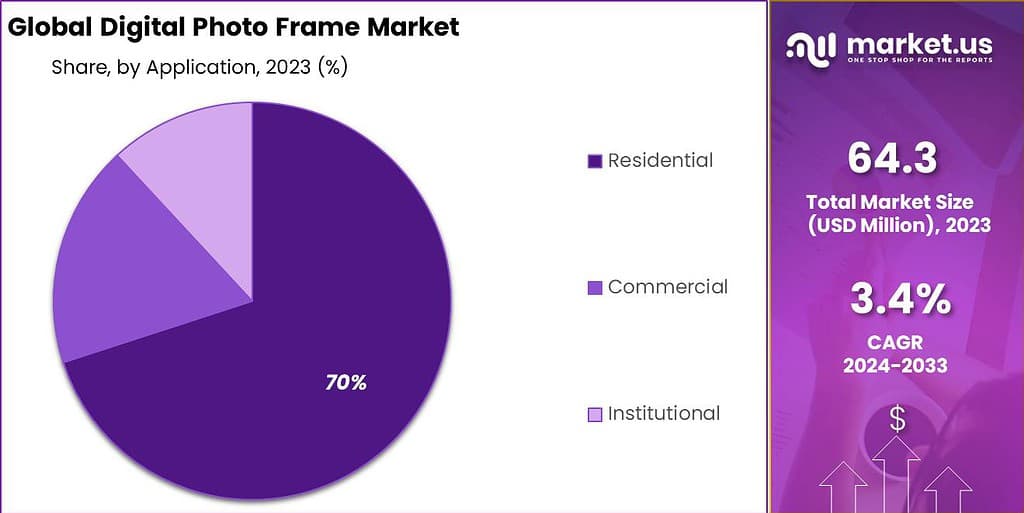
- Residential application accounted for over 70% of the market in 2023. The growing consumer interest in high-tech home decor solutions, integration with smart home technologies, and popularity as gifts contribute to the dominance of this segment.
- Online Retail held a dominant position in 2023, capturing over 42% of the market share. This is attributed to the convenience, wider selection, and better pricing available through online platforms, supported by the surge in e-commerce sales.
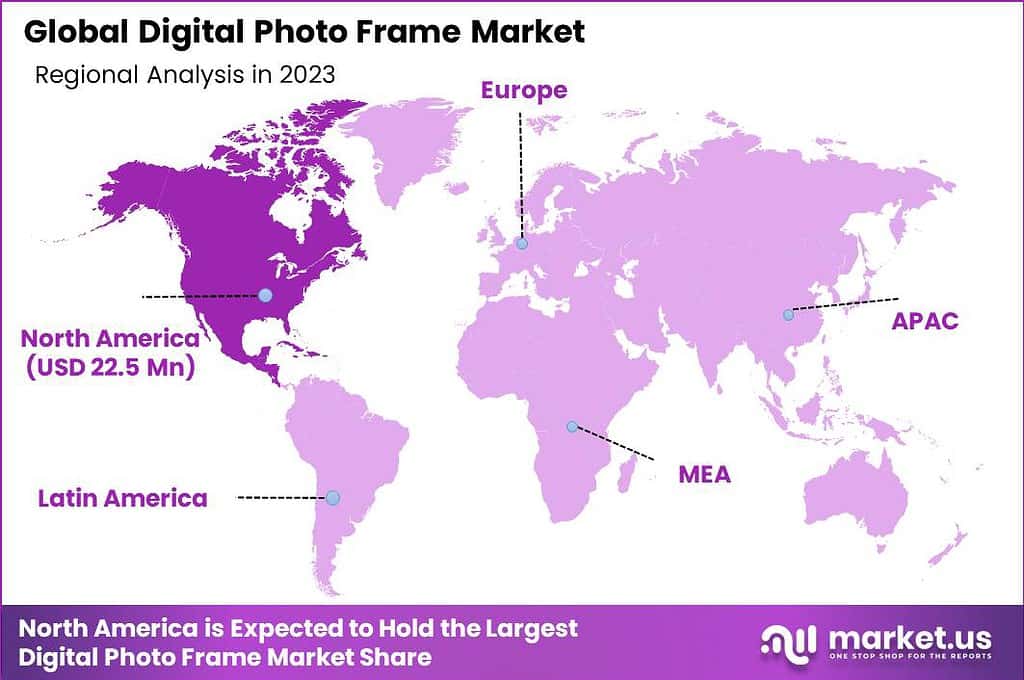
- In 2023, North America held a dominant market position in the digital photo frame market, capturing more than a 35% share.
Screen Type Analysis
In 2023, the LCD Digital Photo Frames segment held a dominant market position, capturing more than 60% of the market share. This segment’s leadership can be attributed to several factors that appeal to both consumers and manufacturers. LCD technology, known for its cost-effectiveness and widespread availability, remains a preferred choice in the digital photo frame market. These frames offer sufficient display quality for viewing photographs at a relatively lower price point compared to OLED and LED options, making them accessible to a broader consumer base.
Additionally, LCD Digital Photo Frames benefit from a mature supply chain and production technology that has been optimized over years. This has allowed manufacturers to scale production efficiently and maintain lower production costs, which in turn supports competitive retail pricing. The technology’s adaptability in various lighting conditions also enhances its appeal in household environments, contributing to its substantial market share.
The segment’s growth is further supported by ongoing innovations in LCD technology, including improved color accuracy and energy efficiency. These enhancements make LCD frames more attractive to environmentally conscious consumers and those seeking higher-quality displays without the premium cost associated with OLED technology.
Frame Material Analysis
In 2023, the Metal Digital Photo Frames segment held a dominant market position, capturing more than a 35% share of the market. This leadership can be primarily attributed to the premium aesthetics and durability that metal frames offer.
Metal digital photo frames are often favored for their sleek, modern designs that easily complement contemporary home and office decor. Their robust construction also ensures longevity, making them a preferred choice for consumers seeking quality and durability, which justifies their higher price point compared to frames made of other materials.
Moreover, metal frames have been increasingly adopted in corporate and luxury settings, where a sophisticated appearance is crucial. The preference for metal frames in these environments has driven their market share. Additionally, the ability to customize metal frames with various finishes and colors appeals to a segment of consumers looking for personalized decor options, further bolstering their market dominance.
The segment’s growth is also supported by innovations in metal processing and coating technologies that enhance the aesthetic appeal and functional properties of these frames, such as improved scratch resistance and lighter weight. As manufacturers continue to refine these processes, metal digital photo frames are expected to maintain their market lead, driven by a combination of style, functionality, and innovation.
Power Source Analysis
In 2023, the Plug-in segment of the digital photo frame market held a dominant position, capturing more than a 58% market share. This segment’s leadership can be attributed to several key factors that resonate with both consumer preferences and technological advantages. Firstly, plug-in digital photo frames offer continuous operation without the need for battery replacement or recharging. This convenience factor is highly valued in settings where the digital photo frame is used for prolonged display, such as in corporate environments, reception areas, and living rooms.
Additionally, plug-in frames tend to support higher functionalities, including larger screen sizes, higher resolutions, and more robust connectivity features like Wi-Fi and Bluetooth, which are less constrained by power limitations than their battery-operated counterparts. The preference for plug-in digital photo frames is further reinforced by their cost-effectiveness over the long term. Although battery-operated frames provide the advantage of portability and are favored in settings where power outlets are not readily available, the ongoing cost of battery replacement contributes to higher total cost of ownership.
Furthermore, plug-in digital photo frames are perceived as more eco-friendly compared to battery-operated alternatives, which aligns with the growing consumer inclination towards sustainable products. Market trends also show that plug-in frames are increasingly being designed with smart features, such as integration with cloud services, social media, and streaming apps, enhancing their appeal as a multifunctional household and office gadget.
Application Analysis
In 2023, the Residential segment held a dominant market position in the digital photo frame industry, capturing more than a 70% share. This significant market dominance can be primarily attributed to the increasing consumer interest in high-tech home decor solutions that enhance the aesthetic appeal and functionality of living spaces.
Digital photo frames in residential settings serve not just as picture displays but as dynamic elements of home decoration that can easily be updated with new photos and videos, thereby keeping living environments vibrant and personalized.
The growth of the Residential segment is further bolstered by the expansion of smart home technologies, where digital photo frames are integrated with other devices to create a connected and interactive home environment. Features such as Wi-Fi connectivity, social media integration, and cloud storage have made these frames more versatile and appealing to the tech-savvy homeowner.
Additionally, the trend towards gift-giving of tech products has seen digital photo frames become popular choices for weddings, anniversaries, and other personal celebrations, aiding their market penetration and growth in residential applications.
Moreover, the ease of use, with features like remote updating and compatibility with multiple digital formats, supports the ongoing preference for digital photo frames in homes. The aesthetic versatility of these frames, which can be customized to match various interior designs, also adds to their appeal. With advancements in display technologies leading to better picture quality and more energy-efficient designs, the Residential segment is set to maintain its lead in the market, catering to consumers’ evolving preferences for innovative and functional home technology.
Distribution Channel Analysis
In 2023, the Online Retail segment held a dominant market position in the digital photo frame market, capturing more than a 42% share. This segment’s leadership can be attributed to the growing consumer preference for online shopping, driven by the convenience, wider selection, and often better pricing available through online platforms. The ability to compare different models, read customer reviews, and find the best deals without the need to visit physical stores has significantly boosted the appeal of purchasing digital photo frames online.
The surge in e-commerce sales has been supported by improvements in logistics and the increasing reliability of online payment systems, which enhance consumer confidence in buying electronic gadgets like digital photo frames online. Additionally, online retailers often offer more detailed product specifications and virtual demonstrations, providing a richer buying experience that can be accessed from the comfort of one’s home.
Promotional strategies such as discounts, bundled offers, and free shipping have also played a crucial role in driving the sales volumes in this segment. Furthermore, the trend towards digital gifting, where consumers purchase digital photo frames online and have them shipped directly to the recipient, has been another growth driver for the online retail segment.
As the market continues to evolve, online retailers are likely to further solidify their position by leveraging advanced technologies such as augmented reality (AR) to offer virtual try-out features, enhancing customer engagement and satisfaction. The Online Retail segment’s robust growth trajectory is expected to continue, underpinned by the ongoing shift towards digital consumption patterns and the increasing integration of e-commerce into consumer electronics retailing.
Key Market Segments
By Screen Type
- LCD Digital Photo Frames
- LED Digital Photo Frames
- OLED Digital Photo Frames
By Frame Material
- Metal Digital Photo Frames
- Wood Digital Photo Frames
- Plastic Digital Photo Frames
- Other Frame Materials
By Power Source
- Battery-operated
- Plug-in
By Application
- Residential
- Commercial (e.g. retail, advertising)
- Institutional (e.g. educational institutions, museums)
By Distribution Channel
- Online Retail
- Offline Retail
Driver
Technological Advancements in Display Technologies
The digital photo frame market is significantly driven by continuous advancements in display technologies. Innovations such as high-resolution OLED and LED screens, which offer superior brightness and color accuracy, enhance the visual appeal of digital photo frames, making them more attractive to consumers.
These technological improvements not only deliver better image quality but also expand the functionality of photo frames to include features like touch-screen interfaces, motion sensors, and connectivity with mobile and cloud-based applications. As these frames become more interactive and user-friendly, the demand for them increases across various consumer segments, thereby driving market growth.
Restraint
High Cost of Advanced Models
A major restraint in the digital photo frame market is the high cost associated with the more advanced models. These frames, equipped with the latest technology such as Wi-Fi connectivity, high-resolution displays, and extensive memory capacity, are often priced significantly higher than basic models.
This price difference can deter budget-conscious consumers, limiting the market’s penetration among lower income brackets. Additionally, the ongoing global economic volatility and inflationary pressures can further exacerbate cost concerns, influencing consumers to opt for cheaper alternatives or forego purchases altogether.
Opportunity
Integration with Smart Home Systems
An emerging opportunity in the digital photo frame market is the potential integration of these devices with smart home systems. As homes become increasingly connected, digital photo frames that can seamlessly integrate with other smart home devices and systems present a significant growth opportunity.
For instance, frames that can display art or photos based on room occupancy or frames that change displays in sync with music or lighting settings enhance the utility and attractiveness of smart home ecosystems. This integration not only boosts the functional appeal of digital photo frames but also positions them as an integral part of the smart home value proposition.
Challenge
Privacy and Security Concerns
A key challenge facing the digital photo frame market is addressing consumer concerns regarding privacy and data security. With many digital frames now offering cloud connectivity for storing and sharing photos, there is a heightened risk of data breaches and unauthorized access to personal photos.
Ensuring robust security measures and encryption protocols is crucial to maintaining consumer trust and encouraging wider adoption. Moreover, the industry must navigate varying global data protection regulations, which can complicate the development and marketing of these devices, potentially limiting their market expansion.
Growth Factors
- Increasing Demand for Connected Devices: The rise of IoT and smart home ecosystems has boosted demand for connected devices, including digital photo frames that offer Wi-Fi and Bluetooth capabilities, allowing for seamless integration and enhanced functionality.
- Advances in Display Technology: Innovations in display quality, such as higher resolutions and better color accuracy, make digital photo frames more appealing for displaying high-quality photographs and videos, thereby attracting more consumers.
- Aging Population: An increasing number of elderly consumers who appreciate digital photo frames for their ease of use and the ability to display digital memories without the need for technical expertise represents a growing demographic for this market.
- Expansion of E-commerce: The growth of online retail platforms has made it easier for consumers to purchase digital photo frames, broadened the range of available products, and enhanced consumer awareness through reviews and ratings.
- Digital Gifting Culture: Digital photo frames are becoming popular gifts due to their personalization capabilities and emotional value, especially during holidays and special occasions like weddings and anniversaries.
Emerging Trends
- Integration with Artificial Intelligence: AI integration is becoming common in digital photo frames for features like facial recognition to automatically sort and display pictures or create reminders for updating displayed content.
- Eco-Friendly and Energy-Efficient Models: As sustainability becomes more important to consumers, manufacturers are increasingly focusing on producing energy-efficient models with eco-friendly materials and packaging.
- Augmented Reality Features: Some digital photo frames are beginning to incorporate augmented reality (AR) to allow users to interact with displayed images in innovative ways, enhancing user engagement.
- Enhanced Connectivity Features: The inclusion of cloud services, social media integration, and real-time photo-sharing capabilities are making digital photo frames more interactive and connected, aligning with modern lifestyle trends.
- Diversification of Use Cases: Beyond residential use, digital photo frames are being tailored for commercial and institutional settings, equipped with features suited for advertising, educational tools, or digital signage, broadening their applications.
Regional Analysis
In 2023, North America held a dominant market position in the digital photo frame market, capturing more than a 35% share. This significant market presence is largely attributed to the high consumer purchasing power and the widespread adoption of technology in households across the region.
North America, particularly the United States, has a robust consumer electronics market characterized by high demand for the latest and most innovative technologies, which includes digital photo frames. The region’s consumers are keen on devices that enhance their home aesthetics and offer convenience, a demand that digital photo frames meet by seamlessly integrating with other smart home devices.
The demand for Digital Photo Frame in North America was valued at USD 22.5 Million in 2023 and is anticipated to grow significantly in the forecast period. The market dominance in North America is also supported by a well-established retail infrastructure, both online and offline, that facilitates easy access to a wide range of digital photo frame products.
Online retail giants and specialized electronics stores in the region play a crucial role in the distribution and promotion of these devices, often partnering with manufacturers for exclusive launches and promotions, thereby driving sales. Additionally, the presence of major technology companies in North America, which are often at the forefront of introducing innovative features in digital photo frames, such as Wi-Fi connectivity and cloud storage, further propels the market growth in this region.
Furthermore, digital photo frames in North America are increasingly being adopted in commercial settings, such as offices and retail environments, where they are used not just for display but also for branding and advertising purposes. This expanded use case contributes to the ongoing growth and dominance of the North American market in the global digital photo frame industry. The market is expected to continue its growth trajectory, supported by technological advancements and the increasing consumer inclination towards connected and aesthetically pleasing home devices.
Key Regions and Countries Covered in this Report:
- North America
- The US
- Canada
- Europe
- Germany
- France
- The UK
- Spain
- Italy
- Russia
- Netherland
- Rest of Europe
- APAC
- China
- Japan
- South Korea
- India
- Australia
- New Zealand
- Singapore
- Thailand
- Vietnam
- Rest of APAC
- Latin America
- Brazil
- Mexico
- Rest of Latin America
- Middle East & Africa
- South Africa
- Saudi Arabia
- UAE
- Rest of MEA
Key Players Analysis
The Digital Photo Frame Market Key Players Analysis involves the comprehensive evaluation of the prominent companies operating in the digital photo frame industry. These key players play a crucial role in shaping the market landscape through their innovative products, strategic initiatives, and market presence.
The analysis typically encompasses various aspects such as company profiles, financial performance, product portfolio, market share, and strategic collaborations. By examining the strategies and activities of key players, stakeholders gain valuable insights into the competitive dynamics of the market and can make informed decisions regarding investments, partnerships, and expansion strategies.
Top Market Leaders
- Nixplay
- Aluratek
- Pix-Star
- ViewSonic
- Sungale
- Sony Corporation
- Kodak
- Micca
- Philips
- Dragon Touch
- HP Inc.
- Aura Frames
- Other Key Players
Recent Developments
- In 2023, Nixplay introduced Nix-Cast, a feature that allows users to share photos and videos directly from their devices to connected TVs during events like weddings and family gatherings. This innovation is part of Nixplay’s broader strategy to enhance the sharing experience and make it more dynamic across different platform.
- In 2023, Sungale launched new products: the Sungale CPF1032+ and CPF2200 Cloud Frame models, which boast aesthetic upgrades and enhanced display qualities like HD Anti-Glare screens. The CPF1032+ features a 10-inch display, while the CPF2200 offers users a larger, high-quality viewing experience with its 21-inch screen, perfect for displaying digital photos.
- Micca Classic Series Digital Photo Frames (N7, N8, N10) – This series offers vibrant high-resolution screens, ranging from 7 to 10 inches, and supports various multimedia formats including JPEG photos, MP3 music, and MP4/MKV videos up to 1080P. These frames come equipped with useful features like slideshow transitions, background music options, and an energy-saving auto power On/Off scheduling
Report Scope
| Report Features | Description |
|---|---|
| Market Value (2023) | USD 64.3 Mn |
| Forecast Revenue (2032) | USD 89.8 Mn |
| CAGR (2024-2033) | 3.4% |
| Base Year for Estimation | 2023 |
| Historic Period | 2018-2022 |
| Forecast Period | 2024-2033 |
| Report Coverage | Revenue Forecast, Market Dynamics, COVID-19 Impact, Competitive Landscape, Recent Developments |
| Segments Covered | By Screen Type (LCD Digital Photo Frames, LED Digital Photo Frames, OLED Digital Photo Frames) , By Frame Material (Metal Digital Photo Frames, Wood Digital Photo Frames, Plastic Digital Photo Frames, Other Frame Materials), By Power Source (Battery-operated, Plug-in), By Application (Residential, Commercial (e.g., retail, advertising), Institutional (e.g., educational institutions, museums)), By Distribution Channel (Online Retail, Offline Retail) |
| Regional Analysis | North America – The U.S. & Canada; Europe – Germany, France, The UK, Spain, Italy, Russia, Netherlands & Rest of Europe; APAC- China, Japan, South Korea, India, Australia, New Zealand, Singapore, Thailand, Vietnam & Rest of APAC; Latin America- Brazil, Mexico & Rest of Latin America; Middle East & Africa- South Africa, Saudi Arabia, UAE & Rest of MEA |
| Competitive Landscape | Nixplay, Aluratek, Pix-Star, ViewSonic, Sungale, Sony Corporation, Kodak, Micca, Philips, Dragon Touch, HP Inc., Aura Frames, Other Key Players |
| Customization Scope | Customization for segments, region/country-level will be provided. Moreover, additional customization can be done based on the requirements. |
| Purchase Options | We have three license to opt for: Single User License, Multi-User License (Up to 5 Users), Corporate Use License (Unlimited User and Printable PDF) |
Frequently Asked Questions (FAQ)
A digital photo frame is an electronic device that displays digital photos without the need for printing or physical storage. It typically consists of an LCD or LED screen and internal memory or card slots to store and display digital images.
The Global Digital Photo Frame Market size is expected to be worth around USD 89.8 Million by 2033, from USD 64.3 Million in 2023, growing at a CAGR of 3.4% during the forecast period from 2024 to 2033.
The major companies covered by the Digital Photo Frame Market report are Nixplay, Aluratek, Pix-Star, ViewSonic, Sungale, Sony Corporation, Kodak, Micca, Philips, Dragon Touch, HP Inc., Aura Frames, Other Key Players
In 2023, the LCD Digital Photo Frames segment held a dominant market position, capturing more than 60% of the market share.
The digital photo frames market is primarily driven by factors such as increasing digitalization of photo storage and sharing, growing demand for personalized and tech-savvy home decor solutions, and advancements in display technology leading to higher resolution and more immersive viewing experiences. Additionally
The market faces challenges such as competition from alternative devices like tablets and smartphones that also offer photo display capabilities, concerns about data security and privacy with internet-connected frames, and price sensitivity among consumers, particularly in regions with limited disposable income.


