


Report Overview
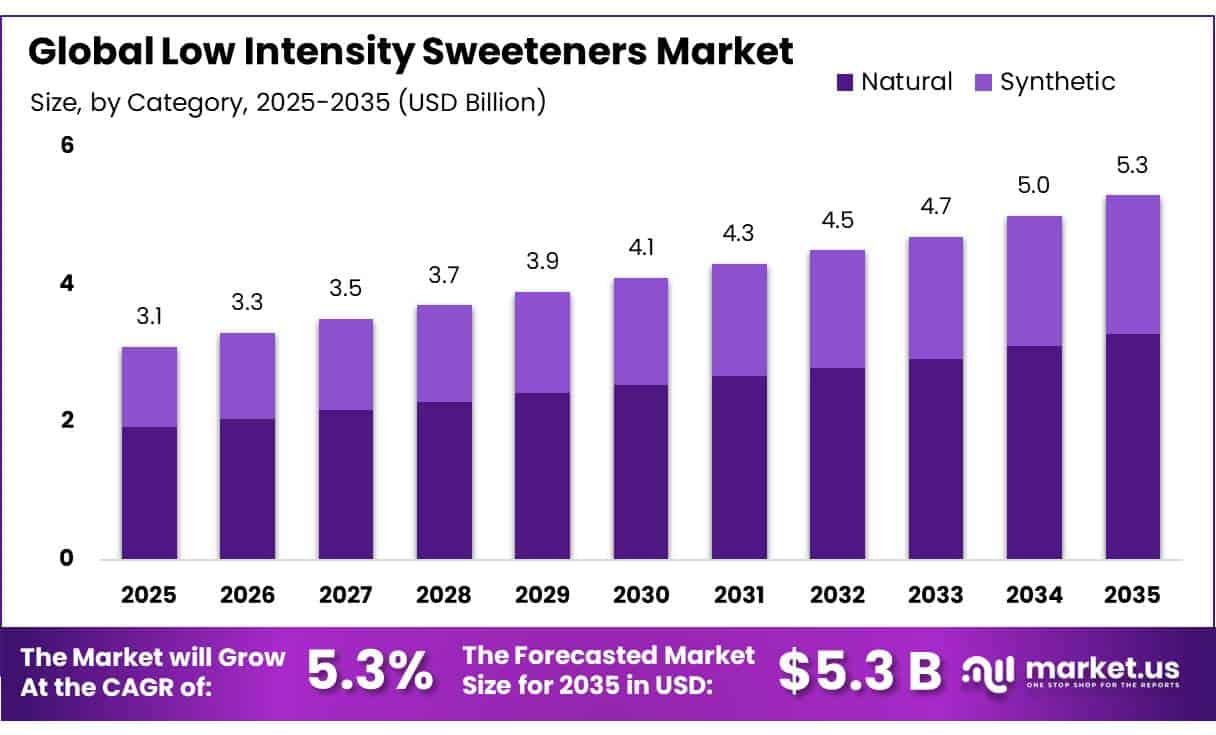
In 2025, the Global Low Intensity Sweeteners Market valued at USD 3.1 billion, and between 2026 and 2035, this market is estimated to register a CAGR of 5.3%, reaching about USD 5.3 billion by 2035. Asia Pacific held a dominant market position, capturing more than a 35.6% share, holding USD 1.1 billion in revenue.
Low-intensity sweeteners are becoming an important formulation tool for food, beverage, bakery, confectionery, dairy and nutrition manufacturers that want to reduce conventional sugar while keeping product bulk, texture and mouthfeel. The group mainly includes polyols such as erythritol, sorbitol, xylitol, maltitol, mannitol, isomalt and lactitol, together with rare sugars such as allulose. The European Commission currently lists 8 polyol sweeteners for use in sugar-free or reduced-energy foods.
- OECD-FAO projects global sugar consumption to rise by 1.2% per year and reach 202 million tonnes by 2034, while global sugar production is expected to increase by 15%, from 178 million tonnes to 205 million tonnes. This creates a broad base for partial sugar replacement rather than complete elimination.
Key Takeaways
- Low Intensity Sweeteners Market valued at USD 3.1 billion, and between 2026 and 2035, this market is estimated to register a CAGR of 5.3%, reaching about USD 5.3 billion by 2035.
- Xylitol held a dominant market position, capturing more than a 31.00% share.
- Natural held a dominant market position, capturing more than a 62.00% share.
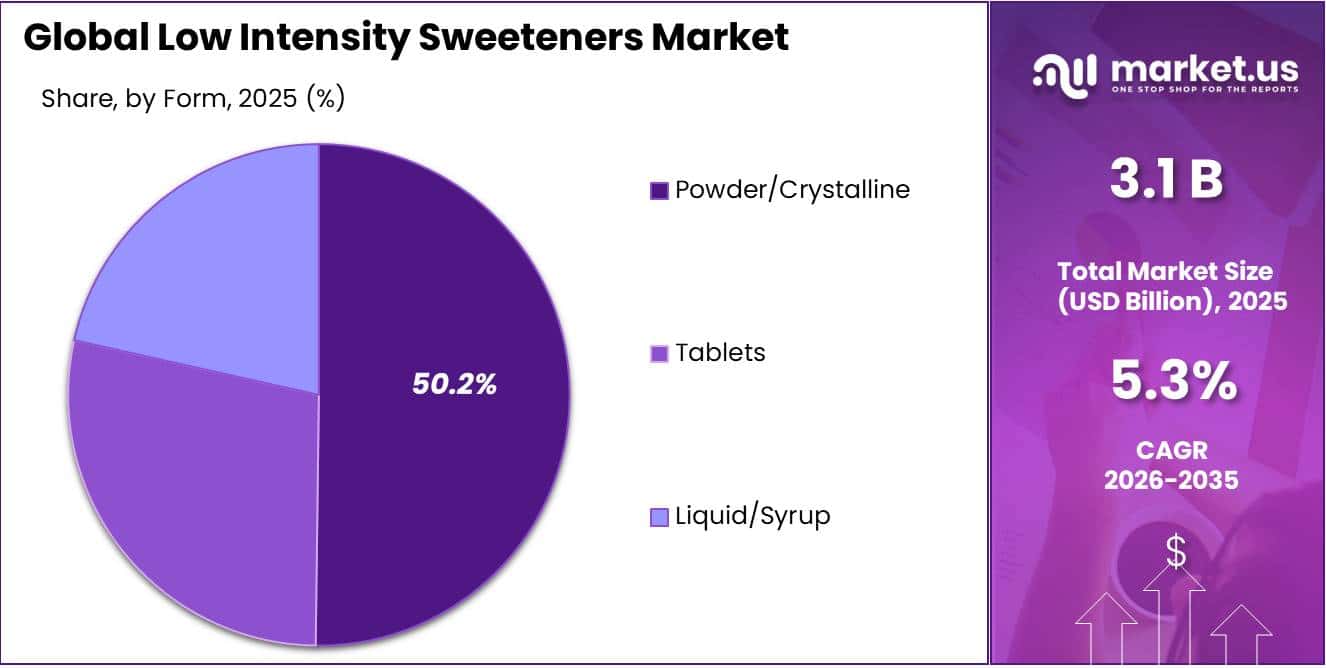
- Powder/Crystalline held a dominant market position, capturing more than a 50.00% share.
- Food & Beverage held a dominant market position, capturing more than a 38.40% share.
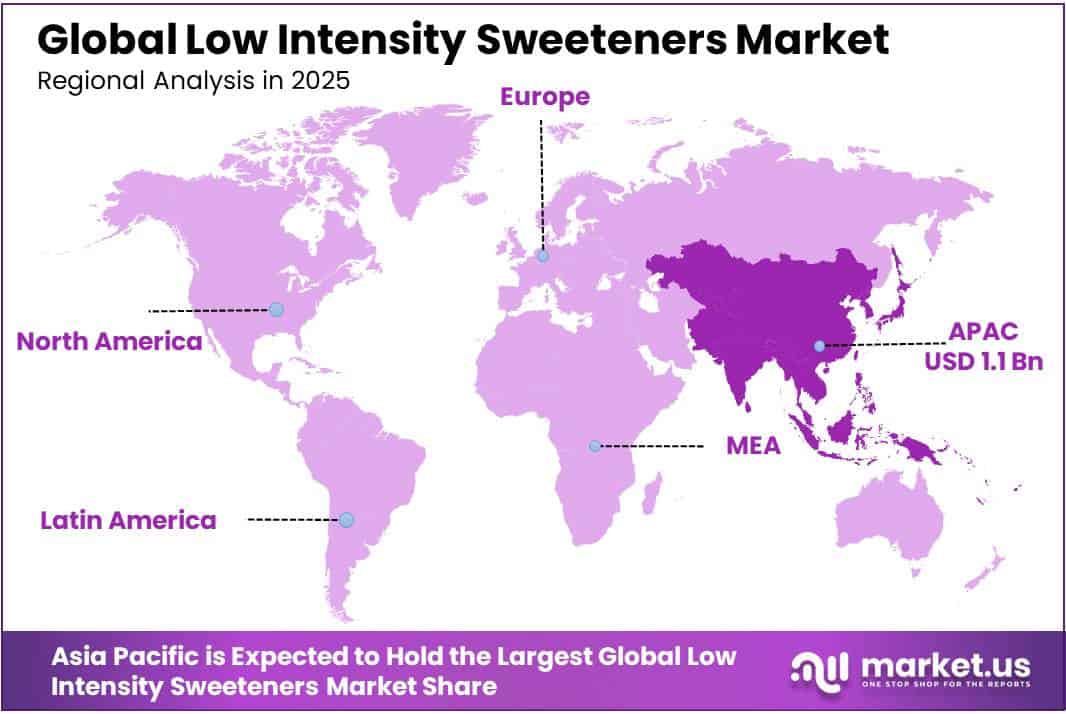
- Asia Pacific held the dominant position in 2025, accounting for 35.60% of the Low Intensity Sweeteners market and about USD 1.12 billion.
Health policy is another major demand driver. WHO recommends keeping free sugars below 10% of total daily energy intake and notes that reducing intake to 5% or less may provide additional health benefits. For a 2,000-calorie diet, the 10% level equals about 50 grams of free sugars per day. This guidance continues to encourage lower-sugar reformulation across beverages, snacks, confectionery and dairy products.
Allulose is particularly attractive because U.S. regulation supports meaningful calorie reduction. FDA allows manufacturers, under its current enforcement-discretion approach, to use 0.4 kcal per gram for allulose compared with 4 kcal per gram for traditional sugars, and to exclude allulose from Total Sugars and Added Sugars declarations. This supports formulations that retain bulk while lowering declared sugar and calories.
Polyols also have a strong regulatory and technical position, although dosage control remains important. EFSA set an acceptable daily intake for erythritol of 0.5 grams per kilogram of body weight per day and retained the warning requirement for foods containing more than 10% added polyols. In the EU, erythritol is authorized in certain energy-reduced or no-added-sugar flavoured drinks at up to 16,000 mg/L as a flavour enhancer.
Feedstock availability supports industrial scaling. USDA estimated 95.3 million acres of U.S. corn planted in 2026, while corn stocks on June 1 reached 5.29 billion bushels, up 14% from a year earlier. Since several bulk sweeteners are produced through starch conversion, hydrogenation or fermentation, a large carbohydrate feedstock base can support higher output, fermentation investment and better cost efficiency.
By Product Type Analysis
Xylitol dominates the product type segment with more than 31.00% share.
In 2025, “Xylitol” held a dominant market position, capturing more than a 31.00% share. Xylitol remains widely used in sugar-free confectionery, chewing gum, bakery products and other reduced-sugar formulations because it provides sweetness while supplying fewer calories than conventional sugar.
Under current U.S. FDA nutrition-labeling rules applicable in 2026, xylitol is assigned an energy value of 2.4 calories per gram, compared with the standard 4 calories per gram generally used for carbohydrates. This lower energy contribution supports its use in calorie-reduced and sugar-replacement formulations.
Erythritol continues to strengthen its position in the low-intensity sweeteners market because it can provide bulk and sweetness while contributing very little dietary energy. Under current FDA nutrition-labeling guidance, erythritol is assigned 0 calories per gram, while xylitol is assigned 2.4 calories per gram. FDA also recognizes sugar alcohols such as erythritol for use in products including sugar-free candies, cookies and chewing gums.
By Category Analysis
Natural sweeteners lead the category with more than 62.00% share
In 2025, “Natural” held a dominant market position, capturing more than a 62.00% share. The segment benefits from wider use of ingredients such as erythritol, xylitol and other low-calorie sugar alternatives in confectionery, bakery, beverages and reduced-sugar foods.
In 2026, the U.S. FDA continued to recognize sugar alcohols as permitted sugar substitutes, with their sweetness ranging from 25% to 100% of conventional sugar. Their lower-calorie characteristics and ability to provide bulk make them useful in products where manufacturers want to reduce traditional sugar without heavily changing texture.
Synthetic low-intensity sweeteners continue to hold an important position in 2025 as food manufacturers use industrially processed sugar substitutes to control sweetness, calories, texture and moisture. Current U.S. regulations applicable in 2026 assign different caloric factors to commonly used sugar alcohols, including 2.1 calories per gram for maltitol, 2.6 calories per gram for sorbitol and 1.6 calories per gram for mannitol.
By Form Analysis
Powder/Crystalline dominates the form segment with more than 50.00% share
In 2025, “Powder/Crystalline” held a dominant market position, capturing more than a 50.00% share. The form is widely preferred for xylitol, erythritol and other low-intensity sweeteners because dry crystals or powders are convenient to store, transport, blend and dose during industrial food processing.
Government data also support the use of these ingredients in reduced-calorie products. Under current U.S. FDA nutrition-labeling guidance, xylitol provides 2.4 calories per gram, while erythritol is assigned 0 calories per gram.
Liquid/Syrup forms continue to hold an important position in 2025 as food and beverage manufacturers require sweeteners that can be pumped, mixed and dispersed easily through liquid production lines. Sorbitol and hydrogenated glucose syrups are particularly useful where sweetness must be combined with moisture retention, texture control and product stability.
The U.S. FDA reports that sugar alcohols generally provide around 25% to 100% of the sweetness of conventional sugar, giving manufacturers flexibility when designing liquid reduced-sugar formulations.
By Application Analysis
Food & Beverage dominates the application segment with more than 38.40% share.
In 2025, “Food & Beverage” held a dominant market position, capturing more than a 38.40% share. The segment benefits from the growing need to reduce conventional sugar while maintaining sweetness, texture and product stability in beverages and processed foods.
In its 2026 review of fermentation-derived erythritol, the U.S. FDA listed a maximum use level of 3.5% for flavored quenchers and 3.5% for reduced- and low-calorie carbonated and non-carbonated drinks. These approved intended-use levels show the practical role of low-intensity sweeteners in beverage reformulation and support continued adoption by manufacturers developing lower-sugar products.
Bakery & Confectionery continues to be an important application area for low-intensity sweeteners in 2025, particularly in cakes, cookies, chewing gum, hard candy and reduced-sugar confectionery.
According to the U.S. FDA’s 2026 erythritol review, intended maximum use levels reached 25% in cakes, 15% in cookies and 15% in baked goods and baking mixes. These application levels show how erythritol can provide both sweetness and bulk in formulations where conventional sugar normally contributes strongly to product structure and mouthfeel.
Key Market Segments
By Product Type
- Xylitol
- Erythritol
- Maltitol
- Tagatose
- Allulose
- Trehalose
- Isomaltulose
- Others
By Category
- Natural
- Synthetic
By Form
- Powder/Crystalline
- Liquid/Syrup
- Tablets
By Application
- Bakery & Confectionery
- Food & Beverages
- Dairy & Frozen Desserts
- Tabletop Sweeteners
- Others
Driver Analysis
Sugar-tax reformulation demand
More than 100 countries have implemented sugar-sweetened beverage tax measures, while policy design is increasingly threshold-based rather than flat-rate, rewarding formulations that cross below defined sugar cut-offs. The UK’s confirmed strengthening of the Soft Drinks Industry Levy lowers the applicable threshold from 5.0 g to 4.5 g total sugar per 100 mL and extends the incentive framework to milk-based and plant-based drinks containing added sugar.
France applies a progressive charge beginning at €3.50 per hectolitre for beverages containing up to 1 kg of added sugar per hectolitre, escalating with sugar content, while Chile applies an 18% rate to drinks above 6.25 g/100 mL versus 10% below that threshold. Low-intensity sweeteners matter commercially because they replace not only sweetness but also sugar’s bulk, freezing-point depression, viscosity, browning, solids, and water-binding functions; a beverage or confectionery producer can therefore reduce sucrose by 20–50% without creating the thin mouthfeel, weak body, or off-note exposure that can result from a high-intensity sweetener-only approach.
The near-term value capture shifts toward blended systems—polyol plus stevia, allulose plus monk-fruit, or erythritol plus flavour modulators—where ingredient suppliers sell formulation performance rather than commodity sweetness, supporting the estimated +1.4 percentage-point uplift to the baseline CAGR.
Drivers Impact Analysis
| Driver | (~) % Impact on CAGR Forecast | Geographic Relevance | Impact Timeline |
|---|---|---|---|
| Sugar-tax reformulation demand | +1.4 pp | EU, UK, Mexico, Chile, APAC cities | Short term (≤ 2 years) |
| Allulose label-value expansion | +1.2 pp | North America core, Japan, South Korea | Medium term (2–4 years) |
| GLP-1 and metabolic nutrition | +0.9 pp | US, Canada, Western Europe, GCC | Short term (≤ 2 years) |
| Texture-led reduced-sugar innovation | +1.1 pp | North America, EU, Japan, China | Medium term (2–4 years) |
| Polyol supply-chain localization | +0.7 pp | China, India, ASEAN, EU | Medium term (2–4 years) |
| Clean-label and oral-care demand | +0.6 pp | Europe, North America, APAC | Long term (≥ 4 years) |
Restraint Analysis
Erythritol trade duties
The underlying petition alleged dumping margins of 270.00% to 450.64%, while the final duty structure for at least one major Chinese supplier combined an 84.95% antidumping duty with an 8.63% countervailing duty, or 93.58% in aggregate. Europe presents a similarly disruptive supply environment: duties reported on Chinese erythritol range from 34.4% to 233.3% and were applied retroactively from 7 June 2024, making inventory valuation and import-cost forecasting particularly difficult.
For a product where the sweetener can account for roughly 15–35% of the ingredient cost in sugar-free gum, confectionery, powder mixes, and low-calorie beverages, even a 20–40% increase in delivered erythritol cost can erase the economic benefit of replacing sugar, especially when the formulation also requires stevia, flavours, fibres, acids, or hydrocolloids; the resulting effects are reformulation delays, increased working-capital needs, lower procurement visibility, and a shift toward higher-cost domestic or third-country capacity, supporting an estimated -1.5 percentage-point drag on CAGR through 2027–2028.
Restraint Impact Analysis
| Restraint | (~) % Impact on CAGR | Geographic Relevance | Impact Timeline |
|---|---|---|---|
| Erythritol trade duties | -1.5 pp | North America, EU, China | Short term (≤ 2 years) |
| Fragmented allulose approvals | -1.3 pp | EU, Canada, India, ASEAN | Medium term (2–4 years) |
| Safety and tolerance scrutiny | -1.0 pp | EU, North America, APAC | Short term (≤ 2 years) |
| High conversion and energy costs | -0.9 pp | China, EU, North America | Medium term (2–4 years) |
| Sensory-performance limits | -0.8 pp | Global food & beverage markets | Medium term (2–4 years) |
| Clean-label substitution risk | -0.6 pp | North America, EU, Japan | Long term (≥ 4 years) |
Opportunity Analysis
Tagatose label-led platforms
D-tagatose creates an underexploited premium formulation opportunity because FDA enforcement discretion issued in November 2025 allows it to be excluded from both “Total Sugars” and “Added Sugars” on US Nutrition Facts labels, while assigning 1.5 kcal/g versus 4 kcal/g for conventional sugars; this is a future commercialization pivot rather than a baseline driver because most packaged-food portfolios have not yet been reformulated around tagatose-specific label architecture.
The white space lies in creating proprietary “zero declared sugar” platforms for yoghurt, nutrition beverages, flavoured milk, ice cream, bars, confectionery, and bakery, where a manufacturer can replace 25–60% of sucrose by weight while preserving bulk and browning more effectively than high-intensity sweeteners alone; a 12 g sucrose reduction per serving removes 48 kcal, whereas an equivalent tagatose-based solids system could contribute roughly 18 kcal before blend optimization.
The commercial model is attractive because suppliers can monetize tagatose through protected recipe systems, label-compliance support, sensory application services, and multi-year supply contracts instead of commodity ingredient sales; adoption across even a limited set of high-volume North American reduced-sugar portfolios could justify a +1.5 percentage-point CAGR upside, although it depends on scaling low-cost production and carefully managing gastrointestinal tolerance thresholds.
Opportunity Impact Analysis
| Opportunity | (~) % Potential CAGR Upside | Geographic Relevance | Execution Window |
|---|---|---|---|
| Tagatose label-led platforms | +1.5 pp | North America, Japan, South Korea | Short term (≤ 2 years) |
| Precision-fermented rare sugars | +1.4 pp | North America, EU, China, Singapore | Medium term (2–4 years) |
| GLP-1 clinical nutrition | +1.1 pp | US, Canada, Western Europe, GCC | Short term (≤ 2 years) |
| Oral-health ingredient systems | +0.9 pp | Europe, Japan, North America, India | Medium term (2–4 years) |
| Regional blend-and-formulate hubs | +0.8 pp | India, ASEAN, LATAM, MENA | Medium term (2–4 years) |
| M&A and IP-platform roll-ups | +0.7 pp | North America, EU, China, Japan | Long term (≥ 4 years) |
Challenges Analysis
Formulation talent shortage
A single successful reformulation project in bakery, confectionery, or dairy typically requires 4–8 sensory trial iterations and 3–6 months of pilot-scale validation, and understaffed R&D teams routinely see this cycle extend to 9–14 months, delaying product launches and eroding first-mover advantage in reduced-sugar shelf space.
Companies are responding by building internal sensory-science academies, extending retention packages by 15–20% above standard food-science compensation bands, and forming co-development partnerships with flavour houses to externalize part of the formulation burden; absent faster talent-pipeline development through university-industry programs, this bottleneck is expected to persistently shave approximately -0.9 percentage points off achievable CAGR through 2029–2030.
Challenges Impact Analysis
| Challenge | (~) % CAGR Friction | Geographic Relevance | Mitigation Horizon |
|---|---|---|---|
| Formulation talent shortage | -0.9 pp | North America, EU, China | Medium term (2–4 years) |
| Feedstock price volatility | -1.1 pp | Global, corn/starch corridors | Medium term (2–4 years) |
| Multi-jurisdiction label complexity | -0.8 pp | EU, North America, APAC | Long term (≥ 4 years) |
| Fermentation yield inconsistency | -1.0 pp | China, EU, North America | Medium term (2–4 years) |
| Cold-chain-free logistics fragmentation | -0.6 pp | ASEAN, LATAM, MENA, Africa | Short term (≤ 2 years) |
| Consumer trust and messaging drift | -0.7 pp | North America, EU, Japan | Long term (≥ 4 years) |
Geopolitical Impact Analysis
Ongoing Wars Raise Feedstock, Energy and Logistics Risks for Low Intensity Sweeteners
The ongoing Russia–Ukraine war and the 2026 Middle East conflict are creating fresh supply-chain pressure for the Low Intensity Sweeteners market. Producers of xylitol, erythritol, sorbitol and related polyols depend on corn, glucose, starch, energy, chemicals and international freight, making the industry sensitive to disruptions in agricultural and maritime trade.
- USDA’s August 2026 outlook reduced Ukraine’s 2026/27 corn exports to 22 million tonnes, down by 1 million tonnes from its previous forecast, citing logistical disruption from increased Black Sea hostilities. Lower or less predictable grain flows can raise procurement risk for glucose- and starch-based sweetener producers, particularly in Europe.
The Middle East conflict is adding another cost layer. FAO stated that the conflict beginning on February 28, 2026 created a major shock to global energy, fertilizer and agrifood inputs. UNCTAD also reports that maritime transport carries more than 80% of world merchandise trade by volume, while disruptions around Hormuz and other chokepoints are increasing transport and production costs.
Regional Insights
Asia Pacific Dominates with 35.60% Share and USD 1.12 Billion
Asia Pacific held the dominant position in 2025, accounting for 35.60% of the Low Intensity Sweeteners market and about USD 1.12 billion. The region benefits from strong demand across confectionery, bakery, beverages, dairy, and convenience foods.
Japan’s Agriculture & Livestock Industries Corporation reported in 2025 that sugar and sweetened-preparation consumption totaled 2.26 million tonnes, with confectionery and frozen sweets representing 32.9%, soft drinks and alcoholic beverages 17.9%, and bread 11.4%.
North America is positioned as the fastest-growing regional segment as food manufacturers respond to stronger sugar-reduction and nutrition-labeling priorities. The U.S. FDA’s 2026 Human Foods Program includes an added-sugar reduction strategy, a proposed “low added sugar” claim, and evaluation of low- or no-calorie alternative sweeteners.
FDA guidance also allows allulose to be calculated at 0.4 calories per gram compared with 4 calories per gram for traditional sugar. These rules improve the commercial appeal of low-intensity sweeteners in reduced-sugar beverages, bakery, confectionery, and nutrition products, supporting faster reformulation, wider ingredient adoption, and continued innovation across the North American food industry overall.
Key Regions and Countries Insights
- North America
- US
- Canada
- Europe
- Germany
- France
- The UK
- Spain
- Italy
- Rest of Europe
- Asia Pacific
- China
- Japan
- South Korea
- India
- Australia
- Rest of APAC
- Latin America
- Brazil
- Mexico
- Rest of Latin America
- Middle East & Africa
- GCC
- South Africa
- Rest of MEA
Key Players Analysis
Cargill, Incorporated remains an ingredient supplier in the Low Intensity Sweeteners market through its polyol and reduced-sugar formulation capabilities. In fiscal 2026, the company generated USD 164 billion in revenue and employed more than 155,000 people across 70 countries.
Ingredion Incorporated holds a strong position in Low Intensity Sweeteners through its portfolio of erythritol, sorbitol, maltitol, mannitol and polyol systems. In 2025, the company recorded USD 7.219 billion in net sales and USD 1.016 billion in operating income, while employing more than 11,000 people and serving customers in over 120 countries. Its erythritol solutions deliver about 70% of sucrose sweetness with roughly 0.2 calories per gram, supporting reduced-sugar confectionery, bakery, dairy, beverage and nutrition formulations worldwide at scale.
Roquette Frères S.A. is a well-established Low Intensity Sweeteners supplier with more than 70 years of polyol expertise and products including sorbitol, maltitol, mannitol and xylitol. In 2025, Roquette generated EUR 4.877 billion in turnover, up 8%, while current EBITDA reached EUR 612 million with a 12.6% margin.
Top Key Players Outlook
- Cargill, Incorporated
- Ingredion Incorporated
- Roquette Frères S.A.
- Archer Daniels Midland Company
- Tate & Lyle PLC
- Matsutani Chemical Industry Co., Ltd.
- Südzucker AG
- Tereos S.A.
- Gulshan Polyols Limited
- Jungbunzlauer Suisse AG
- Zhejiang Huakang Pharmaceutical Co., Ltd.
- SPI Pharma, Inc.
- Ecogreen Oleochemicals Pte. Ltd.
- Mitsubishi Corporation Life Sciences Limited
- B Food Science Co., Ltd.
Recent Developments
- In May 2026, ADM also announced a multimillion-dollar upgrade at its Clinton corn-processing site, adding 2 receiving pits capable of 25,000 bushels per hour each, strengthening the upstream corn-processing platform that feeds starch, glucose and sweetener production.
- Südzucker generated EUR 8.352 billion in revenue in fiscal 2025/26, while its Special Products segment, which includes BENEO, contributed EUR 2.216 billion in revenue and EUR 177 million in operating profit.
Report Scope
| Report Features | Description |
|---|---|
| Market Value (2025) | USD 3.1 Bn |
| Forecast Revenue (2035) | USD 5.3 Bn |
| CAGR (2026-2035) | 5.3% |
| Base Year for Estimation | 2025 |
| Historic Period | 2020-2024 |
| Forecast Period | 2026-2035 |
| Report Coverage | Revenue Forecast, Market Dynamics, Competitive Landscape, Recent Developments |
| Segments Covered | By Product Type (Xylitol, Erythritol, Maltitol, Tagatose, Allulose, Trehalose, Isomaltulose, Others), By Category ( Natural, Synthetic), By Form (Powder/Crystalline, Liquid/Syrup, Tablets), By Application (Bakery & Confectionery, Food & Beverages, Dairy & Frozen Desserts, Tabletop Sweeteners, Others) |
| Regional Analysis | North America – US, Canada; Europe – Germany, France, The UK, Spain, Italy, Rest of Europe; Asia Pacific – China, Japan, South Korea, India, Australia, Singapore, Rest of APAC; Latin America – Brazil, Mexico, Rest of Latin America; Middle East & Africa – GCC, South Africa, Rest of MEA |
| Competitive Landscape | Cargill, Incorporated, Ingredion Incorporated, Roquette Frères S.A., Archer Daniels Midland Company, Tate & Lyle PLC, Matsutani Chemical Industry Co., Ltd., Südzucker AG, Tereos S.A., Gulshan Polyols Limited, Jungbunzlauer Suisse AG, Zhejiang Huakang Pharmaceutical Co., Ltd., SPI Pharma, Inc., Ecogreen Oleochemicals Pte. Ltd., Mitsubishi Corporation Life Sciences Limited, B Food Science Co., Ltd. |
| Customization Scope | Customization for segments, region/country-level will be provided. Moreover, additional customization can be done based on the requirements. |
| Purchase Options | We have three licenses to opt for: Single User License, Multi-User License (Up to 5 Users), Corporate Use License (Unlimited User and Printable PDF) |





































