


Report Overview
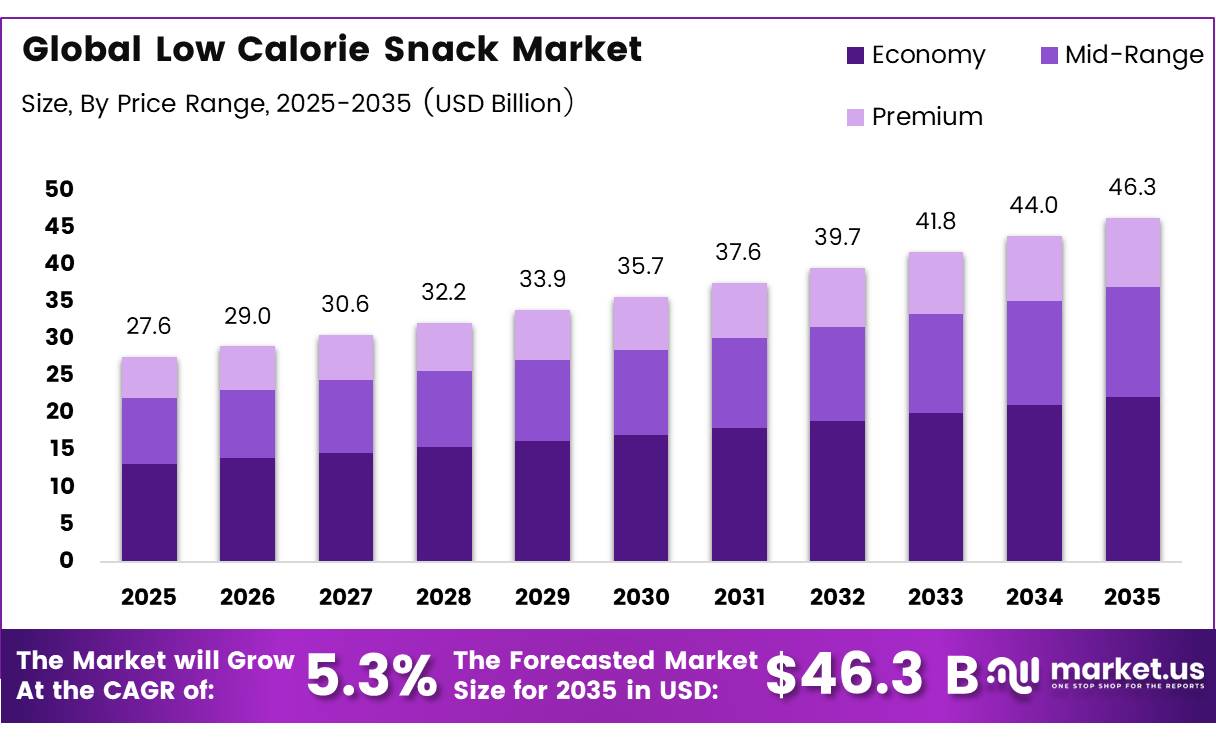
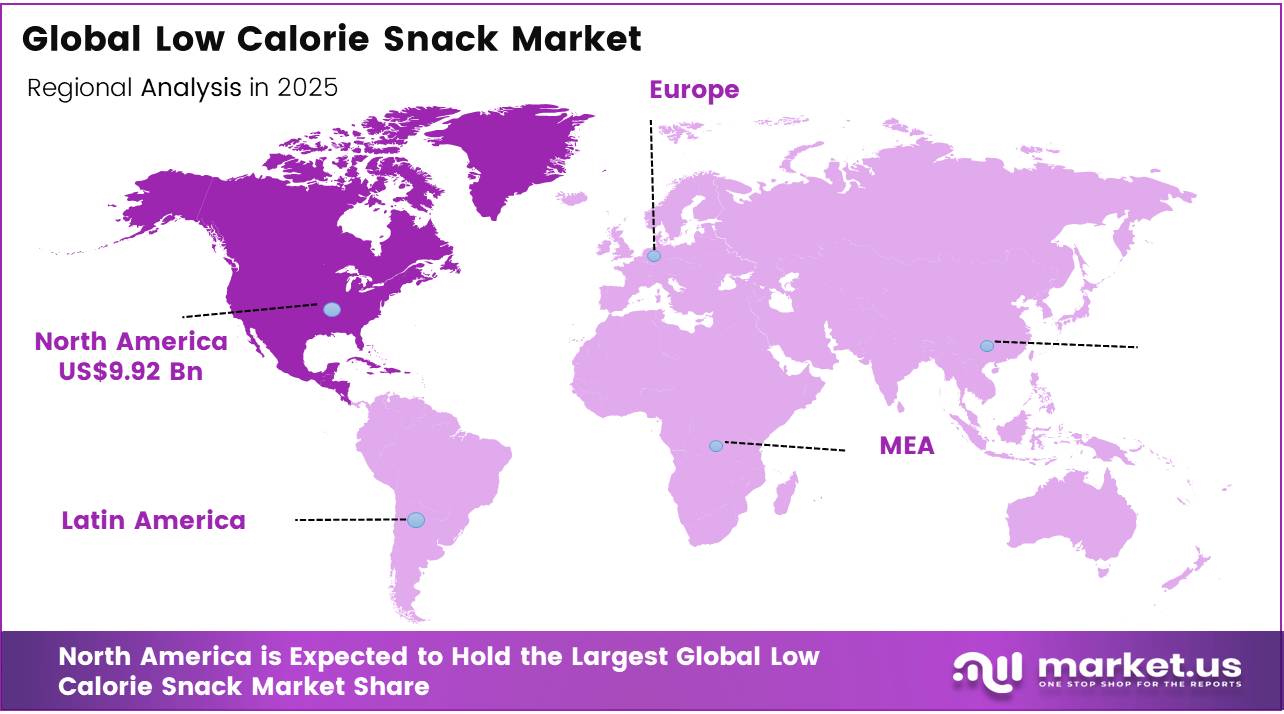
In 2025, the Global Low Calorie Snack Market was valued at USD 27.6 billion, and between 2026 and 2035, this market is estimated to register a CAGR of 5.3%, reaching about USD 46.3 billion by 2035. In 2025, North America held a dominant market position, capturing more than a 36% share, holding USD 9.92 Billion revenue.
Low-calorie snacks comprise portion-controlled foods designed to deliver convenience and sensory satisfaction while limiting energy intake. The category includes baked chips, popcorn, rice cakes, fruit and vegetable snacks, low-fat dairy snacks, protein bars, whole-grain crackers and reduced-sugar confectionery. Regulatory definitions are important because low-calorie positioning must be supported by nutrition data.
- Under U.S. Food and Drug Administration requirements, a food described as “low calorie” generally must contain no more than 40 calories per reference amount, while a “reduced calorie” product must contain at least 25% fewer calories than an appropriate reference food.
The low-calorie snack industry is developing around portion-controlled, reduced-sugar, baked, high-protein and fibre-rich products designed for convenient eating. Demand is supported by frequent snacking and meal replacement. In 2025, 70% of Americans reported snacking at least once daily, while 62% replaced traditional meals with snacks or smaller eating occasions, according to IFIC.
Health concerns are strengthening reformulation activity. The 2025 IFIC survey found that 75% of Americans were trying to limit or avoid sugar, and 71% were trying to consume protein. Globally, WHO reported that 43% of adults were overweight and 16% were living with obesity in 2022, reinforcing consumer interest in products offering controlled calories, improved satiety and clearer nutritional value.
Regulation is also reshaping competition. In January 2025, the U.S. FDA proposed front-of-package labelling that would classify saturated fat, sodium and added sugars as “Low,” “Med” or “High.” This direction encourages manufacturers to improve recipes and simplify labels. Future opportunities are expected in plant-based protein snacks, vegetable crisps, low-sugar bars, air-popped formats and functional products containing fibre or probiotics. Growth will increasingly depend on taste, affordability, transparent ingredients and packaging suited to workplace, travel and online retail channels.
Key Takeaways
- The global Low Calorie Snack market was valued at USD 27.6 billion in 2025.
- The global market is projected to grow at a CAGR of 5.3% and is estimated to reach USD 46.3 billion by 2035.
- Savory Snacks Low Calorie Snack dominated the market, constituting 35.0% of the total market share.
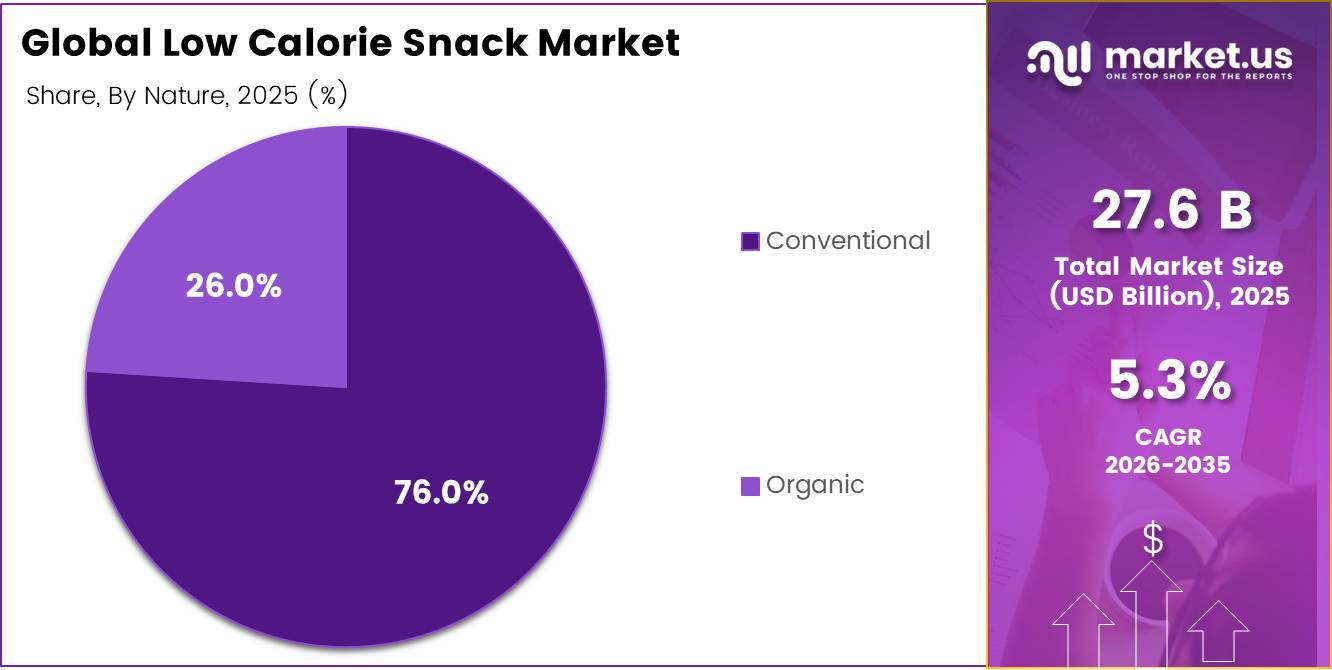
- Conventional dominated the Low Calorie Snack market, with a substantial market share of around 76.0%
- Pouches led the market, comprising 42.0% of the total market.
- Economy held a major share in the Low Calorie Snack market, 48.0% of the market share.
- Offline is the most considerable within the market, accounting for around 78% of the revenue.
- In 2025, the North America was the most dominant region in the Low Calorie Snack market, accounting for 36.0% of the total global consumption.
Product Type Analysis
Savory Snacks represents dominant Segment in the Market
In 2025, Savory Snacks held the leading position with a 35.0% market share, supported by their convenience, familiar flavours and wide availability across retail channels. However, health concerns are pushing producers toward baked, portion-controlled and lower-sodium varieties. The U.S. Centers for Disease Control and Prevention reported that Americans consume more than 3,400 mg of sodium daily, compared with the federal recommendation of below 2,300 mg. Chips, crackers and savory snacks are also listed among the major dietary sodium sources, creating a clear reformulation opportunity for low-calorie brands.
Protein Bars & Granola is emerging as the growing segment, driven by demand for portable snacks containing protein, fibre and whole grains. USDA data showed that Americans consumed only 8.1 grams of fibre per 1,000 calories, reaching just 58% of the recommended 14 grams. This nutritional gap supports further development of fibre-rich granola, reduced-sugar bars and products combining grains, seeds and plant proteins.
Nature Analysis
Conventional is a significant nature
In 2025, Conventional low-calorie snacks led the market with a 76.0% share, supported by affordable pricing, familiar ingredients and widespread retail availability. The need for accessible calorie-controlled foods remains strong. CDC data released in 2025 showed that, during 2024, every U.S. state and territory recorded adult obesity prevalence of at least 25%, while rates reached 35.9% in the Midwest and 34.5% in the South. The FDA’s January 2025 proposal to place “Low,” “Med” or “High” indicators for sodium, saturated fat and added sugars on most packaged foods is also encouraging conventional snack producers to reformulate recipes.
Organic low-calorie snacks are emerging as the growing segment, supported by cleaner-label preferences and a widening supply of certified ingredients. In March 2025, USDA Economic Research Service reported that the value of U.S. organic food imports increased to USD 5.7 billion in 2024. This expanding supply base creates room for organic granola, baked snacks, nut mixes and fruit-based products with controlled calories.
Packaging Type Analysis
Pouches Are the Most Widely Used Packaging Type
In 2025, Pouches held the leading position with a 42.0% market share, supported by their light weight, resealable designs and suitability for portion-controlled snacks. They help brands keep products fresh while reducing transport space compared with rigid formats. UK government packaging records showed that producers placed 1,387,860 tonnes of plastic packaging on the market during 2024, reflecting the material’s established scale. However, the 2025–2026 plastic packaging disposal fee reached £423 per tonne, encouraging lighter pouch designs and reduced material use.
Boxes and cartons particularly for granola, protein snacks and multipacks that require stronger shelf presentation. Their growth is supported by easier recycling and expanding paper-based packaging capacity. For 2025–2026, the UK government set the disposal fee for paper and card at £196 per tonne, less than half the plastic rate. This cost difference may encourage snack producers to adopt recyclable cartons and thinner inner liners.
Price Range Analysis
Economy low-calorie snacks Held a Major Share of the Low Calorie Snack Market
Economy low–calorie snacks held the leading position with a 48.0% market share, supported by affordable prices, smaller pack sizes and easy availability across mass retail channels. Value remains central to purchasing decisions because U.S. households spent an average of USD 6,224 on food at home in 2024, according to the U.S. Bureau of Labor Statistics. This spending environment favours reasonably priced popcorn, baked crackers and portion-controlled cereal snacks that offer convenience without adding pressure to household budgets.
Premium low-calorie snacks are emerging as the growing segment, supported by consumer interest in organic ingredients, plant proteins, natural sweeteners and cleaner formulations. In September 2024, the USDA announced USD 50.5 million to support research and extension activities for producers growing and marketing organic food and other organic products. This investment can strengthen the supply of higher-quality ingredients used in premium granola, nut-based snacks and protein-rich products.
Distribution Channel Analysis
Low Calorie Snacks Are Mostly Utilized in the Offline channels
In 2025, Offline channels held the leading position with a 78.0% market share, supported by immediate product access, visible shelf placement and the ability to compare flavours, prices and nutrition labels before purchasing. Supermarkets, grocery stores and convenience outlets remain particularly important for routine and impulse snack purchases. In February 2026, the U.S. Census Bureau reported that grocery-store sales increased 2.0% during October–December 2025 compared with the same period in 2024. This steady physical-store activity continues to support affordable multipacks, single-serve products and new low-calorie snack launches.
Online and direct-to-consumer is the growing segment, helped by home delivery, subscriptions and easier access to specialist products. Census data showed that non-store retailer sales increased 6.3% during October–December 2025 from the corresponding 2024 period. This faster growth gives snack manufacturers opportunities to sell personalized bundles, trial packs and products for specific dietary needs directly to consumers.
Key Market Segments
By Product Type
- Savory Snacks
- Protein Bars & Granola
- Nuts And Seeds
- Dairy Snacks
- Confectionery
- Others
By Nature
- Coated Separator
- Non-coated Separator
By Packaging Type
- Pouches
- Bags
- Boxes and Cartons
- Cans
- Jars
- Others
By Price Range
- Economy
- Mid-Range
- Premium
By Distribution Channel
- Online & Direct-To-Consumer (D2c)
- Digital Brand Communities
- Subscription Boxes
- Offline
- Supermarkets and Hypermarkets
- Convenience Stores
- Specialty and Health-Food Stores
- Others
Driver Analysis
Label-led reformulation and healthy-claim compliance
The updated U.S. FDA framework for the voluntary “healthy” claim, announced in December 2024, ties eligibility to meaningful food-group content plus limits on added sugars, saturated fat, and sodium, while the FDA’s separate front-of-pack proposal would surface “low,” “med,” or “high” signals for saturated fat, sodium, and added sugars on most packaged foods.
A 2026 study summary reported consumers were willing to pay about 59% more on average for a healthy product with an FDA-endorsed label versus an unlabeled option, which implies that low calorie snack suppliers able to meet claim criteria can lift both sell-through and price realization rather than relying only on promotional volume.
Drivers Impact Analysis
| Driver | (~) % Impact on CAGR Forecast | Geographic Relevance | Impact Timeline |
|---|---|---|---|
| Label-led reformulation and healthy-claim compliance | +1.2% | North America core, EU, ANZ urban retail | Short term (≤ 2 years) |
| Protein-fiber nutrient density shift | +1.6% | North America core, EU, APAC metros | Medium term (2-4 years) |
| GLP-1 aligned snack positioning | +1.0% | U.S. core, Canada, UK, selective EU spill-over | Short term (≤ 2 years) |
| HFSS restrictions and sugar-reduction substitution | +0.9% | UK core, EU policy-sensitive markets, Gulf urban retail | Medium term (2-4 years) |
| Private label and value architecture expansion | +1.1% | North America, Western Europe, India modern trade | Short term (≤ 2 years) |
| Convenience, e-commerce, and portion-control formats | +1.3% | APAC corridors, North America, EU convenience retail | Medium term (2-4 years) |
Restraint Analysis
Retail price ceilings and consumer affordability
Guidance on low-calorie product development emphasizes the importance of recognizable ingredients and avoidance of chemical-sounding lists, but achieving that while maintaining reduced-calorie formulations can reduce opportunities for aggressive cost-down through synthetics, reinforcing the premium cost base. In markets like India and Latin America, where per capita snack expenditure is more constrained, the difference of even ₹5–₹10 per pack can materially change basket composition, causing consumers to reserve low calorie snacks for occasional use rather than regular habit.
For manufacturers, this translates into lower throughput on dedicated lines, slower payback on reformulation investments, and a need to absorb margin pressure during promotions to maintain trial, thereby reducing the effective CAGR contribution of low calorie segments compared with theoretical demand curves suggested by health-conscious urban consumers.
Restraint Impact Analysis
| Restraint | (~) % Impact on CAGR Forecast | Geographic Relevance | Impact Timeline |
|---|---|---|---|
| High-cost functional ingredients | -1.5% | North America core, EU, Japan | Short term (≤ 2 years) |
| Formulation taste–texture trade-offs | -1.2% | Global branded portfolios | Medium term (2-4 years) |
| Regulatory and labeling compliance burden | -0.9% | North America, EU, India | Medium term (2-4 years) |
| Fragmented and temperature-sensitive supply chains | -1.3% | APAC corridors, emerging markets | Long term (≥ 4 years) |
| Retail price ceilings and consumer affordability | -1.4% | North America core, EU, LATAM | Short term (≤ 2 years) |
| Private label and promotional pressure | -1.1% | North America, EU modern trade | Medium term (2-4 years) |
Opportunity Analysis
GLP-1 and metabolic health snack adjacencies
As GLP-1 therapies and medically supervised weight-loss programmes expand through 2030–2035, the pool of consumers with reduced appetite but heightened focus on protein density, muscle preservation, and glycaemic control could exceed tens of millions across the U.S., Europe, and urban APAC, translating into a multi-billion dollar adjacent TAM for snacks that deliver 15–20 grams of protein, controlled net carbs, and 150–250 calories per serving in convenient formats.
Today, most brands offer generic “high protein” or “low sugar” SKUs, but the opportunity lies in building dedicated metabolic health lines with physician-aligned macronutrient ratios, clinical branding partnerships, and pharmacy or digital-health distribution, which could support 3–5 percentage points higher gross margins than standard low calorie products and lower churn due to programme adherence cycles of 6–12 months. If leading manufacturers capture even 10–15 percent of this emerging segment through tailored product architectures and co-marketing with telehealth and weight-management platforms, the incremental contribution to overall category CAGR could be in the range of 1.5–2.0 percentage points above current forecasts, driven more by mix upgrade and higher ARPU than sheer volume growth.
Opportunity Impact Analysis
| Opportunity | (~) % Potential CAGR Upside | Geographic Relevance | Execution Window |
|---|---|---|---|
| GLP-1 and metabolic health snack adjacencies | +1.8% | North America core, EU, urban APAC | Short term (≤ 2 years) |
| D2C subscription and data-driven personalization | +1.5% | North America, EU, India metros | Medium term (2-4 years) |
| Emerging-market healthy snacking penetration | +2.0% | India, China, ASEAN, LATAM | Long term (≥ 4 years) |
| Functional nutrition co-branding and licensing | +1.3% | Global branded portfolios | Medium term (2-4 years) |
| Co-manufacturing platforms and M&A roll-ups | +1.6% | North America, EU, APAC corridors | Medium term (2-4 years) |
| Institutional and B2B snacking channels | +1.2% | Global urban and corporate hubs | Long term (≥ 4 years) |
Challenges Analysis
Volatile input and packaging costs
Volatile input and packaging costs are a systemic challenge rather than a hard restraint because raw materials, energy, and packaging prices continue to move within broad bands that do not freeze production but do create persistent margin volatility and planning risk, with food industry data showing that 82 percent of operators reported higher food costs in 2025 compared with the prior year and USDA outlooks for 2026 placing grocery inflation in a highly uncertain range from roughly flat to mid-single-digit increases.
For low calorie snacks, the friction is amplified by reliance on higher-value ingredients and more sophisticated packaging, which can see cost swings of 5–15 percent year-on-year driven by global energy prices, agricultural yield fluctuations, and resin markets, forcing manufacturers to revise price lists, absorb margin hits, or reengineer products more frequently than conventional snacks. The operational impact shows up as rolling re-quotations to retailers, tighter contract windows of 6–12 months instead of multi-year agreements, higher variance in gross margin, and incremental working capital tied up in safety stock to buffer spot-market spikes, all of which drag on the maximum CAGR by constraining aggressive expansion plans and delaying new line approvals until input cost trajectories appear stable enough to support target returns.
Challenges Impact Analysis
| Challenge | (~) % CAGR Friction Drag | Geographic Relevance | Mitigation Horizon |
|---|---|---|---|
| Volatile input and packaging costs | -1.1% | North America core, EU hubs, APAC | Medium term (2-4 years) |
| Complex protein and texture engineering | -1.0% | Global healthy snack producers | Long term (≥ 4 years) |
| Logistics and cold-chain reliability | -0.9% | APAC corridors, emerging markets | Medium term (2-4 years) |
| Skilled R&D and operations talent gap | -0.8% | North America, EU, India | Long term (≥ 4 years) |
| Retail price compression and promotion noise | -1.0% | North America, EU, India, LATAM | Medium term (2-4 years) |
| Regulatory uncertainty and claim standardization | -0.7% | US, EU regulatory hubs, UK | Long term (≥ 4 years) |
Geopolitical Impact Analysis
Geopolitical Realignment and Supply Chain Fragmentation Reshaping Low Calorie Snack Manufacturing.
Geopolitical tensions, currency movements and changing trade routes are raising procurement risks for low-calorie snack producers that rely on imported fruit, nuts, cocoa, sweeteners and packaging materials. UK government data showed that food, feed and drink imports reached £67.8 billion in 2025, rising 4.8% from 2024. The related trade deficit widened 8.6% to £42.1 billion, showing how global disruptions can quickly increase ingredient and transportation costs. Manufacturers may respond through longer contracts, regional sourcing and larger safety stocks.
Supply diversification is becoming more important because the UK food production-to-supply ratio declined from 65% in 2024 to 60% in 2025. Domestic production covered only 14% of fresh-fruit supply in 2025, leaving fruit-based bars and dried-snack producers particularly exposed to border delays, tariffs and overseas harvest disruptions. This environment creates opportunities for locally sourced grains, seeds and vegetable-based snacks, while encouraging flexible recipes that can use alternative ingredients when international supplies tighten.
Regional Analysis
North America Held the Largest Share of the Global Low Calorie Snack Market.
In 2025, North America held the leading position with a 36.00% market share, supported by established packaged-food manufacturing, broad retail access and steady availability of nuts, grains and protein ingredients. In April 2026, the USDA reported that U.S. peanut production reached a record 6.5 billion pounds during 2024/25, strengthening domestic supplies for nut packs, trail mixes and reduced-sugar snack bars. The region also benefits from widespread nutrition labelling, portion-controlled formats and strong demand for convenient products that balance taste with calorie management.
Asia-Pacific is emerging as the growing region, supported by urban lifestyles, expanding modern retail and rising consumption of convenient snack foods. Australian Bureau of Statistics data published in March 2025 showed that per-capita snack-food availability increased 4.7% to 15.6 grams per day in 2023/24. This trend creates opportunities for baked snacks, lighter savoury products, nut mixes and locally flavoured low-calorie ranges.
Key Regions and Countries Covered
- North America
- The US
- Canada
- Europe
- Germany
- France
- The UK
- Spain
- Italy
- Russia & CIS
- Rest of Europe
- APAC
- China
- Japan
- South Korea
- India
- ASEAN
- Rest of APAC
- Latin America
- Brazil
- Mexico
- Rest of Latin America
- Middle East & Africa
- GCC
- South Africa
- Rest of MEA
Key Players Analysis
Low-calorie snack manufacturers focus on strengthening product differentiation, formulation efficiency and supply chain control to remain competitive. A key priority is continuous recipe innovation, including the development of reduced-sugar, high-protein, fibre-rich and portion-controlled products that improve satiety without compromising taste or texture.
Companies are also investing in baking, air-popping, dehydration and precision extrusion technologies, as these methods help lower fat content while maintaining crunch and shelf stability. Closer partnerships with grain, nut, dairy and natural sweetener suppliers support ingredient consistency and help manage cost fluctuations. Expanding production capacity near major retail and e-commerce markets allows brands to respond faster to changing consumer preferences and seasonal demand.
Manufacturers also place greater emphasis on clean labels, nutrition transparency, allergen control and recyclable packaging to build trust. At the same time, stronger quality systems, automated processing and long-term agreements with supermarkets, convenience stores and online platforms help improve distribution reach, secure shelf space and strengthen positioning across economy, mid-range and premium snack categories.
The Major Players In The Industry
- PepsiCo, Inc.
- Mondelēz International, Inc.
- Nestlé S.A.
- General Mills, Inc.
- Kellanova
- The Hershey Company
- Danone S.A.
- Conagra Brands, Inc.
- The Kraft Heinz Company
- The Hain Celestial Group, Inc.
- Simply Good Foods Company
- Calbee, Inc.
- Dole plc
- Tyson Foods, Inc.
- Ajinomoto Co., Inc.
Key Development
- In January 2025: PepsiCo, Inc. completed the USD 1.2 billion acquisition of Siete Foods, expanding its portfolio across grain-free tortilla chips, cookies, sauces and seasonings. The deal strengthens its position in health-oriented and culturally relevant snack categories.
- In May 2026: General Mills, Inc. launched LÄRABAR Protein in 3 flavours, delivering 10–12 grams of plant-based protein per bar and strengthening its convenient, nutrition-focused snack portfolio.
Report Scope
| Report Features | Description |
|---|---|
| Market Value (2025) | USD 27.6 Bn |
| Forecast Revenue (2035) | USD 46.3 Bn |
| CAGR (2026-2035) | 5.3% |
| Base Year for Estimation | 2025 |
| Historic Period | 2020-2024 |
| Forecast Period | 2026-2035 |
| Report Coverage | Revenue Forecast, Market Dynamics, Competitive Landscape, Recent Developments |
| Segments Covered | By Product Type (Savory Snacks, Protein Bars and Granola, Nuts And Seeds, Dairy Snacks, Confectionery and Others), By Nature (Conventional and Organic), By Packaging Type (Pouches, Bags, Boxes Cartons, Cans, Jars and Others), By Price Range (Economy, Mid-Range and Premium), By Distribution Channel (Online and Direct-To-Consumer (D2c) and Offline) |
| Regional Analysis | North America – The US & Canada; Europe – Germany, France, The UK, Spain, Italy, Russia & CIS, Rest of Europe; APAC– China, Japan, South Korea, India, ASEAN & Rest of APAC; Latin America– Brazil, Mexico & Rest of Latin America; Middle East & Africa– GCC, South Africa, & Rest of MEA |
| Competitive Landscape | PepsiCo, Inc., Mondelēz International, Inc., Nestlé S.A., General Mills, Inc., Kellanova, The Hershey Company, Danone S.A., Conagra Brands, Inc., The Kraft Heinz Company, The Hain Celestial Group, Inc., Simply Good Foods Company, Calbee, Inc., Dole plc, Tyson Foods, Inc., Ajinomoto Co., Inc. |
| Customization Scope | Customization for segments, region/country-level will be provided. Moreover, additional customization can be done based on the requirements. |
| Purchase Options | We have three licenses to opt for: Single User License, Multi-User License (Up to 5 Users), Corporate Use License (Unlimited Users and Printable PDF) |





































