


Report Overview
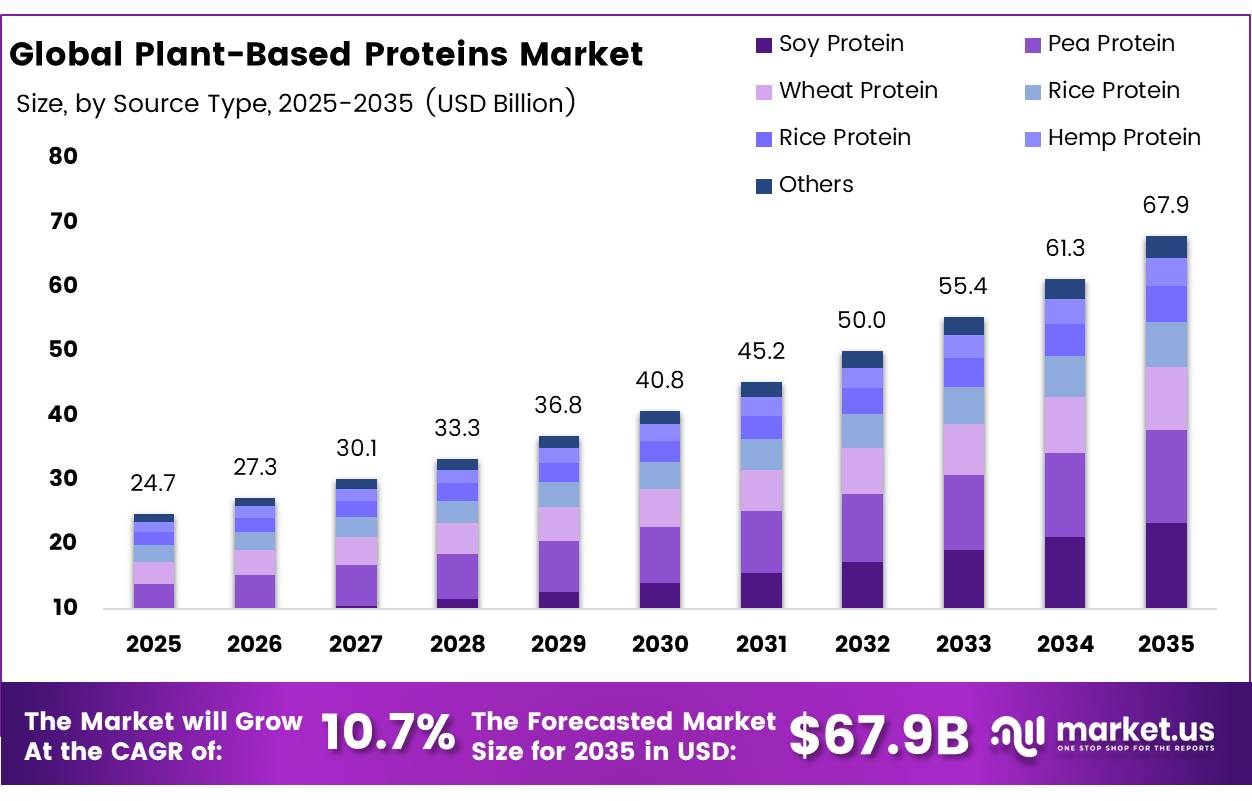
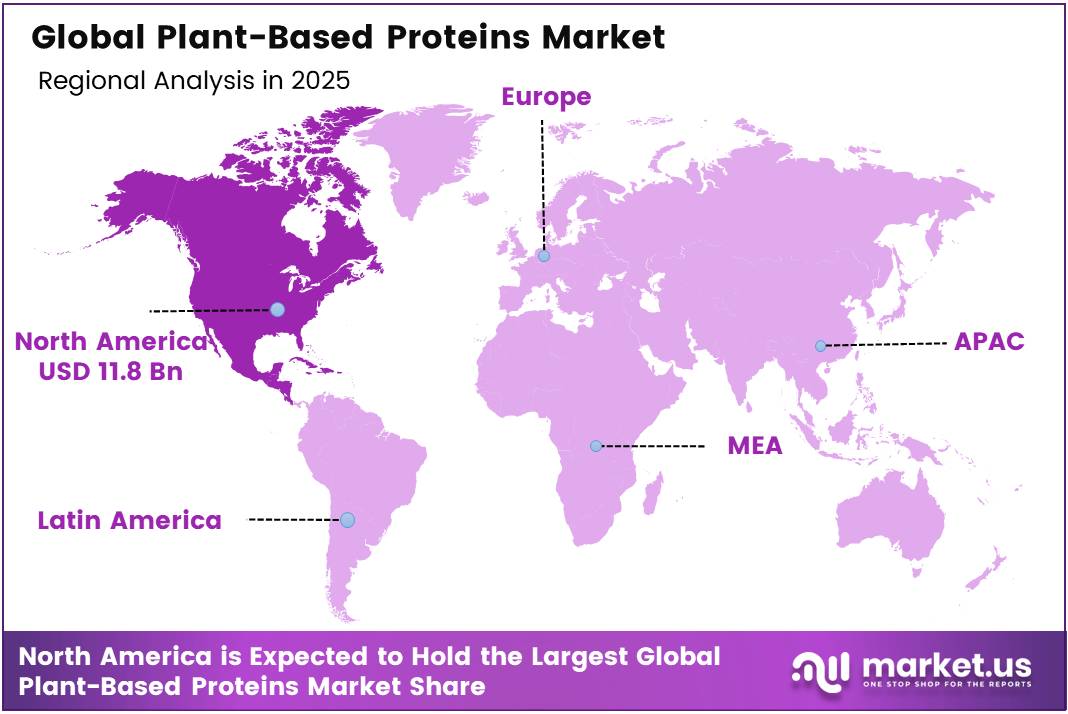
The Global Plant Based Protein Market is expected to be worth around USD 24.7 billion in 2025, growing at a CAGR of 10.7% to reach a value of USD 67.9 billion by 2035. North America held a dominant market position, capturing more than a 47.8% share, holding USD 11.8 billion in revenue.
Government support is also improving the long-term outlook. The European Commission’s Protein Action Plan aims to strengthen EU protein autonomy by scaling sustainable domestic protein production, diversifying imports, and reinforcing the supply chain. The EU reported that 94% of its soya protein crop imports came from soya bean and meal protein, with 13.4 million tonnes imported in 2024-25, while only around 33% of high-protein feed materials originated inside the EU.
- According to the OECD-FAO Agricultural Outlook 2025-2034, global pulses consumption reached 101 million tonnes in 2024, following average annual growth of 2% over the preceding decade, reflecting the expanding role of legumes as a mainstream protein source.
- In the U.S. retail channel, plant-based meat and seafood sales stood at about USD 1 billion in 2025, but dollar sales fell 10% and unit sales fell 11%, showing that the segment is shifting from fast expansion to product reformulation and value correction. Plant-based milk remained larger at USD 2.7 billion, with 38% household penetration and a 75% repeat rate, making it one of the more stable plant-based protein-adjacent categories.
Key Takeaways
- The Global Plant Based Protein Market size was US$ 24.7 billion in 2025.
- The Global Market is estimated to grow to US$ 67.9 billion by 2035.
- The Compound Annual Growth Rate (CAGR) of the market from 2026 to 2035 will be at 10.7%.
- Soy Protein has the largest market share in the source segment, accounting for 34.4% of the total.
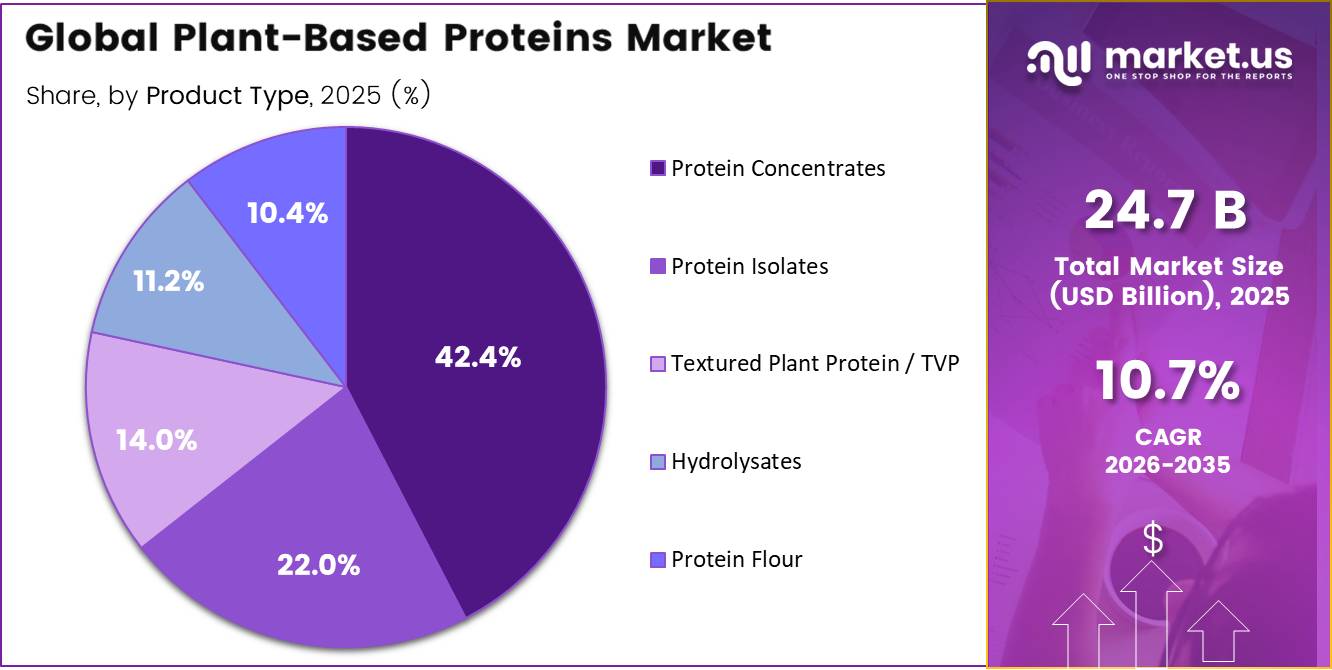
- Protein Concentrates dominated the product type segment, accounting for 42.4% of the total revenue.
- Food & Beverages has the highest revenue share 44.8% of total application income according to the application segment.
- Dry Powder dominates the form sector, accounting for 40.7% of the total.
- Food manufacturers account for 38.7% of total sales, making them the main procurement channel based on the end-user segment.
- North America is the largest regional market, accounting for 47.8% of global revenue.
Parallel to this consumption growth, public research bodies are reinforcing feedstock quality; the USDA’s Agricultural Research Service noted in 2023 that its newly released soybean germplasm improved meal protein content by two to three percent without compromising yield, strengthening the competitiveness of soy-based protein ingredients.
Sustainability considerations remain a core driver of industrial adoption, the Food and Agriculture Organization of the United Nations reports that plant-based proteins require 38 to 91% less land, 53 to 95% less water, and generate 69 to 92% lower carbon emissions than meat-based equivalents, prompting manufacturers to expand legume, pea, and soy-based portfolios. Government-backed research into extraction efficiency and nutritional quality continues to anchor the sector’s long-term expansion across food, beverage, and nutrition applications.
Source Analysis
Soy Protein Leads Market While Pea Protein Drives Fastest Growth Globally
The dominant product type in terms of revenues in Plant-Based Proteins is Soy Protein, which makes up for 34.4% of the total revenue share in the source segment because of its unmatched protein density, cost-effectiveness, and efficient global supply chain infrastructure, facilitating industrial scale production in meat analogues, milk alternatives, sports nutrition, and baking products. The regulatory approval in the United States, European Union, and China, along with its GRAS designation and years of clinical studies conducted, have cemented soy protein as the most favored ingredient choice, especially within institutional purchases.
- For instance, in 2024, leading global plant-protein ingredient manufacturers reported expanded processing capacity and improved supply-chain integration for soy-based proteins, enabling faster commercialization timelines and more reliable long-term supply for food and beverage manufacturers across Europe and North America.
Pea protein is the fastest-growing source segment owing to its non-genetically modified organism (non-GMO) appeal, allergen-friendly profile, and high digestibility compared to soy and wheat proteins. Its strong solubility in cold liquids, neutral taste, and compatibility with emulsification and texturization processes make it particularly suitable for ready-to-drink beverages, sports nutrition powders, and blended protein formulations. Additionally, growing cultivation of yellow peas in Europe and North America has improved supply stability and cost competitiveness, further accelerating adoption among food and nutrition manufacturers.
Product Type Analysis
Protein Concentrates Lead Market While TVP Drives Fastest Growth in Plant-Based Protein Segments
Protein concentrates continue to anchor the global plant-based protein industry, commanding a 42.4% market share on account of their established processing infrastructure and broad food-application base. Soybean meal, the principal feedstock for concentrate production, reflects this scale directly, according to the USDA Foreign Agricultural Service, global soybean meal production averaged 251.74 million metric tons over the ten-year period MY 2016-2025
Growing at a compound annual rate of 3%, and reached 281.74 million metric tons in the 2024/2025 marketing year, with 2025/2026 production projected at 291.31 million metric tons, a further 3% year-over-year increase.This consistent output growth gives concentrate manufacturers a dependable, cost-efficient raw material base, reinforcing the segment’s dominant position across bakery, beverage, and nutritional-supplement formulations.
Textured plant protein is emerging as the fastest-growing segment, propelled by rising demand for meat-like texture in flexitarian and vegetarian diets. Supporting this momentum, the USDA’s National Agricultural Statistics Service reported U.S. green pea production at 4,498.5 thousand hundredweight in 2024, strengthening the raw-material pipeline for pea-based textured proteins as manufacturers diversify beyond soy toward allergen-friendly alternatives.
Application Analysis
Food & Beverages Lead Market While Meat Alternatives Drive Fastest Application Growth Globally
Food & Beverages make up 44.8% of total application income because of the fast adoption of plant proteins in conventional packaged food categories like protein-infused snacks, baked items, prepared meals, dairy alternatives, and health beverages in global supermarkets, convenience stores, and online retail sales channels. Increased consumer acceptance of high-protein, natural packaged food products has changed the nature of plant proteins from being speciality additives to becoming a normative component of formulations used by international food producers.
Meat alternatives constitute the application segment experiencing the highest growth, driven by increasing consumer uptake of plant-based burgers, sausages, and nuggets as mainstream protein options. Rising health awareness, environmental concerns, and improvements in taste and texture have accelerated adoption among flexitarian and omnivorous consumers. Expanded availability across retail, quick-service restaurants, and foodservice channels has further supported growth.
Form Analysis
Dry Powder Dominates the Form Segment through Long Shelf Life, Logistical Efficiency, and Broad Formulation Compatibility
The dry powder format takes the lead in the form category with a market share of 40.7%, attributable to its increased longevity, cost-effective transportation and storage, as well as versatility in application, since it can be utilized in production methods such as manufacturing of shakes, baked products, meat substitutes, and supplements. Its high concentration allows for precision in dosing as well as ease of incorporation in production lines and commercial products, thus making the choice of format of preference for both ingredient suppliers and supplement brands.
Ready-to-drink (RTD) plant protein formats represent the fastest-growing segment, driven by rising consumer demand for convenient, on-the-go, high-protein nutritional beverages. Growth is supported by increasing health awareness among urban consumers, expansion of functional beverage offerings, and strong adoption across retail and online channels. RTD formats benefit from ease of consumption, portion control, and alignment with active lifestyles, accelerating uptake among health-conscious and time-constrained consumers.
End-User Analysis
Food Manufacturers Lead Market Revenue through Large-Scale Procurement and Long-Term Supply Agreements
Food Manufacturers account for 38.7% of the entire plant protein ingredient sales, sourcing ingredients on a bulk basis for inclusion in processed products offered in meat, dairy, snack, and fortified beverages categories. The purchasing activities of the food manufacturers are regulated by the standardization of specifications, long-term contract stability, and price efficiencies based on costs per gram, which inherently favors the supplier companies with vertical processing capability and diversified sourcing options.
In addition, food manufacturers benefit from the economies of scale associated with volume-based pricing policies as part of long-term supply agreements, resulting in inherent cost efficiencies compared to other buyers including retailers and foodservice buyers vying for the ingredients.
Sports Nutrition Brands is the most rapidly expanding end-user category owing to the increasing membership of gyms worldwide, growth in number of athletes, and growing consumer interest in protein-rich diet outside the domain of bodybuilders. The other end user categories are Retail Consumers, Foodservice & QSR, and Nutraceutical Companies.
Key Market Segments
By Source
- Soy Protein
- Pea Protein
- Wheat Protein
- Rice Protein
- Oat Protein
- Hemp Protein
- Others
By Product Type
- Protein Concentrates
- Protein Isolates
- Textured Plant Protein / TVP
- Hydrolysates
- Protein Flour
By Application
- Food & Beverages
- Meat Alternatives
- Sports Nutrition
- Dietary Supplements
- Infant Nutrition
- Clinical Nutrition
- Animal Feed
By Form
- Dry Powder
- Liquid
- Granules
- Chunks
- Ready-to-Drink / RTD
By End-User
- Food Manufacturers
- Retail Consumers
- Foodservice & QSR
- Sports Nutrition Brands
- Nutraceutical Companies
Driver Analysis
Protein format expansion in powders, tofu, and functional everyday foods
The strongest near-term growth driver is not broad-based meat analog expansion, but the migration of plant protein into formats with better repeat economics, cleaner labels, and lower sensory risk. In U.S. retail, plant-based protein powders and liquids grew 11% in dollars and 13% in units in 2024 to about $450 million, while tofu and tempeh rose 7% in dollars and 6% in units to roughly $221 million, indicating that consumers are rewarding high-protein, minimally processed, and routine-use formats rather than only novelty-centered substitutes.
That matters structurally because powders, beverage bases, tofu, tempeh, and protein fortification systems typically carry simpler formulations, fewer expensive flavor-masking inputs, and lower frozen-chain complexity than next-generation meat analogs, which improves gross margin resilience and reduces reformulation risk when pea, soy, or specialty texturates move in price.
Drivers Impact Analysis
| Driver | (~) % Impact on CAGR | Geographic Relevance | Impact Timeline |
|---|---|---|---|
| Protein format expansion in powders, tofu, and functional everyday foods | +2.1% | North America core, Western Europe core, urban APAC | Short term (≤ 2 years) |
| Retail normalization and repeat purchase recovery | +1.7% | U.S., Canada, UK, Germany, Nordics, Australia | Short term (≤ 2 years) |
| Regulatory clarity and market-access improvement | +1.3% | U.S., EU, Singapore, advanced APAC | Medium term (2-4 years) |
| Soy and pulse processing scale lowers input-cost barriers | +1.9% | North America, Brazil-linked export chains, EU ingredient import markets, China | Medium term (2-4 years) |
| Sustainability compliance reshapes sourcing and premium capture | +1.1% | EU core, UK adjacency, multinational supply chains in Latin America and Asia | Medium term (2-4 years) |
| Export corridor build-out and localized manufacturing | +1.5% | India, GCC, Southeast Asia, Europe import hubs | Long term (≥ 4 years) |
Restraint Analysis
Ultra-processed food and clean-label backlash
Retail trend commentary for 2026 notes that the global plant-based market is expected to reach around $21 billion, driven by interest in clean labels and whole-food proteins rather than heavily engineered analogs, indicating that growth is shifting toward products that require fewer functional ingredients and less processing complexity.
Strategically, brands with portfolios dominated by high-complexity items face higher reformulation costs, potential de‑listing risk if retailers tighten UPF policies, and more challenging marketing narratives, all of which can slow innovation pipelines and widen the gap between consumer expectations and available offerings; the resulting friction can easily shave 1–2 percentage points off category CAGR as companies redirect R&D to simpler formats, delay launches, or struggle to convince skeptical consumers to pay premium prices for products perceived as “processed”.
Restraint Impact Analysis
| Restraint | (~) % Impact on CAGR | Geographic Relevance | Impact Timeline |
|---|---|---|---|
| High processing and cold-chain cost stack | -2.2% | North America core, EU, developed APAC | Short term (≤ 2 years) |
| Ultra-processed food and clean-label backlash | -1.8% | EU, UK, North America urban, ANZ | Medium term (2-4 years) |
| Crop and protein input price volatility | -1.9% | North America, EU importers, Asia feed/protein hubs | Medium term (2-4 years) |
| Regulatory uncertainty and labeling friction | -1.4% | EU, UK, selective U.S. states, Middle East import markets | Medium term (2-4 years) |
| Capital-intensive texturization and scale-up risk | -1.6% | Global processing hubs, APAC corridors | Long term (≥ 4 years) |
| Consumer taste and value-perception plateau | -1.5% | North America core, EU core, high-income APAC | Long term (≥ 4 years) |
Opportunity Analysis
Precision-formulated proteins for clinical and metabolic health
Global diabetes and obesity burdens are forecast to keep rising, and even modest penetration into clinical nutrition budgets—for example, securing 5–10% share of protein prescriptions and hospital procurement in North America and Europe—could unlock several billion dollars of incremental TAM, with unit economics supported by higher willingness-to-pay, reimbursement-linked demand, and 5–10 percentage point margin uplift versus commodity proteins due to IP‑backed formulations and trial-based evidence.
Strategically, this opportunity is distinct from current drivers because it requires new go‑to‑market mechanics and shifts the business model from retail-heavy branding to hybrid B2B/B2C models integrating hospitals, insurers, and specialized e‑pharmacies; executed well, it could add a low‑single‑digit percentage points to category CAGR as plant-based proteins capture portions of the $20–30 billion global clinical nutrition and disease-specific dietary market over the next decade.
Opportunity Impact Analysis
| Opportunity | (~) % Potential CAGR | Geographic Relevance | Execution Window |
|---|---|---|---|
| Precision-formulated proteins for clinical and metabolic health | +2.3% | North America core, EU, high-income APAC | Medium term (2-4 years) |
| AgTech-enabled regional protein clusters and B2B ingredient platforms | +2.0% | EU, India, Southeast Asia, Latin America | Long term (≥ 4 years) |
| White-label and private-label mainstream protein portfolios | +1.8% | North America core, EU core, GCC, Brazil | Medium term (2-4 years) |
| Cross-category protein integration into culturally relevant staples | +1.9% | India, ASEAN, MENA, Latin America | Long term (≥ 4 years) |
| AI-led formulation and sensory optimization services | +1.7% | Global R&D hubs, EU, U.S., Singapore | Medium term (2-4 years) |
| M&A roll-ups across fragmented mid-tier brands and co-manufacturers | +2.1% | Global, esp. North America and Europe | Long term (≥ 4 years) |
Challenges Analysis
Cold-chain reliability and spoilage risk
In practice, chilled and frozen plant-based products may experience average total dwell times of 20–30 days across production, central warehousing, and retail backrooms in developed markets, with even small deviations—such as a 24–48 hour temperature excursion above target thresholds—raising spoilage risk and forcing discounting or write‑offs that can erode margins by low‑single‑digit percentages on affected batches.
To navigate this, companies must invest in monitoring technologies, stricter SLAs, packaging that tolerates modest temperature variation, and portfolio mixes that include more shelf-stable formats, but those investments take several years and continuous refinement; the friction drag on CAGR is therefore moderate, at roughly 1–1.3 percentage points, stemming from higher operational risk premiums and slower rollout of chilled formats across infrastructure-constrained markets rather than direct bans or hard stops.
Challenges Impact Analysis
| Challenge | (~) % CAGR Friction | Geographic Relevance | Mitigation Horizon |
|---|---|---|---|
| Complex multi-tier supply chains | -1.4% | North America core, EU import hubs, APAC corridors | Medium term (2-4 years) |
| Cold-chain reliability and spoilage risk | -1.3% | EU, North America, developed APAC, GCC | Medium term (2-4 years) |
| Talent and know-how concentration in alt-protein hubs | -1.1% | Singapore, EU innovation hubs, U.S. coasts | Long term (≥ 4 years) |
| Ingredient functionality and yield variability | -1.2% | Global manufacturing hubs, EU, Asia processing | Medium term (2-4 years) |
| Consumer expectation–performance gap | -1.0% | North America core, EU, urban APAC | Long term (≥ 4 years) |
| Capital allocation under evolving tech landscape | -1.3% | Global, esp. North America and Europe | Long term (≥ 4 years) |
Geopolitical Impact Analysis
Geopolitical Trade Policies, Agricultural Subsidies, and Food Security Agreements Reshaping Plant-Based Protein Supply Chains
Geopolitical forces are exerting multi-directional pressure on the global plant-based protein market through supply-chain concentration risks, tariff-related cost inflation, and regulatory divergence across major trading blocs. North America remains a key exporter of soy and pea proteins, creating exposure to trade policy shifts and geopolitical tensions between large importing and exporting regions.
According to the European Commission, the EU produced approximately 64 million tons of crude plant protein during 2023–24, while importing an additional 19 million tons, highlighting continued dependence on external suppliers and exposure to geopolitical and trade-related disruptions in import channels. This imbalance has increased focus on regional protein self-sufficiency, encouraging investment in domestic protein crop cultivation and processing capacity across Europe.
Regional Analysis
North America Leads Global Plant-Based Protein Market
North America accounted for 47.8% of global plant-based protein market revenue in 2025, maintaining its position as the leading regional market. The region’s dominance is primarily driven by the strong presence of the United States, supported by an advanced food processing ecosystem, well-developed retail and sports nutrition distribution channels, and a high concentration of plant-based food startups and innovation hubs.
Asia-Pacific region represents the fastest-growing market for plant-based proteins, driven by rising disposable incomes among middle-class consumers, rapid urbanization, and increasing awareness of health and nutrition. The region benefits from a long-standing cultural familiarity with plant-based diets, particularly in countries such as China, India, and parts of Southeast Asia, where soy- and legume-based foods are already well established.
Key Regions and Countries Covered
- North America
- The US
- Canada
- Europe
- Germany
- France
- The UK
- Spain
- Italy
- Russia & CIS
- Rest of Europe
- APAC
- China
- Japan
- South Korea
- India
- ASEAN
- Rest of APAC
- Latin America
- Brazil
- Mexico
- Rest of Latin America
- Middle East & Africa
- GCC
- South Africa
- Rest of MEA
Key Players Analysis
Plant protein suppliers are increasingly pursuing a strategy centered on vertical integration, product differentiation, and capacity expansion to strengthen competitive positioning. Key strategic priorities include securing raw material sourcing through direct agricultural partnerships, investing in advanced extraction and fractionation technologies, and expanding portfolios of high-purity isolates, textured proteins with improved sensory performance, and precision-fermented ingredients for sports nutrition and functional food applications.
To mitigate raw material price volatility for soy, pea, and wheat, leading suppliers are strengthening end-to-end control from sourcing to ready-to-use ingredient delivery. Capacity expansions in North America and Europe are being deployed to support long-term supply agreements with large food manufacturers, sports nutrition brands, and online retailers, ensuring stable revenues and customer retention through the forecast period.
The Major Players In The Market
- ADM
- Cargill
- Ingredion Incorporated
- Roquette Frères
- Kerry Group
- DSM-Firmenich
- Wilmar International
- AGT Food and Ingredients
- Glanbia
- International Flavors & Fragrances
- Beyond Meat
- Impossible Foods
- Nestlé
- Danone
- Tyson Foods
- Other Key Players
Key Development
- In 2025, Roquette Frères recorded EUR 4.9 billion in turnover, up 8%, and Current EBITDA of EUR 612 million, up 13%. Its EBITDA margin improved by 54 basis points to 12.6%. Roquette stated that demand in food and nutrition was supported by fiber and protein products, strengthening its plant-based positioning.
- In 2025, ADM reported total segment operating profit of USD 3.24 billion, while its Nutrition segment reached USD 417 million, up 8% from 2024. Its Human Nutrition business contributed USD 319 million, supporting demand for protein ingredients, flavors, and texture systems used in meat alternatives, beverages, snacks, and fortified foods.
- In 2025, Kerry reported revenue of EUR 6.76 billion, EBITDA of EUR 1.21 billion, and an EBITDA margin of 17.9%, up 80 basis points. Volume growth reached 3.0% for the year. These numbers show Kerry’s strength in helping food brands improve taste, mouthfeel, nutrition, and acceptance of plant-based protein products.
- In FY2025, Wilmar International Food Products segment generated USD 30.89 billion in revenue, up 7%, with sales volume of 34.7 million MT, up 5%. Its Feed and Industrial Products segment reported USD 42.87 billion revenue, while Oilseeds and Grains revenue reached USD 10.53 billion, supporting soy protein-linked supply chains.
Report Scope
| Report Features | Description |
|---|---|
| Market Value (2025) | USD 24.7 Billion |
| Forecast Revenue (2035) | USD 67.9 Billion |
| CAGR (2026-2035) | 10.7% |
| Base Year for Estimation | 2025 |
| Historic Period | 2020–2024 |
| Forecast Period | 2026–2035 |
| Report Coverage | Revenue Forecast, Market Dynamics, Competitive Landscape, Recent Developments |
| Segments Covered | By Source (Soy Protein, Pea Protein, Wheat Protein, Rice Protein, Oat Protein, Hemp Protein, Others), By Product Type (Protein Concentrates, Protein Isolates, Textured Plant Protein / TVP, Hydrolysates, Protein Flour), By Application (Food & Beverages, Meat Alternatives, Sports Nutrition, Dietary Supplements, Infant Nutrition, Clinical Nutrition, Animal Feed), By Form (Dry Powder, Liquid, Granules, Chunks, Ready-to-Drink / RTD), By End User (Food Manufacturers, Retail Consumers, Foodservice & QSR, Sports Nutrition Brands, Nutraceutical Companies) |
| Regional Analysis | North America – The US & Canada; Europe – Germany, France, The UK, Spain, Italy, Russia & CIS, Rest of Europe; APAC – China, Japan, South Korea, India, ASEAN & Rest of APAC; Latin America – Brazil, Mexico & Rest of Latin America; Middle East & Africa – GCC, South Africa & Rest of MEA |
| Competitive Landscape | ADM, Cargill, Ingredion Incorporated, Roquette Frères, Kerry Group, DSM-Firmenich, Wilmar International, AGT Food and Ingredients, Glanbia, International Flavors & Fragrances, Beyond Meat, Impossible Foods, Nestlé, Danone, Tyson Foods |
| Customization Scope | Segment, country, and regional customization, along with company profiling, pricing trends, CAGR updates, competitive benchmarking, and additional application or technology segmentation, can be provided as per client requirements. |
| Purchase Options | We have three licenses to opt for Single User License, Multi-User License (Up to 5 Users), Corporate User License (Unlimited User and Printable PDF) |





































