


Report Overview
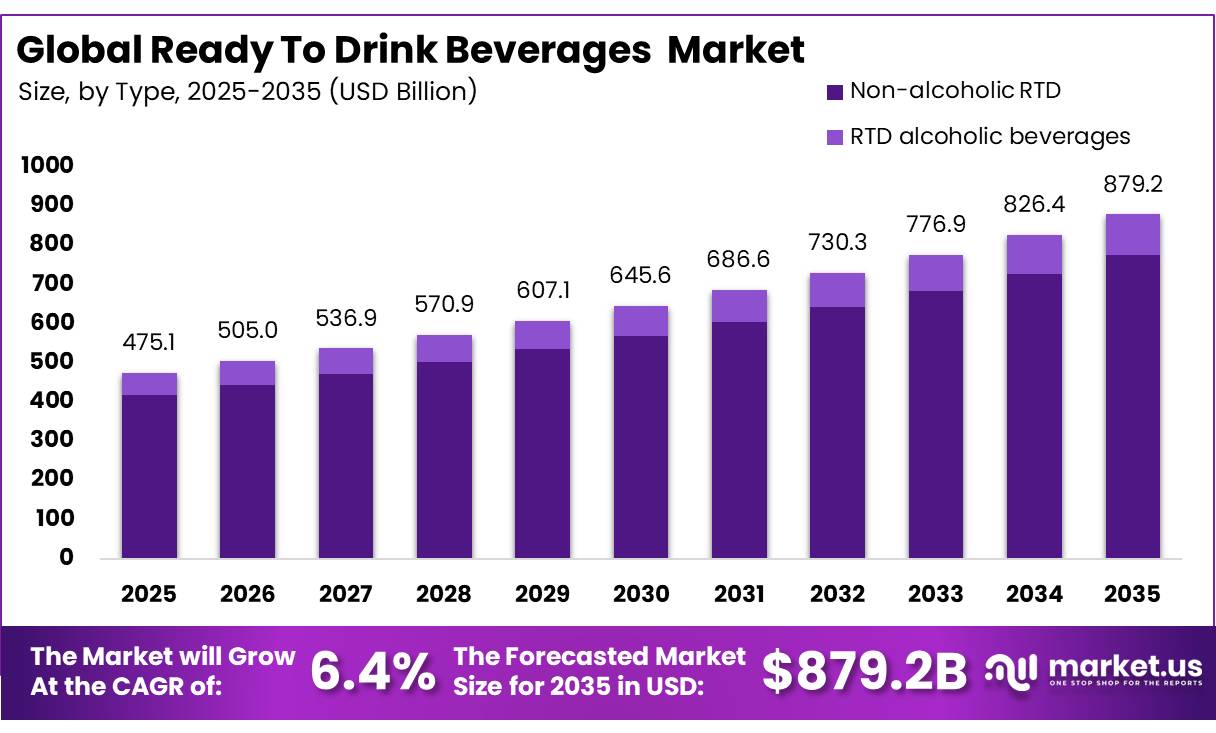
In 2025, the Global Ready To Drink Beverages Market was valued at USD 475.1 billion, and between 2026 and 2035, this market is estimated to register a CAGR of 6.4%, reaching about USD 879.2 billion by 2035. Asia Pacific held a dominant market position, capturing more than a 35.4% share, holding USD 168.17 billion in revenue.
The Ready To Drink beverages market covers packaged drinks sold for immediate consumption, including carbonated soft drinks, juices, teas, coffees, energy drinks, functional waters, dairy beverages, and alcoholic mixes. Demand is supported by urban lifestyles, portable packaging, wider cold-chain availability, and consumer preference for convenience.
- In 2023, United States consumers spent USD 2.92 trillion on food and beverages, while 85% of purchases were supplied through the domestic value chain, indicating a commercial base for packaged beverage producers.
Key Takeaways
- The global Ready to Drink Beverages Market was valued at USD 475.1 billion in 2025.
- The global Market is projected to grow at a CAGR of 6.4% and is estimated to reach USD 879.2 billion by 2035.
- On the basis of product, carbonated soft drinks (CSDs) dominated the Ready To Drink Beverages Market, constituting 39.8% of the total market share.
- Based on type, non-alcoholic RTD beverages dominated the Ready To Drink Beverages Market, accounting for 88.1% of the total market share.
- Based on packaging, PET and other bottles led the Ready To Drink Beverages Market, comprising 48.2% of the total market.
- Among the distribution channels, supermarkets and hypermarkets held a major share in the Ready to Drink Beverages Market, accounting for 42.1% of the market share.
- Asia Pacific was the most dominant region in the Ready To Drink Beverages Market, accounting for 35.4% of the total market share.
Industry conditions remain competitive as manufacturers balance affordability, product reformulation, packaging costs, and retail expansion. The United States Department of Agriculture reported that nonalcoholic beverage prices increased 3.8% in 2025, compared with 2.3% growth across food-at-home prices. This cost environment encourages lightweight packaging, supply-chain efficiency, local sourcing, and portfolio pricing. Producers are also expanding low-sugar, zero-sugar, plant-based, caffeinated, and fortified formats to serve multiple consumption occasions without relying on a single product category.
- The United States Food and Drug Administration states that the Daily Value for added sugars is 50 grams under a 2,000-calorie diet, while dietary guidance recommends keeping added sugars below 10% of daily calories. Meanwhile, the World Health Organization reports that 116 countries apply national excise taxes to at least one sugar-sweetened beverage category, with excise representing 9.7% of the weighted average price of a comparable carbonated drink.
Growth opportunities are strongest in functional hydration, reduced-sugar beverages, premium ready-to-drink coffee and tea, dairy alternatives, and recyclable packaging. Government policy is accelerating investment in circular packaging. The European Union set a 77% separate-collection target for plastic bottles in 2025, rising to 90% by 2029. Polyethylene terephthalate beverage bottles must contain 25% recycled plastic from 2025, while all plastic beverage bottles face a 30% requirement from 2030, supporting recycled-resin procurement and packaging redesign.
Product Type Analysis
Carbonated Soft Drinks Lead Through Familiar Flavours and Wide Retail Reach
In 2025, Carbonated soft drinks (CSDs) held a dominant market position, capturing more than a 39.8% share. Their leadership was supported by strong brand recognition, affordable single-serve formats, broad retail availability, and habitual consumption with meals and social occasions. In October 2025, Coca-Cola reported that sparkling soft drinks remained steady during the third quarter, while Trademark Coca-Cola recorded growth across several geographic operating segments, showing continued resilience in the category.
- For instance, in February 2025, according to Keurig Dr Pepper, the company unveiled a new United States cold-beverage flavour lineup across Dr Pepper, 7UP, A&W, and Snapple, strengthening innovation within established ready-to-drink portfolios.
Energy drinks are the fastest-growing segment, supported by rising demand for convenient stimulation, active-lifestyle positioning, zero-sugar options, and functional ingredients. Younger consumers increasingly use these beverages for work, travel, gaming, fitness, and study occasions. In May 2025, Celsius Holdings expanded distribution into the Netherlands through Suntory Beverage & Food Benelux, introducing fruit-forward zero-sugar flavours and widening access through mainstream retail channels. Continued international expansion, new flavour launches, and clearer functional positioning are expected to support faster adoption.
Type Analysis
Non-Alcoholic RTD Beverages Dominate Through Convenience and Broad Consumer Appeal
In 2025, Non-alcoholic RTD held a dominant market position, capturing more than a 88.1% share. The segment benefited from frequent consumption across meals, travel, work, fitness, and social occasions. Its broad product range, including soft drinks, juices, tea, coffee, functional water, and dairy alternatives, helped it serve different age groups and price points. In July 2025, PepsiCo introduced Pepsi Prebiotic Cola, showing how producers were adding functional ingredients to mainstream non-alcoholic formats.
- For instance, in October 2025, according to Pernod Ricard, Jameson Ginger & Lime ready-to-drink cans returned to the United Kingdom market in a larger format, supported by retail and matchday sampling activity.
RTD alcoholic beverages are the fastest-growing segment, supported by demand for convenient cocktails, portion-controlled servings, flavour variety, and easy at-home consumption. Younger legal-age consumers are increasingly choosing canned mixed drinks for gatherings, festivals, and casual occasions. In August 2025, Diageo reported a more targeted RTD strategy across selected markets and prepared a wider rollout of Casamigos Margarita RTD, reflecting continued investment in premium, portable alcoholic formats.
By Packaging Analysis
PET and Other Bottles Lead Through Portability and Broad Shelf Use
In 2025, PET & other bottles held a dominant market position, capturing more than a 48.2% share. Their lightweight structure, resealable design, impact resistance, and suitability for different drink sizes supported strong use across soft drinks, water, juices, teas, coffees, and functional beverages. Bottles also remain practical for transport, refrigeration, vending machines, and single-person consumption, helping brands maintain wide retail reach.
- For instance, in August 2025, according to Plastipak, the company prepared to showcase bottle-grade recycled polyethylene terephthalate, bio-based resins, reusable packaging solutions, and advanced barrier technologies at Drinktec, strengthening sustainable beverage-packaging development.
Cans are the fastest-growing segment because they chill quickly, protect drinks from light and oxygen, provide portion sizes, and support graphics. Their compact shape improves storage and shipment efficiency, while aluminum recycling supports circular-packaging goals. In February 2025, according to Ball Corporation, the company completed its acquisition of Florida Can Manufacturing, adding an aluminum beverage-can facility in Winter Haven and strengthening its supply network. Growth is supported by demand for energy drinks, sparkling beverages, canned coffee, functional drinks, and ready-to-drink alcoholic products across diverse retail and hospitality channels.
Distribution Channel Analysis
Supermarkets and Hypermarkets Lead Through Selection, Value, and Convenience
In 2025, Supermarkets & hypermarkets held a dominant market position, capturing more than a 42.1% share. Their leadership came from extensive beverage assortments, visible chilled displays, promotional pricing, multipack availability, and the convenience of purchasing drinks with weekly groceries. Large stores also support rapid product comparison across soft drinks, juices, teas, coffees, energy drinks, functional waters, and alcoholic formats. In April 2026, Walmart announced continued investment in store remodeling and new locations, strengthening physical retail capacity and improving shopping convenience.
- For instance, in June 2025, according to Walmart, the retailer expanded drone delivery into additional United States cities, supporting faster access to groceries, beverages, and everyday products through technology-enabled local fulfillment.
Online / e-commerce is the fastest-growing segment, supported by mobile ordering, home delivery, subscription purchasing, digital promotions, and easier repeat buying. The channel suits bulky beverage packs and consumers seeking convenience without store visits. In August 2025, Amazon expanded same-day delivery of perishable groceries across more United States locations, demonstrating how faster fulfillment and broader online selection are encouraging beverage purchases through digital platforms and supporting wider household adoption.
Key Market Segments
By Product
- Carbonated soft drinks (CSDs)
- Energy drinks
- Juice & nectar RTD
- RTD tea
- RTD coffee
- Sports & functional drinks/water
- Dairy & dairy‑alternative RTD
- Other RTD beverages (niche/botanical)
By Type
- Non‑alcoholic RTD
- RTD alcoholic beverages
By Packaging
- PET & other bottles
- Cans
- Cartons
- Pouches & others
By Distribution Channel
- Supermarkets & hypermarkets
- Convenience & grocery stores
- Specialty & liquor stores
- On‑trade / on‑premise
- Online / e‑commerce
Driver Analysis
Functional wellness RTD premiumization
Functional positioning is the clearest 2026 growth accelerator because it raises average selling price as well as shopping frequency, especially in energy, hydration, gut-health, and fortified subsegments. Euromonitor noted that wellness trends lifted functional categories in 2024, with energy drinks and powder concentrates posting 8% value growth, and Glanbia sized the US functional beverage market at about $50 billion with a path to $62 billion by 2027, implying a 4.5% CAGR; that combination supports a reasonable view that functionality alone can add roughly 1.6 percentage points to RTD category CAGR where brands can command a 15% to 40% premium to mainstream refreshment beverages and protect gross margin despite higher ingredient loads.
The strategic importance is that the profit pool shifts from scale carbonates and legacy juice toward need-state beverages sold on specific benefits, which changes commercialization from broad-reach advertising to claims-led velocity building, influencer conversion, and targeted retail placement in convenience, club, and fitness-adjacent channels. In practice, suppliers able to formulate around caffeine, electrolytes, probiotics, protein, botanicals, and low-sugar systems gain a larger share of premium shelf space, while laggards remain trapped in lower-price, promotion-heavy segments with weaker mix.
Drivers Impact Analysis
| Driver | (~) % Impact on CAGR Forecast | Geographic Relevance | Impact Timeline |
|---|---|---|---|
| Functional wellness RTD premiumization | +1.6% | North America core, EU urban, APAC metros | Medium term (2-4 years) |
| Zero-sugar reformulation and label compliance | +1.2% | North America core, GCC, EU | Short term (≤ 2 years) |
| Energy, hydration, and protein occasion expansion | +1.4% | North America core, APAC corridors, LATAM spill-over | Short term (≤ 2 years) |
| Convenience-led cold chain and on-the-go channel recovery | +0.9% | North America, EU, APAC urban corridors | Medium term (2-4 years) |
| Packaging sustainability and material conversion | +0.7% | EU core, North America, developed APAC | Medium term (2-4 years) |
| Portfolio consolidation through major-brand acquisitions | +0.8% | North America core, selective EU and APAC rollout | Short term (≤ 2 years) |
Restraint Analysis
Sugar, nutrition and labeling regulation burden
Regulation around sugar, nutrition, and front‑of‑pack labeling is a structural restraint because it raises reformulation costs, constrains marketing claims, and can directly reduce RTD volumes in high‑sugar segments through taxes and warning labels, with at least 39 jurisdictions having introduced nutritional taxation or sugar‑reduction policies by mid‑2018 and more evolving frameworks since then.
Evidence from sugar‑sweetened‑beverage policies shows that sugar reductions in new soft drinks have been larger in countries with explicit policies, but that outcome requires significant R&D, sensory optimization, and ingredient substitution budgets, often adding several cents per litre to formulation cost and lengthening development cycles by 6–12 months compared with conventional carbonates.
At the same time, extended nutrition claims and “healthy” definitions in markets such as the US and EU enforce composition thresholds that can exclude a portion of RTD portfolios from high‑visibility healthy sets, while sugar taxes in GCC and Latin America add effective 10%–50% price premia to high‑sugar RTDs, pressuring volumes, particularly in price‑sensitive channels. Taken together, these factors justify a 1.3 percentage‑point reduction to baseline CAGR, as producers allocate capital to compliance rather than expansion, downgrade some SKUs, and accept slower rollouts in markets with aggressive sugar‑control regimes.
Restraint Impact Analysis
| Restraint | (~) % Impact on CAGR Forecast | Geographic Relevance | Impact Timeline |
|---|---|---|---|
| Persistent input-cost inflation | -1.7% | North America core, EU, APAC corridors | Medium term (2-4 years) |
| Sugar, nutrition and labeling regulation burden | -1.3% | EU, North America, GCC | Medium term (2-4 years) |
| Cold-chain and energy cost pressure | -1.1% | North America, EU, APAC metros | Long term (≥ 4 years) |
| Packaging sustainability and compliance costs | -1.0% | EU core, UK, developed APAC | Medium term (2-4 years) |
| Labor shortages and logistics bottlenecks | -0.9% | North America core, EU, selected APAC | Short term (≤ 2 years) |
| Category fragmentation and shelf competition | -0.8% | North America, EU, APAC corridors | Long term (≥ 4 years) |
Opportunity Analysis
Hyper‑localized RTD for emerging India & APAC
This opportunity goes beyond the current RTD growth driver in India and APAC by explicitly targeting under‑penetrated cities, vernacular flavor profiles, and differentiated pack‑price architectures rather than simply scaling today’s national SKUs. India’s RTD segment has been highlighted as a lifestyle megatrend with around 18% CAGR as consumers move toward health and convenience, but penetration remains highly skewed to metros and upper‑income cohorts; realistic modeling suggests that tier‑2/3 cities and lower‑middle‑income households could double the accessible RTD TAM in India alone over the next decade, adding an incremental $5–10 billion by 2035 if localized flavors, lower‑price small packs, and modular cold‑chain solutions are deployed.
Similarly, emerging Southeast Asian markets with high urbanization but lower per‑capita beverage spend are under‑served by premium RTDs, potentially offering 10%–15% annual volume growth at mid‑single‑digit margins if operators design lower‑cost formulations aligned to local taste and climate, rather than simply exporting global brands. Because these pockets are not embedded in current global RTD forecasts that focus on established regions, a dedicated “hyper‑local” strategy—city‑cluster specific SKUs, regional co‑packing, and route‑to‑market partnerships with local distributors—could realistically add about 1.8 percentage points of CAGR upside above baseline between 2026 and 2035.
Opportunity Impact Analysis
| Opportunity | (~) % Potential CAGR Upside | Geographic Relevance | Execution Window |
|---|---|---|---|
| Hyper-localized RTD for emerging India & APAC | +1.8% | India tier-2/3, SE Asia, APAC emerging | Medium term (2-4 years) |
| Direct-to-consumer RTD subscriptions & personalization | +1.5% | North America core, EU urban, developed APAC | Medium term (2-4 years) |
| Alcohol-free RTD mixology & adult occasions | +1.4% | EU, North America, APAC metros | Short term (≤ 2 years) |
| Verticalized functional RTD for workplace & institutional channels | +1.3% | North America, EU, GCC, developed APAC | Medium term (2-4 years) |
| Data-monetization and retail media around RTD consumption | +1.1% | North America core, EU, large APAC retailers | Long term (≥ 4 years) |
| Low-carbon, closed-loop RTD packaging platforms | +1.0% | EU core, UK, North America, Japan | Long term (≥ 4 years) |
Challenges Analysis
Volatile multi‑input cost stack
Volatile multi‑input cost stack is a challenge rather than a current restraint because RTD production continues, but persistent variability across sweeteners, flavours, packaging, energy, and logistics keeps unit economics unstable and forces continuous tactical hedging instead of strategic margin expansion. Food and beverage supply‑chain analyses for 2026 highlight ongoing cost pressure and variability across raw materials and logistics, with integrated planning and working‑capital optimization becoming key themes; for an RTD producer with a cost‑of‑goods split where 30%–40% sits in packaging, 20%–30% in ingredients, and the remainder in energy, labour, and distribution, even a 5%–10% standard deviation in input prices per year translates into several percentage points of volatility in gross margin.
Aluminum‑can supply and recycled‑content requirements, PET resin cycles, and sugar and sweetener volatility add layers of risk, forcing companies to maintain higher safety stocks, accept occasional spot‑purchase premiums, or lock into hedges that may overshoot market prices; this does not stop RTD growth but imposes a friction drag of around 1.5 percentage points on potential CAGR as management teams trade off price increases, pack resizing, and promotional spend month by month rather than executing stable multi‑year investment, making long‑term forecasting less precise and raising the hurdle rate for new capacity.
Challenges Impact Analysis
| Challenge | (~) % CAGR Friction Drag | Geographic Relevance | Mitigation Horizon |
|---|---|---|---|
| Volatile multi-input cost stack | -1.5% | North America core, EU, APAC corridors | Medium term (2-4 years) |
| Demand forecasting and SKU complexity | -1.3% | North America, EU, India, SE Asia | Medium term (2-4 years) |
| Cold-chain and last-mile inefficiencies | -1.2% | EU hubs, APAC logistics corridors, urban North America | Long term (≥ 4 years) |
| Health perception and reformulation risk | -1.1% | EU regulatory hubs, North America, GCC | Long term (≥ 4 years) |
| Digital talent and data-stack gaps | -0.9% | North America core, EU, developed APAC | Medium term (2-4 years) |
| Route-to-market and channel conflict | -0.8% | North America core, EU retail, India modern trade | Long term (≥ 4 years) |
Geopolitical Impact Analysis
Geopolitical Realignment and Trade Barriers Reshaping Ready To Drink Beverage Supply Chains
Current geopolitical tensions are reshaping the Ready To Drink beverages market through shipping disruptions, packaging tariffs, traceability rules, and sourcing strategies. The United Nations Conference on Trade and Development expected seaborne trade volumes to rise by 0.5% in 2025, while rerouting generated nearly 6% growth in shipping ton-miles in 2024. Longer routes can raise costs for concentrates, coffee, tea, sweeteners, packaging resin, and equipment.
- Trade action on aluminum has added pressure to can-based supply chains. In June 2025, the United States increased Section 232 tariffs on imported steel and aluminum from 25% to 50%. Higher duties can raise cost exposure for aluminum sheet used in energy drinks, carbonated beverages, canned coffee, and Ready To Drink alcoholic products.
Ingredient sourcing is also becoming more regulated. The European Union Deforestation Regulation covers coffee, cocoa, palm oil, soy, and other commodities. Following amendments adopted in 2025, the rules are scheduled to apply from 30 December 2026 for large and medium operators and from 30 June 2027 for micro and small operators.
These developments encourage beverage companies to diversify suppliers, shorten procurement routes, expand regional bottling, and maintain inventories. Local sourcing can improve resilience, but changing tariffs and traceability rules may raise compliance costs. Producers with flexible packaging lines, multiple ingredient origins, and logistics partnerships are positioned to protect availability and respond to trade disruptions.
Regional Analysis
Asia Pacific Leads with a 35.4% Share and USD 168.17 Billion
In 2025, Asia Pacific held the dominant position in the Ready To Drink Beverages Market, accounting for 35.4% and generating USD 168.17 billion. The region benefits from urban populations, expanding retail, rising disposable income, and demand for convenient beverages across China, Japan, South Korea, Southeast Asia, and Australia. In March 2025, the United Nations Economic and Social Commission for Asia and the Pacific reported that the region had more than 2.2 billion urban residents, supporting frequent purchases of portable drinks through supermarkets, convenience stores, vending machines, and delivery platforms.
The World Bank recorded East Asia and Pacific’s population at 2.39 billion in 2024, illustrating the region’s large consumer base. Growth opportunities remain strong in energy drinks, ready-to-drink tea and coffee, functional water, reduced-sugar products, and dairy alternatives. Producers are also widening local flavour portfolios and investing in recyclable bottles, cans, cold-chain capacity, and digital distribution to serve diverse consumer preferences.
Key Regions and Countries Covered
- North America
- The US
- Canada
- Europe
- Germany
- France
- The UK
- Spain
- Italy
- Russia & CIS
- Rest of Europe
- APAC
- China
- Japan
- South Korea
- India
- ASEAN
- Rest of APAC
- Latin America
- Brazil
- Mexico
- Rest of Latin America
- Middle East & Africa
- GCC
- South Africa
- Rest of MEA
Key Players Analysis
Ready To Drink beverage manufacturers focus on strengthening brand differentiation and production efficiency to maintain competitiveness. A key priority is continuous product innovation, including reduced-sugar, functional, plant-based, and premium formulations that address changing consumer preferences. Companies such as The Coca-Cola Company, PepsiCo Inc., Keurig Dr Pepper Inc., and Monster Beverage Corporation invest in packaging upgrades and portfolio expansion to improve convenience and shelf appeal.
Integration with ingredient suppliers, bottlers, retailers, and logistics partners helps secure availability and improve cost control amid volatile packaging and commodity prices. Strategic expansion, particularly across Asia Pacific, supports access to growing urban demand and retail networks. Additionally, companies such as Nestlé S.A., Danone S.A., Suntory Beverage & Food, and Diageo PLC emphasize digital marketing, quality standardization, local flavour development, and channel diversification, while forming distribution partnerships and retail agreements to strengthen customer reach and positioning across high-value beverage segments.
Market Key Players
- The Coca‑Cola Company
- PepsiCo Inc.
- Keurig Dr Pepper Inc.
- Red Bull GmbH
- Monster Beverage Corporation
- Nestlé S.A.
- Danone S.A.
- Suntory Beverage & Food
- Yakult Honsha Co., Ltd.
- Del Monte Foods, Inc.
- Bacardi Limited
- Diageo PLC
- Asahi Group Holdings, Ltd.
- Abbott Laboratories Inc.
- Rauch Fruchtsäfte GmbH & Co OG
- Others
Key Development
- In August 2025, PepsiCo and Celsius Holdings announced a strengthened long-term strategic partnership to expand beverage distribution and portfolio opportunities. Under the agreement, PepsiCo invested USD 585 million in newly issued convertible preferred stock of Celsius Holdings, while Celsius expanded access for its Alani Nu brand through PepsiCo’s distribution system in the United States and Canada.
- In 2025, Red Bull sold nearly 14 billion cans worldwide, representing an increase of more than 10% compared with 2024, while global sales revenue reached approximately EUR 12.2 billion, reflecting an 8.6% year-on-year increase.
- In 2025, Coca-Cola Company acquisition-related investments reached USD 461 million, compared with USD 315 million in 2024, showing continued interest in strategic opportunities that support portfolio diversification and long-term growth.
- In 2025, Nestlé reported CHF 89.5 billion in group sales and 3.5% organic growth, supported by continued investment in key categories such as coffee and beverages. The company’s Powdered and Liquid Beverages segment contributed 28.1% of total sales, making it the largest category within Nestlé’s portfolio and highlighting the importance of beverage innovation for future growth.
Report Scope
| Report Features | Description |
|---|---|
| Market Value (2025) | USD 475.1 Bn |
| Forecast Revenue (2035) | USD 879.2 Bn |
| CAGR (2026-2035) | 6.4% |
| Base Year for Estimation | 2025 |
| Historic Period | 2020-2024 |
| Forecast Period | 2026-2035 |
| Report Coverage | Revenue Forecast, Market Dynamics, Competitive Landscape, Recent Developments |
| Segments Covered | By Product (Carbonated Soft Drinks (CSDs), Energy Drinks, Juice & Nectar RTD, RTD Tea, RTD Coffee, Sports & Functional Drinks/Water, Dairy & Dairy-Alternative RTD, and Other RTD Beverages), By Type (Non-Alcoholic RTD and RTD Alcoholic Beverages), By Packaging (PET & Other Bottles, Cans, Cartons, and Pouches & Others), By Distribution Channel (Supermarkets & Hypermarkets, Convenience & Grocery Stores, Specialty & Liquor Stores, On-Trade/On-Premise, and Online/E-Commerce) |
| Regional Analysis | North America – The US & Canada; Europe – Germany, France, The UK, Spain, Italy, Russia & CIS, Rest of Europe; APAC- China, Japan, South Korea, India, ASEAN & Rest of APAC; Latin America- Brazil, Mexico & Rest of Latin America; Middle East & Africa- GCC, South Africa, & Rest of MEA |
| Competitive Landscape | The Coca-Cola Company, PepsiCo Inc., Keurig Dr Pepper Inc., Red Bull GmbH, Monster Beverage Corporation, Nestlé S.A., Danone S.A., Suntory Beverage & Food, Yakult Honsha Co., Ltd., Del Monte Foods, Inc., Bacardi Limited, Diageo PLC, Asahi Group Holdings, Ltd., Abbott Laboratories Inc., Rauch Fruchtsäfte GmbH & Co OG, and others. |
| Customization Scope | Customization for segments, region/country-level will be provided. Moreover, additional customization can be done based on the requirements. |
| Purchase Options | We have three licenses to opt for: Single User License, Multi-User License (Up to 5 Users), Corporate Use License (Unlimited Users and Printable PDF) |





































