
Quick Navigation
Report Overview
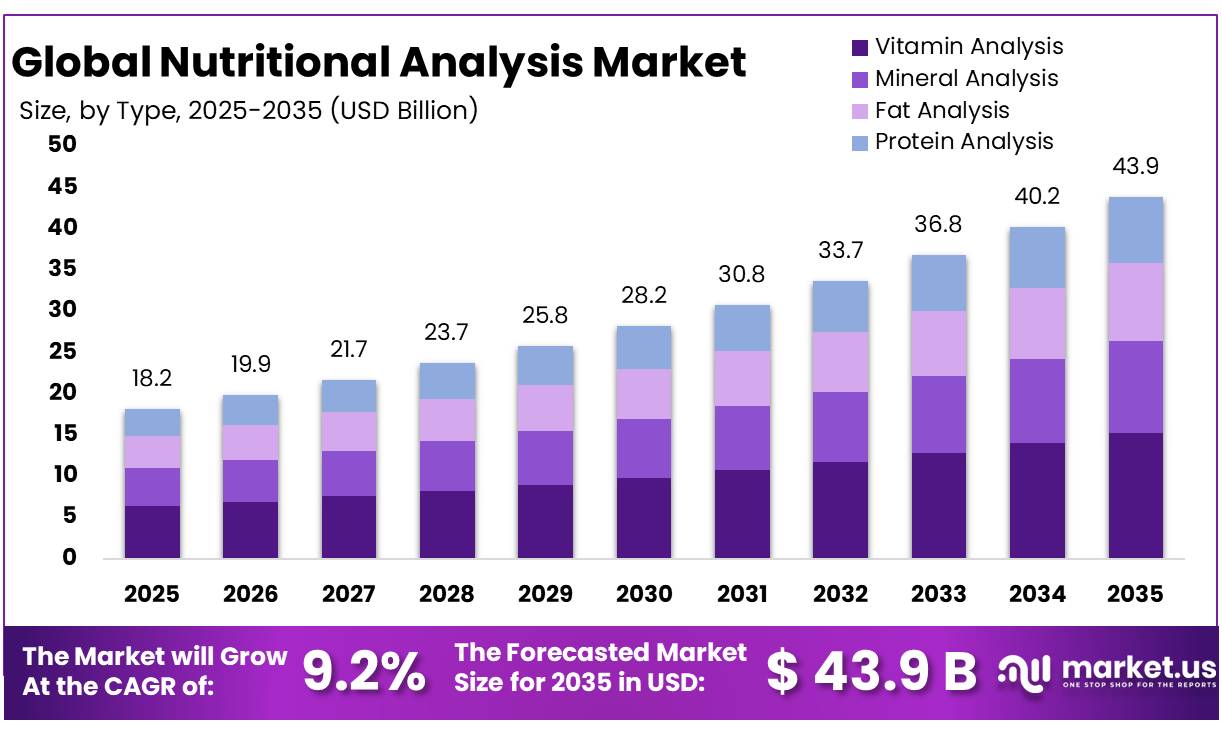
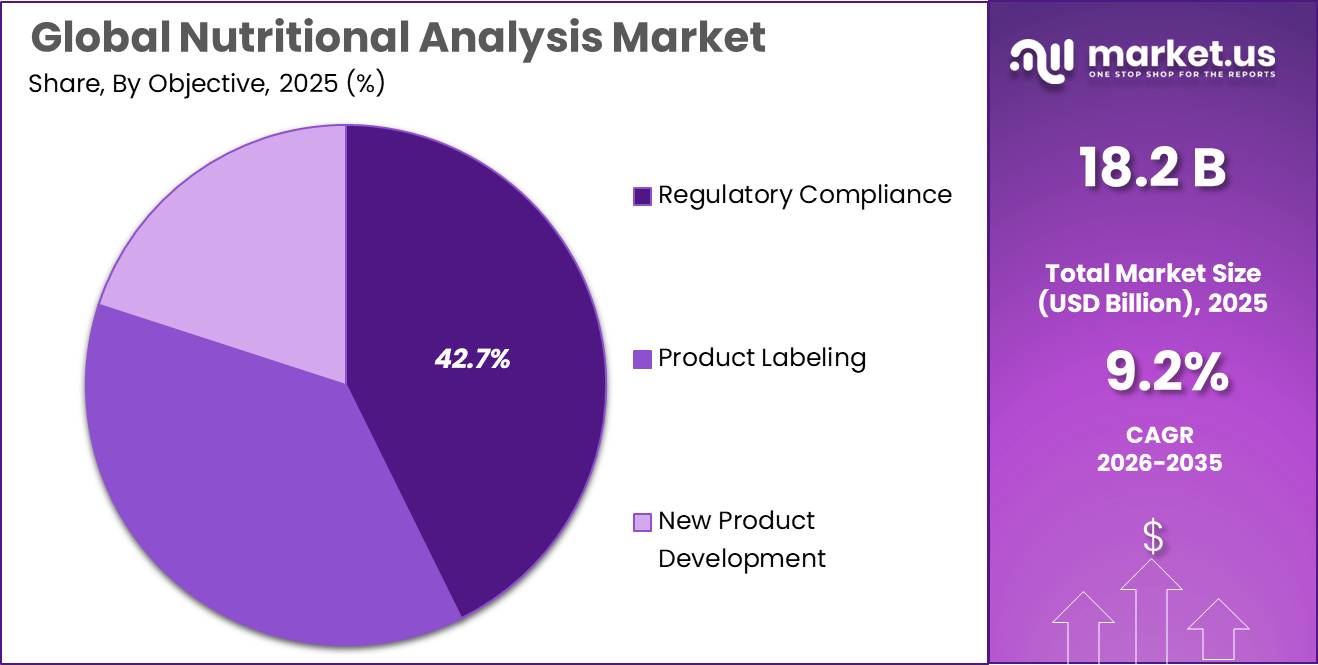
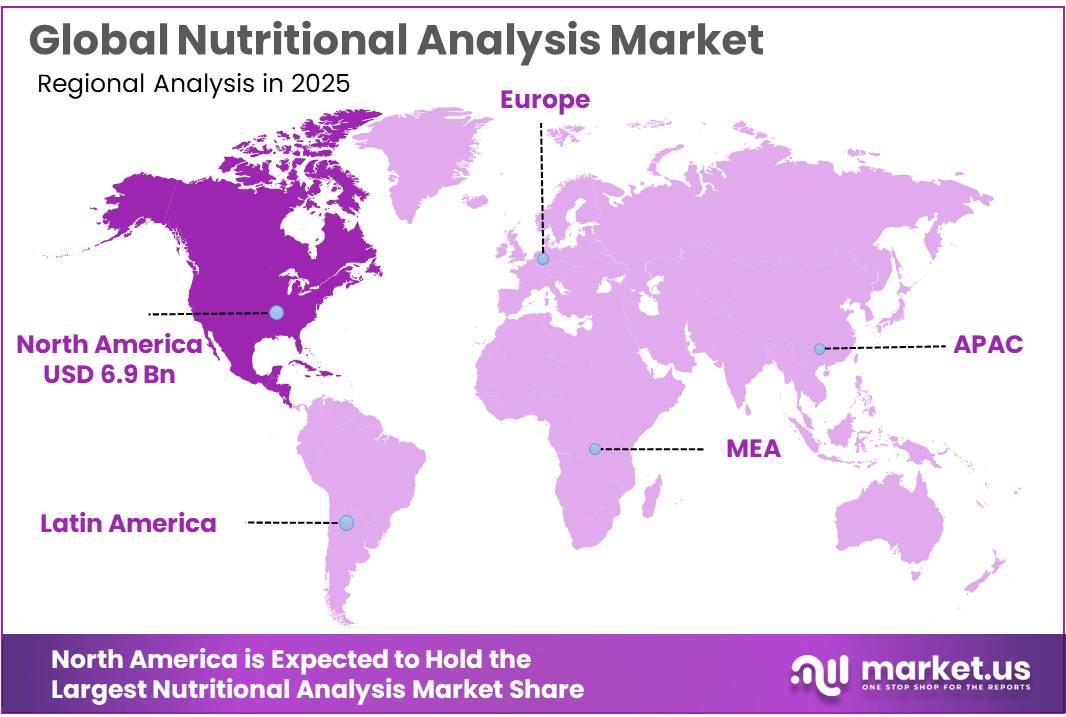
The Global Nutritional Analysis Market size is expected to be worth around USD 43.9 Billion by 2035, from USD 18.2 Billion in 2025, growing at a CAGR of 9.2% during the forecast period from 2026 to 2035. In 2025, North America held a dominant market position, capturing more than a 38.40% share, holding USD 6.9 Billion revenue.
Nutritional analysis has become an important part of the global food testing and quality assurance industry, as food companies, retailers, exporters, and regulators increasingly require accurate data on calories, protein, fat, sugar, sodium, vitamins, minerals, allergens, and label claims.
The industry is mainly driven by packaged food growth, reformulation needs, clean-label demand, and stricter nutrition disclosure rules. In the European Union, Regulation (EU) No. 1169/2011 requires most pre-packed foods to carry nutrition declarations covering energy, fat, saturates, carbohydrate, sugars, protein, and salt, creating steady demand for laboratory-based nutrient testing.
Key Takeaways
- Nutritional Analysis Market size is expected to be worth around USD 43.9 Billion by 2035, from USD 18.2 Billion in 2025, growing at a CAGR of 9.2%.
- Vitamin Analysis held a dominant market position, capturing more than a 24.80% share.
- Regulatory Compliance held a dominant market position, capturing more than a 42.70% share.
- Beverages held a dominant market position, capturing more than a 24.70% share.
- North America held a dominant position in the global Nutritional Analysis Market, accounting for 38.40% of the total market and reaching a value of approximately USD 6.9 Billion.
Demand is also supported by public-health pressure. WHO has pushed sodium reduction, with global sodium benchmarks covering 70 food subcategories, making sodium testing and reformulation support more important for processed food companies. FAO’s SOFI 2025 reported that 2.6 billion people could not afford a healthy diet in 2024, increasing attention on nutritious, affordable, and accurately labelled food. This creates steady testing demand across packaged foods, fortified products, plant-based foods, sports nutrition, and functional beverages.
Government initiatives are a major growth driver. In January 2025, the U.S. FDA proposed front-of-package nutrition labeling for most packaged foods, showing “Low,” “Med,” or “High” levels of saturated fat, sodium, and added sugars. This would increase demand for verified nutrient data before label approval and product launch. Codex also supports nutrition labeling guidance so consumers can understand nutrient content and label claims such as “low fat” or “high fat.”
Intertek Group remains active in this space through its Food Services and wider Total Quality Assurance platform. In 2025, Intertek reported revenue of £3,393 million for 2024, showing the scale of its inspection, testing, and certification network. Its 2025 half-year update also stated that the Food business recorded double-digit like-for-like revenue growth at constant currency, supported by higher demand for food safety testing and hygiene audits.
By Type Analysis
Vitamin Analysis leads with 24.80% share due to growing focus on nutritional quality and precise micronutrient measurement.
In 2025, Vitamin Analysis held a dominant market position, capturing more than a 24.80% share in the Nutritional Analysis Market by type. The segment maintained strong demand due to increasing attention toward food quality, nutrition labeling, and the need for accurate measurement of essential vitamins across food and beverage products. Manufacturers continued to invest in vitamin testing to ensure product consistency and compliance with nutritional standards established across global markets.
By Objective Analysis
Regulatory Compliance dominates with 42.70% share due to increasing focus on nutritional standards and labeling accuracy.
In 2025, Regulatory Compliance held a dominant market position, capturing more than a 42.70% share in the Nutritional Analysis Market by objective. The segment remained the leading focus area as food and beverage companies continued to strengthen nutritional verification processes to meet established regulatory requirements and maintain product credibility in competitive markets.
By Application Analysis
Beverages dominate with 24.70% share driven by rising demand for nutritional transparency and quality testing.
In 2025, Beverages held a dominant market position, capturing more than a 24.70% share in the Nutritional Analysis Market by application. The segment gained strong momentum as beverage manufacturers increased focus on nutritional labeling, product quality, and ingredient validation to meet changing consumer expectations. Growing interest in healthier drink options and functional formulations supported continuous demand for nutritional testing across the beverage industry.
Key Market Segments
By Type
- Vitamin Analysis
- Mineral Analysis
- Fat Analysis
- Protein Analysis
By Objective
- Regulatory Compliance
- Product Labeling
- New Product Development
By Application
- Beverages
- Bakery And Confectionery
- Snacks
- Dairy And Desserts
- Fruits & Vegetables
- Edible Fats & Oils
- Baby Food
- Others
Market Dynamics
Driver Analysis - Growing Consumer Demand for Transparent Food Nutrition Information
As consumers become more health-conscious, the need for accurate nutritional analysis is becoming one of the strongest drivers supporting this industry. Food buyers are no longer choosing products only based on taste or price. They increasingly want clear information about calories, protein, sugar, sodium, vitamins, and ingredient quality before making purchase decisions. This shift is encouraging food manufacturers, laboratories, and testing providers to expand nutritional analysis capabilities across packaged foods, beverages, supplements, and functional food products.
Government agencies and international food organizations are also strengthening nutrition transparency requirements. The World Health Organization (WHO) promotes nutrition labelling as an important policy tool that helps consumers make healthier food purchasing decisions and addresses rising diet-related diseases. WHO also highlights that changing food habits and growing intake of processed foods are increasing the need for better nutritional information systems.
- Consumer behavior data further shows why nutritional analysis continues to gain importance. According to research published by the U.S. Food and Drug Administration (FDA), 87% of U.S. adult consumers reported reading Nutrition Facts labels on food packaging. The most reviewed elements were calories, total sugars, sodium, and serving size, showing that nutritional content has become a major purchase factor rather than optional information.
Restraint Analysis - High Cost of Nutritional Testing and Compliance Limits Wider Adoption
One of the major restraining factors in the Nutritional Analysis market is the high cost and operational burden linked with nutritional testing, food labeling compliance, and continuous product verification. Nutritional analysis is important for food manufacturers because consumers and regulators expect clear and accurate information about calories, proteins, fats, vitamins, minerals, and ingredient composition. However, generating this information requires laboratory testing, certified methods, documentation processes, and periodic updates whenever formulations change.
- According to the U.S. Food and Drug Administration (FDA), implementation of menu and nutrition labeling regulations created an estimated initial compliance cost of around USD 315 million, along with recurring annual costs of nearly USD 44 million. Industry estimates cited by the FDA suggested total implementation-related expenses could reach close to USD 1 billion when nutritional analysis, menu updates, staff training, and compliance activities are included. These costs make nutritional analysis programs difficult for smaller food operators to maintain.
Government and international food agencies continue to promote better nutrition transparency, but implementation remains complex. The Food and Agriculture Organization (FAO) reported that mandatory nutrition labeling can increase production expenses because companies may need product reformulation, additional laboratory analysis, and changes to packaging and supply systems. Such investments are manageable for large food manufacturers but can slow adoption among regional producers and emerging brands.
At the same time, the OECD reported that by May 2022, at least 44 countries had introduced simplified nutrition labeling systems to support healthier food choices. Even with policy support, many governments and food businesses continue to face challenges related to collecting reliable nutrition data and managing administrative costs. As a result, cost remains one of the strongest barriers limiting broader expansion of nutritional analysis services worldwide.
Opportunity Analysis - Personalized Nutrition and Transparent Food Labeling Drive Growth
One of the strongest growth opportunities in the Nutritional Analysis sector is the rising demand for personalized nutrition and better nutritional transparency across food products. Consumers today are paying closer attention to what they eat and want clear information about nutrients, ingredients, calories, vitamins, minerals, protein, sugar, and fat content before making decisions. This shift is creating long-term opportunities for nutritional testing laboratories, food manufacturers, analytical equipment providers, and food data platforms.
Recent global nutrition data shows why this opportunity is expanding. According to the latest estimates from the Food and Agriculture Organization (FAO), the global average cost of a healthy diet reached PPP USD 4.46 per person per day in 2024, while nearly 2.6 billion people worldwide still could not afford a healthy diet. These numbers have increased attention on food quality, affordability, and nutrient measurement across food systems. Nutritional analysis is becoming an important tool to improve food planning, reduce nutrient gaps, and support healthier consumer choices.
Governments and public health organizations are also supporting this transition. The World Health Organization (WHO) continues to promote stronger nutrition data systems and nutrition monitoring to improve dietary outcomes and support public health decisions. WHO has also encouraged easier-to-understand nutritional information on packaged foods to help consumers make informed choices. Nutrition databases and food composition systems are becoming more important in this process because they allow accurate nutrient tracking and standardized labeling.
Emerging Trend Analysis - Front Labels Push Smarter Nutritional Testing Demand
One major emerging trend in nutritional analysis is the rising demand for simple, front-of-pack nutrition information. Food companies are now under more pressure to test nutrients accurately, especially added sugar, sodium, saturated fat, calories, fiber, vitamins, and minerals. In January 2025, the U.S. FDA proposed front-of-package nutrition labels for most packaged foods, showing whether saturated fat, sodium, and added sugars are “Low,” “Med,” or “High.” This is important because brands will need stronger lab testing and verified nutrition data before making label claims.
This trend is also linked with public health needs. WHO says a healthy diet should be low in unhealthy fats, free sugars, and sodium, while supporting more fruits, vegetables, legumes, nuts, and whole grains. This creates a clear business need for nutritional analysis, as food makers reformulate products and check whether new recipes meet health targets.
- Trusted databases are also supporting this trend. USDA FoodData Central lists more than 455,556 branded foods, along with 7,793 SR Legacy foods and 5,432 survey foods, giving companies, researchers, and app developers large reference data for nutrition comparison and product benchmarking.
Regional Insights
North America Dominates Nutritional Analysis with 38.40% Share
In 2025, North America held a dominant position in the global Nutritional Analysis Market, accounting for 38.40% of the total market and reaching a value of approximately USD 6.9 Billion. The region maintained leadership due to its highly developed food and beverage industry, strong regulatory framework, advanced laboratory infrastructure, and increasing demand for verified nutritional information across packaged food categories.
The region’s growth has been strongly supported by rising consumer attention toward food quality, ingredient transparency, and health-focused product selection. Food manufacturers across North America continue to increase investment in nutritional testing to validate product claims and improve labeling accuracy. Nutritional analysis remains an essential process for measuring vitamins, minerals, proteins, fats, carbohydrates, and calorie content across processed foods, beverages, and fortified products.
Key Regions and Countries Insights
- North America
- US
- Canada
- Europe
- Germany
- France
- The UK
- Spain
- Italy
- Rest of Europe
- Asia Pacific
- China
- Japan
- South Korea
- India
- Australia
- Rest of APAC
- Latin America
- Brazil
- Mexico
- Rest of Latin America
- Middle East & Africa
- GCC
- South Africa
- Rest of MEA
Key Players Analysis
Intertek Group remains one of the recognized participants in the Nutritional Analysis Market through its food and nutritional testing services across global food supply chains. The company supports nutrient profiling, label verification, contaminant assessment, and quality assurance activities. Intertek operates in more than 100 countries with a network exceeding 1,000 laboratories and offices. The company continues expanding food testing capabilities to support manufacturers seeking accurate nutritional declarations and compliance-driven product development.
Thermo Fisher Scientific plays an important role in nutritional analysis by supplying analytical instruments, laboratory technologies, and testing workflows used for nutrient detection and food composition studies. Its portfolio supports testing of vitamins, proteins, minerals, and food ingredients. The company generated approximately USD 42 billion in annual revenue and employs over 125,000 people globally. Its analytical technologies continue to support food laboratories focused on precision and faster nutritional evaluation processes.
AsureQuality Limited supports nutritional and food testing through laboratory services, certification, and quality assurance programs across agricultural and food sectors. The company operates across food verification, nutrient measurement, and export-focused quality systems. AsureQuality works with customers in more than 40 international markets and performs over 600,000 laboratory tests annually across food-related categories. Its service capabilities continue supporting nutritional transparency and product integrity requirements.
Top Key Players Outlook
- Intertek Group,
- Thermo Fisher Scientific,
- AsureQuality Limited (New Zealand)
- TÜV Nord Group (Germany)
- Microbac Laboratories Inc. (US)
- SGS SA (Switzerland)
- Mérieux NutriSciences (US)
- ALS Limited (Australia)
- Campden BRI (UK)
- Romer Labs (Austria)
- Covance Inc. (US)
Recent Developments
In 2025, Intertek reported revenue of £3.43 billion, up 4.3% at constant currency, with adjusted operating profit of £620 million. For investment and expansion, Intertek continued to grow its wider testing network, including acquisitions such as SUPLILAB in Costa Rica in 2025, which expanded its ATIC footprint in Central America.
In 2025, Thermo Fisher Scientific reported USD 44.56 billion revenue in 2025, up 4% from 2024, and generated USD 6.34 billion in free cash flow. For expansion, Thermo Fisher deployed about USD 16.5 billion of capital in 2025, including USD 13 billion committed to mergers and acquisitions. Its planned USD 9.4 billion Clario acquisition and food testing solutions show its focus on stronger laboratory, digital, and analytical capabilities.
Report Scope
| Report Features | Description |
|---|---|
| Market Value (2025) | USD 18.2 Bn |
| Forecast Revenue (2035) | USD 43.9 Bn |
| CAGR (2026-2035) | 9.2% |
| Base Year for Estimation | 2025 |
| Historic Period | 2020-2024 |
| Forecast Period | 2026-2035 |
| Report Coverage | Revenue Forecast, Market Dynamics, Competitive Landscape, Recent Developments |
| Segments Covered | By Type (Vitamin Analysis, Mineral Analysis, Fat Analysis, Protein Analysis), By Objective (Regulatory Compliance, Product Labeling, New Product Development), By Application (Beverages, Bakery And Confectionery, Snacks, Dairy And Desserts, Fruits And Vegetables, Edible Fats & Oils, Baby Food, Others) |
| Regional Analysis | North America – US, Canada; Europe – Germany, France, The UK, Spain, Italy, Rest of Europe; Asia Pacific – China, Japan, South Korea, India, Australia, Singapore, Rest of APAC; Latin America – Brazil, Mexico, Rest of Latin America; Middle East & Africa – GCC, South Africa, Rest of MEA |
| Competitive Landscape | Intertek Group, Thermo Fisher Scientific, AsureQuality Limited (New Zealand), TÜV Nord Group (Germany), Microbac Laboratories Inc. (US), SGS SA (Switzerland), Mérieux NutriSciences (US), ALS Limited (Australia), Campden BRI (UK), Romer Labs (Austria), Covance Inc. (US) |
| Customization Scope | Customization for segments, region/country-level will be provided. Moreover, additional customization can be done based on the requirements. |
| Purchase Options | We have three licenses to opt for: Single User License, Multi-User License (Up to 5 Users), Corporate Use License (Unlimited User and Printable PDF) |


