


Report Overview
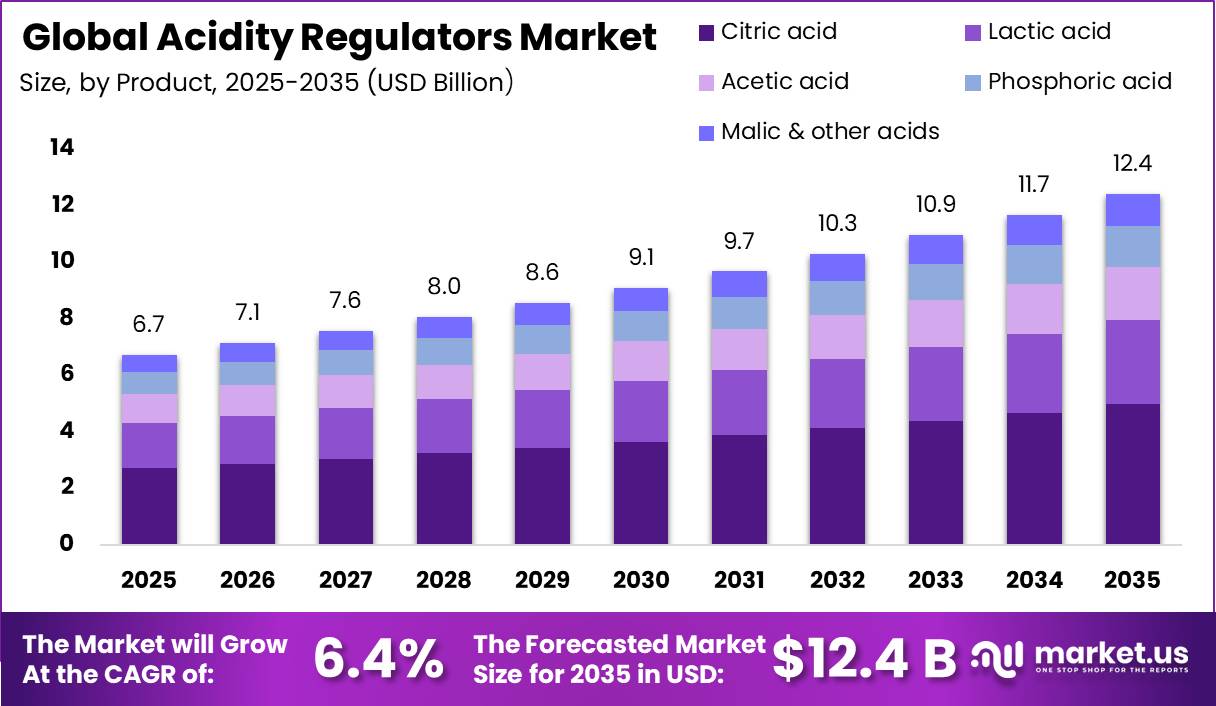
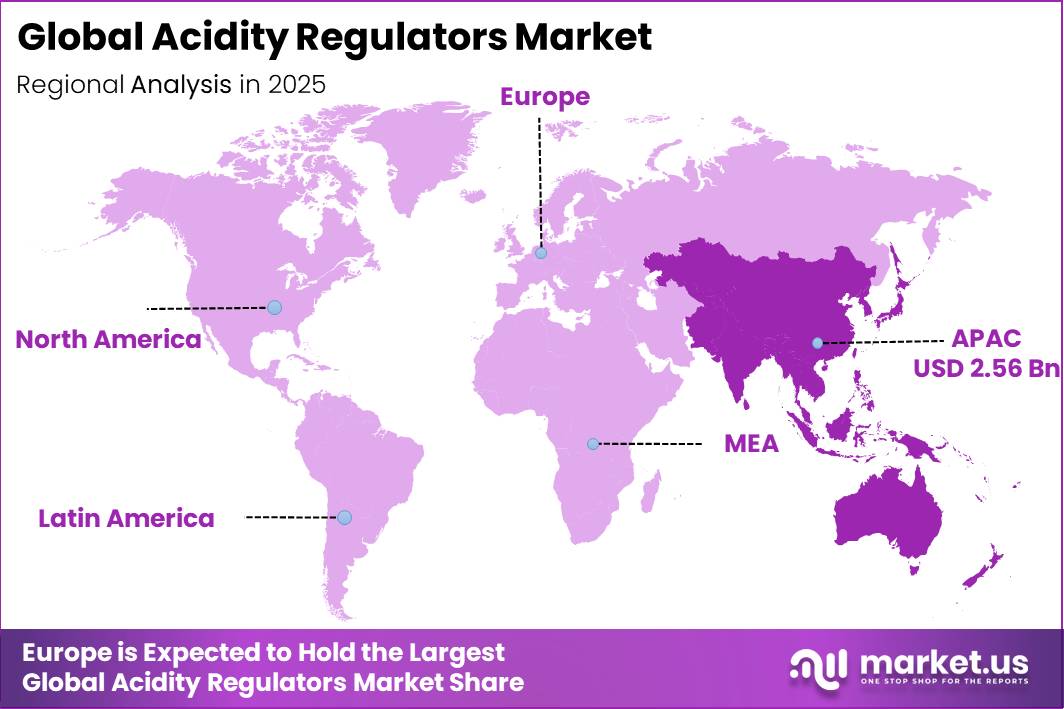
In 2025, the Global Acidity Regulators Market was valued at USD 6.7 billion, and between 2026 and 2035, this market is estimated to register a CAGR of 6.4%, reaching about USD 12.4 billion by 2035. In 2025, Asia Pacific led the market, achieving over 38.1% share with a revenue of USD 2.56 billion.
Acidity regulators are food additives used to control acidity or alkalinity, maintain a stable pH, strengthen flavour, retain colour, and improve product consistency. They are widely used in beverages, dairy products, bakery foods, confectionery, sauces, processed vegetables, meat products, and canned foods.
- From 10 to 14 November 2025, the 48th Session of the FAO-WHO Codex Alimentarius Commission reviewed international food standards, including more than 500 food-additive The Codex General Standard for Food Additives database, updated through this session, lists 88 additives under the acidity-regulator functional class.
Key Takeaways
- The Global Acidity Regulators Market was valued at USD 6.7 billion in 2025.
- The market is projected to grow at a CAGR of 6.4% and is estimated to reach USD 12.4 billion by 2035.
- On the basis of product, Citric acid dominated the market, constituting 40.1% of the total market share.
- Based on the application, Beverages dominated the market, with a substantial market share of around 35.1%.
- Based on the function, pH control / acidulant led the market, comprising 55.1% of the total market.
- On the basis of source, Synthetic dominated the market, constituting 60.1% of the total market share.
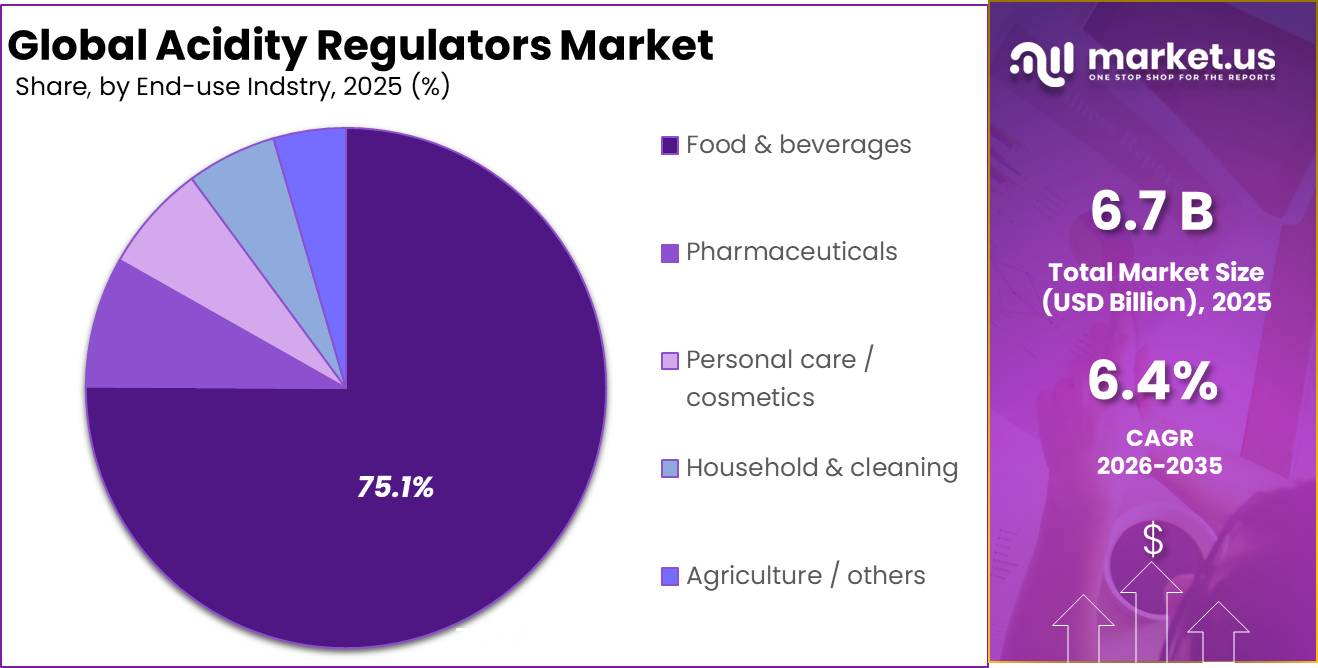
- Based on the end-use industry, Food & beverages dominated the market, with a substantial market share of around 75.1%.
- In 2025, Asia Pacific was the most dominant region in the market, accounting for 38.1% of the total global consumption.
This broad regulatory coverage supports the commercial use of citric, phosphoric, lactic, acetic, and malic acids in food manufacturing. The industrial outlook is supported by the scale of food and beverage processing.
- On 13 March 2023, the USDA Economic Research Service reported that the United States food and beverage manufacturing sector employed 1.7 million people in 2021, accounting for 15.4% of total manufacturing employment.
- On 17 October 2024, USDA further reported that the country had 42,708 food and beverage manufacturing establishments in 2022.
Food safety requirements remain a major demand driver. In June 2026, WHO reported that unsafe food causes an estimated 866 million illnesses and 1.5 million deaths annually, with children under 5 accounting for 143,000 deaths. This burden encourages manufacturers to strengthen microbial control and quality assurance.
- On 11 May 2026, WHO reported that average global adult sodium intake was 4,278 mg per day in 2021, equivalent to approximately 11 g of salt. This was more than twice its recommendation of below 2,000 mg of sodium or 5 g of salt per day. Excess sodium consumption was associated with approximately 1.7 million deaths in 2023.
On 17 April 2024, WHO also published sodium benchmarks covering 70 processed-food subcategories. Acidity regulators can help manufacturers preserve flavour intensity and product stability while reducing sodium in soups, sauces, bakery foods, snacks, and prepared meals.
Future growth opportunities will also emerge from waste reduction and cleaner formulations. According to the FAO (updated 3 April 2025), around 13.2% of food is lost between post-harvest and retail, while the UNEP Food Waste Index Report 2024 estimates that an additional 1.05 billion tonnes of food are wasted across retail, food services, and households. Together, food loss and waste contribute an estimated 8%–10% of global greenhouse gas emissions.
- In September 2025, the European Union adopted Directive 2025/1892, requiring food waste reductions of 10% in processing and manufacturing and 30% per capita across retail and consumption by 31 December 2030, compared with the 2021–2023 annual average. These targets support opportunities for fermentation-derived acids, precise dosing systems, cleaner-label formulations, and products that maintain quality for longer periods.
Product Analysis
Citric Acid leads with a 40.1% share due to its wide use across food processing
In 2025, Citric Acid held a dominant market position, capturing more than a 40.1% share. Its leadership was supported by its reliable performance in beverages, confectionery, bakery products, dairy items, sauces, and processed foods. Manufacturers widely use citric acid to control acidity, improve flavour, maintain product stability, and support longer shelf life.
- According to the U.S. Food and Drug Administration (FDA), citric acid is affirmed as Generally Recognized as Safe (GRAS) for use in food (21 CFR §184.1033) and is widely used for functions including pH control, flavor enhancement, sequestration, antioxidant support, and preservative applications. This broad functional range allows producers to use one ingredient for several formulation needs, helping citric acid maintain strong demand.
Lactic Acid is the fastest-growing segment. Its growth is supported by rising use in fermented foods, dairy products, meat processing, pickled products, beverages, and clean-label formulations. In 2026, the U.S. Food and Drug Administration recognized lactic acid for applications such as antimicrobial treatment, curing and pickling, flavour enhancement, acidity control, and use as a solvent or processing vehicle.
Application Analysis
Beverages dominate the Acidity Regulators Market with more than a 35.1% share due to their continuous need for stable taste and acidity.
In 2025, Beverages held a dominant market position, capturing more than a 35.1% share. Acidity regulators are essential in carbonated drinks, fruit beverages, flavoured water, and other packaged drinks because they help manufacturers control pH, maintain a balanced taste, and keep formulations stable throughout their shelf life.
- According to recent industrial data (2025), the UK soft drinks and bottled water manufacturing sectors continue to expand in industry. Driven by the UK soft drink production market is projected to reach between £8.7 billion, while the specialized bottled water production market stands at £1.5 billion.
This directly reflects the large commercial scale of beverage manufacturing and supports steady demand for citric acid, phosphoric acid, malic acid, and other acidity-control ingredients used in drink production.
Processed Food is the fastest growing segment. In 2026, processed-food producers continued to use acidity regulators across canned foods, sauces, bakery products, confectionery, frozen desserts, and dairy-based products. These ingredients help control acidity, reduce spoilage risks, and maintain a consistent taste during processing and storage. The FDA’s food-ingredient information identifies pH-control agents in low-acid canned foods, chocolate, frozen desserts, and baking products, supporting their wider use as convenience and packaged-food production expands.
Function Analysis
pH Control / Acidulant leads with a 55.1% share as manufacturers prioritise consistent acidity and food safety.
In 2025, pH Control / Acidulant held a dominant market position, capturing more than a 55.1% share. This function remains widely used because manufacturers must maintain precise acidity levels to protect taste, texture, colour and product stability. Government requirements also strengthen its importance in processed foods.
- In June 2025, the U.S. Food and Drug Administration stated that acidified foods must maintain a finished equilibrium pH of no more than 4.6. The agency also identified routine pH testing as an essential manufacturing control. These requirements encourage food processors to use acidulants consistently across sauces, vegetables, beverages, seafood and other packaged products.
Preservative is the fastest growing segment in the acidity regulators market. Its expansion is supported by the rising production of packaged foods that must remain stable during processing, transport and storage. Acidity regulators support preservation by creating conditions that restrict the growth of harmful microorganisms and slow quality deterioration.
Source Analysis
Synthetic sources dominate with a 60.1% share due to consistent quality and dependable pH control.
In 2025, Synthetic held a dominant market position, capturing more than a 60.1% share. Its leadership was supported by consistent purity, stable performance, easy availability, and lower production costs. Food and beverage manufacturers commonly prefer synthetic acidity regulators because they provide precise pH control across large production batches while reducing differences caused by seasonal raw materials.
Natural is the fastest growing segment. Its growth is being driven by stronger demand for clean-label foods and ingredients obtained through plants, fruits, and fermentation. Manufacturers are increasingly using naturally sourced citric, lactic, malic, and tartaric acids to meet changing consumer preferences. However, higher sourcing costs, seasonal availability, and variations in purity can limit their use in large-scale food processing.
End-use Industry Analysis
Food & beverages dominates the acidity regulators market with a 75.1% share, supported by widespread pH-control needs.
In 2025, Food & beverages held a dominant market position, capturing more than a 75.1% share. Acidity regulators are heavily used in beverages, bakery items, frozen desserts, sauces, canned foods and other processed products to manage acidity, improve flavour and reduce spoilage. The U.S. FDA identifies citric acid and lactic acid as common pH-control agents used in beverages and several processed-food categories. Government data also show the large industrial base behind this demand.
- In 2025, UK consumer expenditure on food and alcoholic drinks reached £303.3 billion, increasing by 1.1% in real terms compared with 2024. This high level of spending reflects the large production and consumption base for processed foods and beverages, where acidity regulators are widely used to control pH, maintain flavour, improve product stability and extend shelf life.
Pharmaceuticals is the fastest growing segment in the acidity regulators market. Pharmaceutical manufacturers use acids, bases and buffering agents to maintain the required pH, solubility and stability of oral liquids, injections, ophthalmic products and other medicines. The FDA maintains a dedicated database of inactive ingredients used in approved drug products and provides specific guidance for pH adjusters in parenteral, ophthalmic and otic medicines.
- In 2025, the FDA approved 46 novel drugs and 91 first-time generic drug products, indicating continued formulation activity and wider opportunities for pharmaceutical-grade acidity regulators.
Key Market Segments
By Product
- Citric acid
- Lactic acid
- Acetic acid
- Phosphoric acid
- Malic & other acids
By Application
- Beverages
- Processed food
- Sauces, condiments & dressings
- Bakery & confectionery
- Dairy & others
By Function
- pH control / acidulant
- Preservative
- Flavor enhancer
- Buffering agent & others
By Source
- Synthetic
- Natural
- Blended / others
By End-use Industry
- Food & beverages
- Pharmaceuticals
- Personal care / cosmetics
- Household & cleaning
- Agriculture / others
Driver Analysis
Raw-material cost pass-through and formulation shifts.
The acidity regulators market is also being shaped by upstream chemical and mineral economics: U.S. Geological Survey data notes that the United States is the world’s leading producer and consumer of phosphate rock, a key feedstock for phosphoric-acid value chains, while EPA supply-chain profiling shows phosphate rock is used to manufacture phosphoric acid and that around 95 percent of U.S. phosphate rock consumed in 2017 was used to make phosphoric acid by the wet process. At the broader chemicals level, the BLS producer price index for industrial chemicals reached 343.719 in June 2026, after 344.239 in May 2026 and 328.736 in April 2026, indicating continued cost volatility in the chemical complex feeding food-ingredient pricing.
That volatility changes behavior on both sides of the market: suppliers push indexed pricing and portfolio mix upgrades, while food manufacturers rebalance between citrates, phosphates, carbonates, and blended systems based on delivered cost, buffering performance, and labeling fit rather than historical formulation inertia. The effect is not purely negative for market growth because cost pass-through inflates market value and encourages reformulation workstreams that often increase the number of acidity-control components per SKU, yielding an estimated +0.7 percentage-point addition to CAGR in the short term.
Drivers Impact Analysis
| Driver | (~) % Impact on CAGR Forecast | Geographic Relevance | Impact Timeline |
|---|---|---|---|
| Acidified food compliance demand | +1.4% | North America core, export-oriented LATAM and APAC processors serving US | Short term (≤ 2 years) |
| Beverage acidulation and flavor balancing | +1.1% | North America core, EU, APAC corridors | Short term (≤ 2 years) |
| Processed food shelf-life optimization | +1.0% | EU, North America, urban APAC | Medium term (2-4 years) |
| Additive standardization across regulated markets | +0.8% | EU core, UK, Canada, premium APAC export hubs | Medium term (2-4 years) |
| Raw-material cost pass-through and formulation shifts | +0.7% | Global, with strongest effect in phosphate- and soda-ash-linked regions | Short term (≤ 2 years) |
| Industrialized food trade and plant registrations | +0.6% | North America import channels, ASEAN export bases, MENA processing hubs | Medium term (2-4 years) |
Restraint Analysis
China trade-duty exposure
Trade friction remains a material restraint because the U.S. International Trade Commission determined in May 2026 that removing existing antidumping and countervailing duty orders on citric acid and certain citrate salts from China would likely lead to recurrence of material injury, meaning the orders stay in place, while the Commission’s earlier public report quantified antidumping duties at about $835.32 to $861.52 per metric ton; for importers and downstream blenders this creates a hard cost floor that can add roughly 8% to 15% to landed cost depending on freight and purity grade, reduces arbitrage flexibility during spot shortages, forces greater working-capital buffers and supplier diversification, and ultimately lowers volume elasticity in beverage, processed food, and industrial applications, supporting an estimated -0.9 percentage-point CAGR deduction centered on North America and second-order spillovers into other markets when non-Chinese supply is reallocated at premium prices.
Restraint Impact Analysis
| Restraint | (~) % Impact on CAGR Forecast | Geographic Relevance | Impact Timeline |
|---|---|---|---|
| Raw material volatility | -1.4% | Global; APAC export corridors; EU; North America | Short term (≤ 2 years) |
| China trade-duty exposure | -0.9% | North America core; select EU import channels | Medium term (2-4 years) |
| Regulatory reformulation burden | -1.1% | EU core; UK-aligned markets; multinational portfolios | Medium term (2-4 years) |
| Chemical cost inflation | -0.8% | EU; North America; import-dependent LATAM/MEA | Short term (≤ 2 years) |
| Multi-jurisdiction compliance lag | -0.7% | Global; cross-border suppliers | Medium term (2-4 years) |
| Capacity and lead-time rigidity | -0.6% | APAC manufacturing hubs; EU; North America | Long term (≥ 4 years) |
Opportunity Analysis
Feed acidifier adjacencies
This is not a baseline market driver for the food-grade acidity regulators market because the core forecast usually assumes mature use in food preservation and taste balancing, while the upside comes from stepping into adjacent feed-acidifier demand where the regulatory architecture is already explicit but market penetration remains fragmented. EFSA states that feed additives include technological additives such as acidity regulators and that authorisations are granted for 10 years with renewal requirements, creating a stable approval pathway that favors scaled entrants capable of dossier management and regional technical sales.
Quantitatively, adjacent-feed entry can raise addressable demand per customer relationship by 1.6x to 2.2x, expand EBITDA margins by 300 to 600 basis points when sold as functional blends, and reduce customer acquisition cost by 20% to 30% where the same distributor already serves food, feed or farm-integrator channels. UN Comtrade’s global chemicals trade coverage and Codex/FDA regulatory standardization together support the view that cross-border raw-material availability is not the main constraint; the gap is commercialization capability, local registration execution and application engineering. If leading acidity-regulator suppliers push adjacency capture from a niche offering to roughly 10% to 15% of portfolio revenue by the early 2030s, the segment could reasonably generate about 2.1 percentage points of upside CAGR over baseline.
Opportunity Impact Analysis
| Opportunity | (~) % Potential CAGR Upside | Geographic Relevance | Execution Window |
|---|---|---|---|
| Organic-certified acid systems | +1.4% | North America core, EU | Short term (≤ 2 years) |
| Feed acidifier adjacencies | +2.1% | EU, APAC emerging markets, LatAm | Medium term (2-4 years) |
| Clean-label mineral buffering blends | +1.7% | EU, North America, Japan | Medium term (2-4 years) |
| Export-led Codex harmonized SKUs | +1.9% | ASEAN, GCC, Africa, LatAm | Short term (≤ 2 years) |
| Beverage reformulation platforms | +2.3% | North America, EU, urban APAC | Medium term (2-4 years) |
| M&A roll-up in regional blenders | +1.6% | India, Southeast Asia, Eastern Europe | Long term (≥ 4 years) |
Challenges Analysis
Volatile organic acid feedstocks
Citric acid production, for example, relies on carbohydrate‑rich substrates like corn, sugar beet, or cassava, making supply sensitive to climatic shocks and fertilizer price spikes; season‑to‑season yield variability of 5–10% can push upstream substrate prices up or down by 8–15%, driving finished citric acid price swings in the range of 10–20% in highly exposed APAC and EU chemical belts. Phosphoric and other mineral acids used as acidity regulators are energy‑intensive to manufacture and subject to regulatory constraints on emissions and waste streams, so electricity and gas price volatility of 15–30% since 2022 in several regions has translated into unit production cost fluctuations of 5–10% for key regulators.
These swings raise the standard deviation of monthly raw‑material cost indices for acidity regulators to 6–9 percentage points in exposed markets, forcing manufacturers into shorter contracting horizons (often 3–6 months instead of 12 months) and higher safety‑stock levels of 10–20 days inventory, tying up working capital and compressing EBITDA margins by 60–120 basis points. Strategic mitigation requires diversifying agricultural feedstock sourcing across at least 3–4 regions per major acid, investing in process efficiencies that cut energy intensity by 10–15%, and deploying dynamic pricing and hedging models that adjust contract terms based on monthly cost indices, which can reasonably normalize volatility impacts over a medium‑term horizon (2–4 years) but will still limit achievable CAGR by roughly 0.8 percentage points in 2026 as these structural adjustments roll out
Challenges Impact Analysis
| Challenge | (~) % CAGR Friction Drag | Geographic Relevance | Mitigation Horizon |
|---|---|---|---|
| Multi-layer additive compliance | -1.0% | EU regulatory hubs, North America, India | Long term (≥ 4 years) |
| Volatile organic acid feedstocks | -0.8% | APAC chemical belts, Middle East, EU | Medium term (2-4 years) |
| Corrosive chemical logistics strain | -0.7% | APAC logistics corridors, Latin America, Africa | Long term (≥ 4 years) |
| Food safety talent deficit | -0.6% | North America core, EU, India | Medium term (2-4 years) |
| Additive health-perception risk | -0.5% | EU, North America, urban Asia | Long term (≥ 4 years) |
| Data-intensive traceability pressure | -0.4% | EU regulatory hubs, North America, advanced APAC | Short term (≤ 2 years) |
Geopolitical Impact Analysis
Geopolitical Impact of Ongoing Global Conflicts on the Acidity Regulators Market
The ongoing geopolitical conflicts, including the Russia–Ukraine war and continued tensions across the Middle East, have created new challenges for the global acidity regulators market. These events have affected the supply of key raw materials, energy costs, and international shipping routes. Many acidity regulators, such as citric acid, phosphoric acid, lactic acid, and acetic acid, depend on stable supplies of agricultural feedstocks, minerals, and chemical intermediates. Higher fuel prices and disruptions in transport through regions such as the Red Sea have increased freight costs and extended delivery times for manufacturers and food processors.
European producers have faced higher production expenses because of elevated natural gas and electricity prices, while companies in Asia-Pacific have adjusted sourcing strategies to reduce dependence on affected trade routes. Food and beverage manufacturers have also increased safety stocks to avoid interruptions in production, leading to short-term changes in purchasing patterns. At the same time, several global suppliers are expanding regional manufacturing and strengthening local supply chains to improve resilience against future disruptions.
Despite these short-term pressures, demand for acidity regulators remains stable because they are essential ingredients in processed foods, beverages, pharmaceuticals, and personal care products. Continued investment in diversified sourcing and regional production is expected to support market stability and long-term growth even as geopolitical uncertainties persist.
Regional Analysis
Asia-Pacific Dominates the Acidity Regulators Market.
Asia-Pacific dominated the global acidity regulators market in 2025, accounting for 38.1% of total revenue, valued at approximately USD 2.56 billion. The region’s leadership is supported by its large food and beverage manufacturing base, expanding pharmaceutical production, and growing processed food consumption across China, Japan, South Korea, Indonesia, Thailand, and other Southeast Asian countries. China remains the largest producer and consumer of food additives, while Japan and South Korea continue to witness strong demand for premium packaged foods and functional beverages that require effective pH control and product stability.
North America is projected to register the fastest growth during the forecast period, driven by rising consumption of convenience foods, clean-label beverages, dietary supplements, and pharmaceutical products. The United States accounts for the largest share of regional demand due to its advanced food processing industry, valued at over USD 900 billion annually according to the U.S. Department of Agriculture (USDA).
Key Regions and Countries Covered
- North America
- The US
- Canada
- Europe
- Germany
- France
- The UK
- Spain
- Italy
- Russia and CIS
- Rest of Europe
- APAC
- China
- Japan
- South Korea
- India
- ASEAN
- Rest of APAC
- Latin America
- Brazil
- Mexico
- Rest of Latin America
- Middle East and Africa
- GCC
- South Africa
- Rest of MEA
Key Players Analysis
Corbion N.V. operates with more than 2,200 employees and reported annual revenue of approximately EUR 1.3 billion in 2025, reflecting steady growth in food ingredient solutions. The company allocates around 5–6% of revenue to research and development, strengthening its portfolio of lactic acid and acidulant solutions. With production facilities across 10+ countries and distribution in over 100 markets, Corbion maintains a strong global footprint. Its bio-based product segment contributes nearly 60% of total sales, reinforcing its position in sustainable acidity regulators.
Kerry Group plc recorded revenue exceeding EUR 6.6 billion in 2025, with its taste and nutrition division contributing nearly 75% of total earnings. The company employs over 19,000 professionals globally and operates in more than 50 countries, ensuring wide distribution of acidity regulator solutions. Approximately 30% of its new product launches focus on clean-label and functional ingredients, including acidity regulators, supporting its strong position in processed food and beverage applications.
Bartek Ingredients Inc. produces over 30,000 metric tons annually of acidulants such as malic and fumaric acid, positioning it as a major supplier in North America. The company operates one of the world’s largest malic acid production facilities, with capacity utilization exceeding 85%. Its export network spans more than 40 countries, contributing to a growing international revenue share of nearly 35%. Continuous capital investment, estimated at over USD 170 million in recent expansions, supports production efficiency and strengthens its competitiveness in acidity regulator markets.
The Major Players in The Industry
- Cargill Incorporated
- Archer Daniels Midland Company (ADM)
- Tate and Lyle PLC
- Jungbunzlauer Suisse AG
- Corbion N.V.
- Kerry Group plc
- Bartek Ingredients Inc.
- B.C Industries Inc.
- Foodchem International Corporation
- Celrich Products Pvt. Ltd.
- Chemelco International B.V.
- Fuerst Day Lawson Ltd.
- Innophos Inc.
- Univar Solutions Inc.
- BASF SE
- Other Key Players
Key Development
- In June 2025, Cargill agreed to acquire all issued shares held by the Teys family, lifting its ownership of Teys Australia and Teys USA to 100%. The deal followed a 14-year joint venture and continued a business legacy of more than 75 years, dating back to Teys’ establishment in 1946. The transaction covered 2 main operating companies and was expected to close in the second half of 2025, subject to regulatory approvals. Teys employs about 5,000 people, giving Cargill greater control over beef processing, exports and wider global food production.
- In January 2025, Archer Daniels Midland Company (ADM) acquired Vandamme Hungaria Kft for USD 120 million, adding a non-genetically modified crushing and extraction facility with a processing capacity of 700 metric tons per day. The acquisition supported ADM’s Carbohydrate Solutions division, which also manufactures citric acid for food and industrial applications.
Report Scope
| Report Features | Description |
|---|---|
| Market Value (2025) | USD 6.7 Bn |
| Forecast Revenue (2035) | USD 12.4 Bn |
| CAGR (2026-2035) | 6.4% |
| Base Year for Estimation | 2025 |
| Historic Period | 2020-2024 |
| Forecast Period | 2026-2035 |
| Report Coverage | Revenue Forecast, Market Dynamics, Competitive Landscape, Recent Developments |
| Segments Covered | By Product (Citric acid, Lactic acid, Acetic acid, Phosphoric acid, and Malic & other acids), By Application (Beverages, Processed food, Sauces, condiments & dressings, Bakery & confectionery, and Dairy & others), By Function (pH control / acidulant, Preservative, Flavor enhancer, and Buffering agent & others), By Source (Synthetic, Natural, and Blended / others), By End-use Industry (Food & beverages, Pharmaceuticals, Personal care / cosmetics, Household & cleaning, and Agriculture / others) |
| Regional Analysis | North America – The US and Canada; Europe – Germany, France, The UK, Spain, Italy, Russia and CIS, Rest of Europe; APAC– China, Japan, South Korea, India, ASEAN and Rest of APAC; Latin America– Brazil, Mexico and Rest of Latin America; Middle East and Africa– GCC, South Africa, and Rest of MEA |
| Competitive Landscape | Cargill Incorporated, Archer Daniels Midland Company (ADM), Tate & Lyle PLC, Jungbunzlauer Suisse AG, Corbion N.V., Kerry Group plc, Bartek Ingredients Inc., F.B.C Industries Inc., Foodchem International Corporation, Celrich Products Pvt. Ltd., Chemelco International B.V., Fuerst Day Lawson Ltd., Innophos Inc., Univar Solutions Inc., BASF SE, Other Key Players |
| Customization Scope | Customization for segments, region/country-level will be provided. Moreover, additional customization can be done based on the requirements. |
| Purchase Options | We have three licenses to opt for: Single User License, Multi-User License (Up to 5 Users), Corporate Use License (Unlimited Users and Printable PDF) |





































