


Report Overview
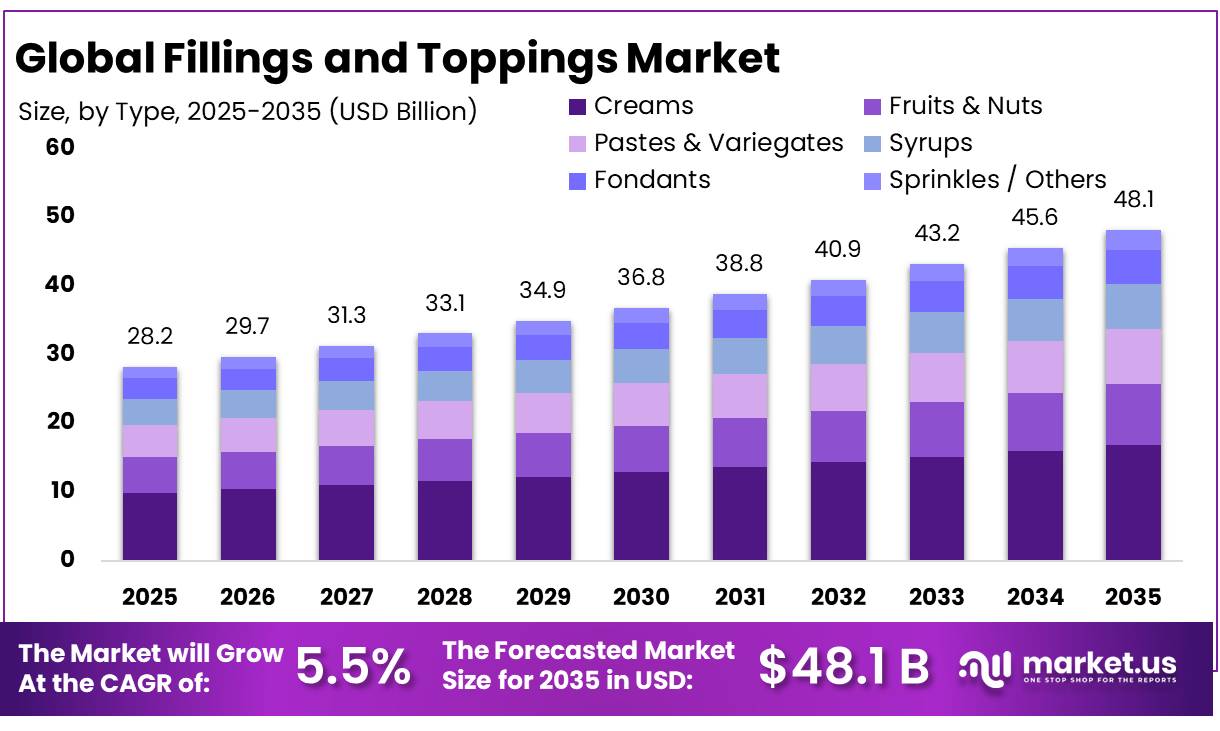
In 2025, the Global Fillings and Toppings Market was valued at USD 28.2 Billion, and between 2026 and 2035, this market is estimated to register a CAGR of 5.5%, reaching about USD 48.1 Billion by 2035. Asia-Pacific held a dominant market position, capturing more than a 27.2% share, holding USD 7.6 Billion in revenue.
The fillings and toppings industry is an important part of the processed-food value chain, supplying fruit fillings, chocolate preparations, creams, syrups, icings, glazes, nut pastes, caramel and decorative inclusions to bakery, confectionery, dairy, frozen dessert and foodservice manufacturers. The downstream food industry gives suppliers a broad customer base. FoodDrinkEurope reports that the EU food and drink industry generates €1.2 trillion in turnover, creates €250 billion in value added and employs 4.7 million people, supporting steady industrial demand for functional and decorative ingredients.
- USDA data show that total U.S. food expenditure reached USD 2.51 trillion, including USD 1.41 trillion spent on food away from home and USD 1.10 trillion on food at home. This spending base supports innovation in pastries, cakes, doughnuts, desserts, ice cream, breakfast products and premium snacks, where appearance, texture and flavor differentiation influence product positioning.
Key Takeaways
- Fillings and Toppings Market was valued at USD 28.2 Billion, to register a CAGR of 5.5%, reaching about USD 48.1 Billion by 2035.
- Creams held a dominant market position, capturing more than a 35.1% share.
- Bakery Products held a dominant market position, capturing more than a 42.3% share.
- Fruits held a dominant market position, capturing more than a 29.1% share.
- Solid held a dominant market position, capturing more than a 63.8% share.
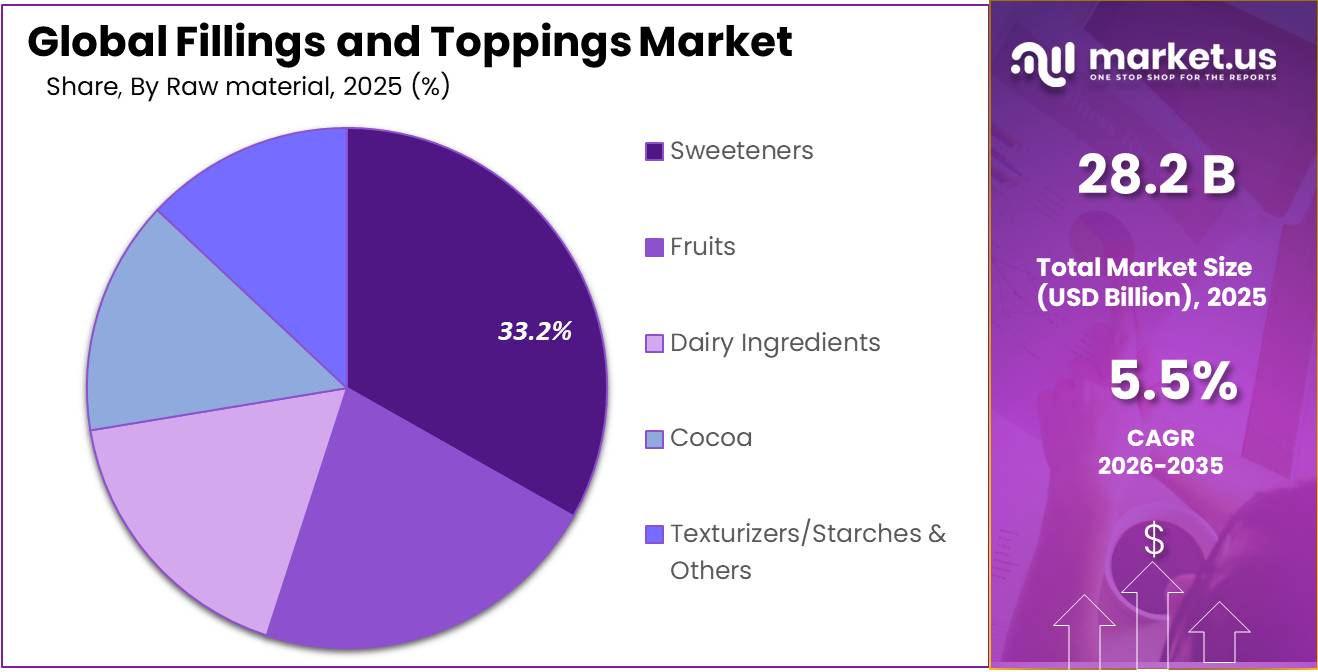
- Sweeteners held a dominant market position, capturing more than a 32.2% share.
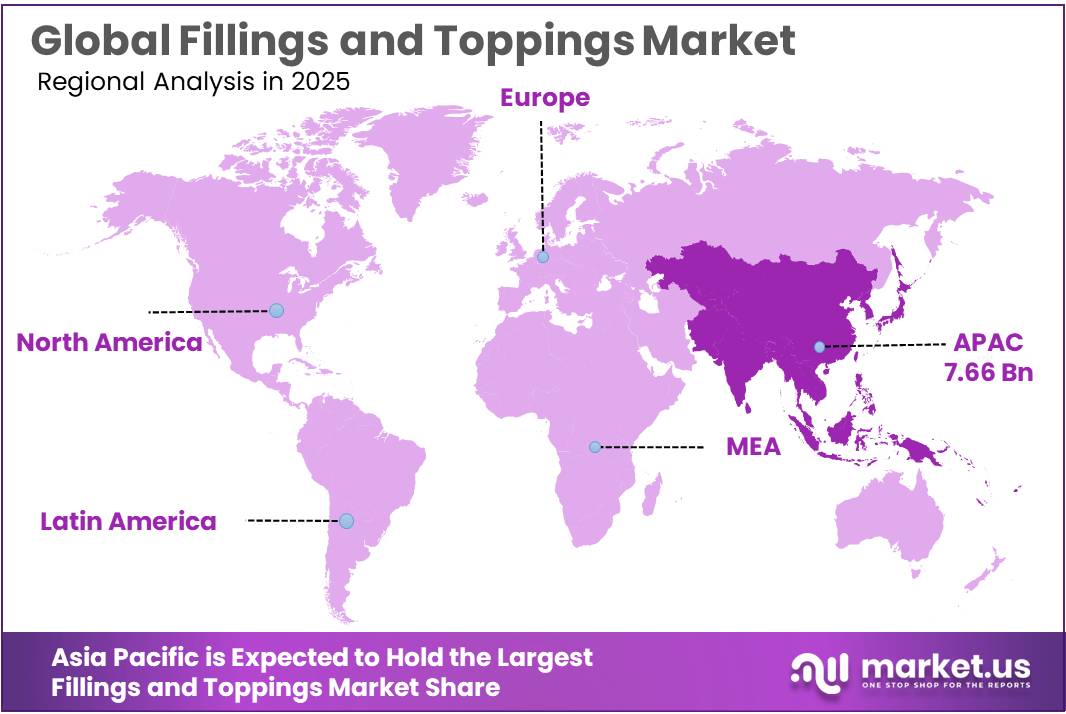
- Asia Pacific held a dominant market position, capturing more than a 27.2% share and generating approximately USD 7.66 billion.
Bakery and confectionery production provides an important industrial platform. A USDA Foreign Agricultural Service assessment of Germany shows bakery products accounting for 9.5% of the country’s food-processing industry, while confectionery represented 7.9%. The same assessment indicates that about 35% of German food and beverage products are exported. These figures highlight demand for scalable, shelf-stable fillings and toppings that perform consistently through baking, freezing, transport and retail distribution.
- Raw-material volatility remains a major operating issue, especially for cocoa-based toppings. The International Cocoa Organization estimates world cocoa production at 4.698 million tonnes and grindings at 4.602 million tonnes, with the latest season moving to a 49,000-tonne surplus after the previous deficit. Such shifts can affect cocoa butter, powder and chocolate costs, encouraging manufacturers to improve recipe efficiency, diversify flavor systems and develop compound, nut, caramel and fruit-based alternatives.
Health-focused reformulation is another major driver. The World Health Organization recommends that free sugars remain below 10% of total energy intake and suggests a further reduction below 5%, equivalent to roughly 25 grams per day for additional health benefits. This creates room for reduced-sugar fillings, fruit-forward preparations, fiber-enriched systems, smaller indulgent inclusions and formulations that improve sweetness perception without relying only on higher sugar content.
Future opportunities are increasingly linked with clean-label colors, natural ingredients, premium textures and regulation-ready formulations. The FDA has encouraged manufacturers to phase out FD&C Red No. 3 before January 15, 2027, while a Consumer Brands Association pledge targets removal of certified petroleum-based FD&C colors from manufacturing by December 31, 2027.
By Type Analysis
Creams dominate the Fillings and Toppings Market with a 35.1% share, supported by their smooth texture and wide bakery use.
In 2025, Creams held a dominant market position, capturing more than a 35.1% share. Cream-based fillings and toppings remain widely used across cakes, pastries, doughnuts, desserts, and other bakery products because they provide a smooth texture, rich taste, and consistent appearance. Manufacturers also prefer creams because they can be adapted to different flavours and product formats while maintaining a soft and appealing mouthfeel.
- In 2025, USDA data showed California utilized shelled almond production at 2.715 billion pounds, while utilized grape production reached 4.67 million tons. Washington also recorded 7.163 billion pounds of utilized apples, highlighting the sizeable supply base available for processed fruit ingredients.
Fruits & Nuts hold an important position in the Fillings and Toppings Market because they provide natural flavour, texture, colour, and visible ingredient appeal in bakery and confectionery products.
By Application Analysis
Bakery Products dominate the Fillings and Toppings Market with a 42.3% share, supported by their extensive use of creams, fruits, chocolate, and other fillings.
In 2025, Bakery Products held a dominant market position, capturing more than a 42.3% share. Bakery products remain the leading application because fillings and toppings are widely used in cakes, pastries, doughnuts, breads, muffins, cookies, and other baked foods to improve taste, texture, appearance, and product differentiation. The segment also benefits from frequent product launches featuring flavoured creams, fruit preparations, chocolate layers, glazes, and decorative toppings.
- According to the U.S. Department of Agriculture Foreign Agricultural Service, U.S. confectionery exports reached USD 853.2 million in 2025, with total export volume reaching 167,485 metric tons. The European Commission also reported that confectionery and chocolate exports increased by 21% during the first quarter of 2025, reflecting strong international demand for value-added confectionery products.
Confectionery Products represent an important application in the Fillings and Toppings Market because manufacturers regularly use chocolate, caramel, creams, fruit preparations, nuts, and flavoured centres in candies, pralines, bars, and other confectionery items.
By Flavor Analysis
Fruits lead the Fillings and Toppings Market with a 29.1% share, driven by their fresh taste, natural appeal, and wide use across bakery products.
In 2025, Fruits held a dominant market position, capturing more than a 29.1% share. Fruit flavors remain highly preferred in fillings and toppings because they provide natural sweetness, color, freshness, and a familiar taste across cakes, pastries, pies, doughnuts, yogurts, and confectionery products. The segment benefits from the wide commercial availability of apples, strawberries, berries, citrus fruits, and other processed fruit ingredients.
- USDA data for 2025 show that Washington recorded 7.163 billion pounds of utilized apples, while California recorded 27.64 million CWT of utilized strawberries, indicating a strong raw-material base for fruit-based food processing.
Chocolate holds a strong position in the Fillings and Toppings Market because it is widely used in cakes, cookies, pastries, doughnuts, desserts, confectionery centers, and coated products. Manufacturers favor chocolate because it works well with cream, caramel, nuts, and fruit while supporting both mass-market and premium food products.
- In 2025, the U.S. Department of Agriculture reported that U.S. chocolate and cocoa product exports reached approximately USD 2.7 billion, reflecting the sizeable commercial activity surrounding chocolate-based products. This established production and trade base continues to support demand for chocolate-flavored fillings and toppings across processed food applications.
By Form Analysis
Solid dominates the Fillings and Toppings Market with a 63.8% share, supported by easy handling, stable texture, and broad use in bakery and confectionery products.
In 2025, Solid held a dominant market position, capturing more than a 63.8% share. Solid fillings and toppings are widely preferred for cakes, pastries, cookies, chocolates, doughnuts, and confectionery because they offer better portion control, stable texture, and convenient handling during industrial food production. Ingredients such as fruit pieces, nuts, chocolate chips, confectionery inclusions, and solid decorative toppings also help manufacturers create visible texture and premium product appeal.
- USDA data released in June 2026 reported U.S. maple syrup production of 5.877 million gallons in 2026, with an average yield of 0.357 gallons per tap. These figures demonstrate the sizable production base for a well-established liquid topping ingredient and support continued commercial use of syrup-based formulations across bakery, breakfast, dessert, and confectionery products.
Liquid forms maintain an important position in the Fillings and Toppings Market due to their easy pouring, coating, blending, and dispensing properties. They are commonly used as syrups, dessert sauces, fruit preparations, chocolate sauces, and bakery glazes, allowing manufacturers to achieve uniform coverage and consistent flavour.
By Raw material Analysis
Sweeteners dominate the Fillings and Toppings Market with a 32.2% share, supported by their essential role in taste, texture, and product consistency.
In 2025, Sweeteners held a dominant market position, capturing more than a 32.2% share. Sweeteners remain an important raw material because they provide sweetness, improve texture, balance acidity, and help manufacturers achieve consistent flavour in bakery fillings, confectionery centres, creams, fruit preparations, and dessert toppings.
- In 2026, the U.S. Department of Agriculture projected beet sugar production at 5.102 million short tons, raw value, while sugar deliveries for human consumption were forecast at 12.441 million short tons, raw value. This large supply and consumption base supports the continued availability of sugar-based ingredients for industrial fillings and toppings.
Fruits hold a strong position in the Fillings and Toppings Market because they provide natural flavour, colour, texture, and recognizable ingredients across pies, cakes, pastries, doughnuts, yogurts, and confectionery products.
- USDA data for 2025 show that Washington recorded 7.163 billion pounds of utilized apples, including 1.508 billion pounds directed to processing, with processed apple production valued at about USD 131.95 million. These processing volumes provide a sizeable raw-material base for fruit purees, preserves, pie fillings, bakery layers, and other value-added topping applications.
Key Market Segments
By Type
- Creams
- Fruits & Nuts
- Pastes & Variegates
- Syrups
- Fondants
- Sprinkles / Others
By Application
- Bakery Products
- Confectionery Products
- Dairy & Frozen Desserts
By Flavor
- Fruits
- Chocolate
- Vanilla
- Caramel
- Others
By Form
- Solid
- Liquid
- Gel
- Foam
By Raw material
- Sweeteners
- Fruits
- Dairy Ingredients
- Cocoa
- Texturizers/Starches & Others
Driver Analysis
Premium bakery, café and dessert occasions
Premiumisation is the largest near-term volume-and-value driver because fillings and toppings are among the most visible sensory components in bakery, frozen dessert and beverage applications, allowing operators to charge for perceived indulgence without redesigning the entire product. U.S. food-away-from-home spending reached $1.41 trillion in 2025, up from $818 billion in inflation-adjusted 1997 dollars, indicating a large addressable base for cafés, quick-service restaurants, in-store bakeries and dessert chains that use sauces, fruit preparations, whipped toppings, creams and inclusions to refresh menus rapidly.
The commercial mechanism is favourable to ingredient suppliers: a base doughnut, croissant, pancake, soft-serve or beverage can be converted into a limited-time or premium SKU through a 10–30 g topping or filling dose, creating higher revenue per serving while preserving operational simplicity. Growth will concentrate in metropolitan APAC, North America, Europe and GCC foodservice corridors, where flavour rotation—pistachio, salted caramel, berry, tropical fruit, coffee, cheesecake and hybrid global flavours—supports frequent menu renovation and smaller production runs.
Drivers Impact Analysis
| Driver | (~) % Impact on CAGR Forecast | Geographic Relevance | Impact Timeline |
|---|---|---|---|
| Premium bakery, café and dessert occasions | +1.2 pp | North America, EU, APAC metros, GCC | Short term (≤ 2 years) |
| Clean-label natural colours and ingredients | +0.9 pp | North America core, EU, Australia, Japan | Short term (≤ 2 years) |
| Reduced-sugar functional formulations | +0.8 pp | EU, North America, Japan, urban APAC | Medium term (2–4 years) |
| Foodservice and QSR dessert menu expansion | +0.7 pp | APAC, North America, GCC, Latin America | Short term (≤ 2 years) |
| Cocoa-cost reformulation and flavour systems | +0.6 pp | Europe, North America, APAC | Medium term (2–4 years) |
| Shelf-stable, sustainable packaging platforms | +0.5 pp | EU core, North America, developed APAC | Long term (≥ 4 years) |
Restraint Analysis
Cocoa and sugar cost volatility
Cocoa and sugar volatility is the most direct constraint on fillings and toppings because chocolate, cocoa-flavoured creams, caramel, sugar syrups, confectionery sauces and bakery inclusions combine high material intensity with limited ability to pass through rapid input-cost changes. World Bank-linked 2026 forecasts indicated cocoa could fall from approximately $7.80/kg in 2025 to around $3.80/kg in 2026, a roughly 51% correction, but this does not restore predictable procurement conditions after multiple years of extreme price movement; abrupt downward corrections can be as commercially disruptive as price spikes because suppliers holding high-cost inventory may face inventory write-downs and customer demands for immediate price concessions.
Sugar and sweets prices in the U.S. are forecast to rise 7.2% in 2026, versus 3.1% for food overall, increasing cost pressure on sweet fillings even where cocoa prices soften. For a chocolate or caramel filling in which cocoa, sugar, fats and dairy solids represent roughly 55–75% of ex-works cost, a 10% net increase in the input basket can compress gross margin by 200–500 basis points if contracts permit only quarterly or semiannual repricing.
Restraint Impact Analysis
| Restraint | (~) % Impact on CAGR Forecast | Geographic Relevance | Impact Timeline |
|---|---|---|---|
| Cocoa and sugar cost volatility | -1.1 pp | EU, North America, APAC | Short term (≤ 2 years) |
| Clean-label reformulation burden | -0.8 pp | North America core, EU | Short term (≤ 2 years) |
| Consumer affordability pressure | -0.7 pp | Europe, North America, Latin America | Medium term (2-4 years) |
| EUDR cocoa traceability costs | -0.6 pp | EU, West Africa supply chain | Medium term (2-4 years) |
| Packaging compliance and conversion | -0.5 pp | EU core, UK, developed APAC | Short term (≤ 2 years) |
| Cold-chain and shelf-life losses | -0.4 pp | APAC corridors, Latin America, MEA | Long term (≥ 4 years) |
Opportunity Analysis
Ambient aseptic format expansion
Fruit and vegetables record the highest global food-loss rate at 25.4%, versus 13.3% across total food production, creating a sizable economic case for converting surplus, cosmetically imperfect or seasonally concentrated fruit into sterilized purées, inclusions and fillings near source rather than transporting fresh produce across long distances.
A processor that shifts a 30–60-day chilled filling to a 9–12-month ambient aseptic platform can potentially reduce distributor spoilage, eliminate a refrigerated warehouse stage, expand delivery radius by 500–1,500 km, and convert infrequent full-truckload ordering into regional distributor replenishment; in analyst scenarios, delivered logistics cost can decline by 5–12% per kilogram despite added aseptic-pack costs.
The white space is strongest in India, Indonesia, Vietnam, the Philippines, Brazil, Mexico, GCC markets and African urban corridors, where demand for bakery, café, dessert and beverage toppings is growing faster than temperature-controlled capacity. Capturing the +1.3 percentage-point upside requires €5–15 million-equivalent investment per medium-scale aseptic processing line, formulation of heat-stable starch-hydrocolloid systems, and local fruit-sourcing partnerships, but can create 3–6 percentage points of EBITDA-margin improvement through lower waste, broader geographic reach and higher asset utilization.
Opportunity Impact Analysis
| Opportunity | (~) % Potential CAGR Upside | Geographic Relevance | Execution Window |
|---|---|---|---|
| Ambient aseptic format expansion | +1.3 pp | APAC emerging, Latin America, MEA | Medium term (2-4 years) |
| Foodservice dispensing-as-a-service | +1.1 pp | North America, EU, APAC metros, GCC | Short term (≤ 2 years) |
| Upcycled fruit side-stream platforms | +0.9 pp | EU, North America, India, Brazil | Medium term (2-4 years) |
| Traceable premium cocoa portfolios | +0.8 pp | EU core, UK, North America, Japan | Short term (≤ 2 years) |
| Natural-colour formulation licensing | +0.7 pp | North America, EU, developed APAC | Medium term (2-4 years) |
| Regional roll-up and co-manufacturing | +0.6 pp | Southeast Asia, GCC, Latin America | Long term (≥ 4 years) |
Challenges Analysis
Multi-origin sourcing volatility
In 2026, the World Bank projected global commodity prices to rise 16%, with energy prices expected to increase 24% and fertilizer prices 31%, while its agriculture price index was forecast to decline 6% because lower beverage prices offset modest food-price gains; this divergence means a supplier may benefit from lower cocoa costs while simultaneously facing higher freight, packaging, irrigation, fertilizer and energy-related conversion costs.
For a mid-sized processor, 60–75% of cost of goods sold can be exposed to ingredients and packaging, so even a 5% quarterly increase in the combined input basket can erase 150–300 basis points of gross margin if customer price lists are reset only every 90–180 days.
The operational response requires dual or triple sourcing for high-risk materials, rolling 6–12-month coverage, formulation equivalency files, approved alternate specifications and inventory buffers equivalent to 30–60 days of critical inputs; however, each added source raises audit, sensory-matching and minimum-order complexity. The resulting -0.8 percentage-point CAGR friction is most pronounced in Europe, North America and APAC import-dependent processors, where procurement organizations must prioritize variance control and supply assurance over nominal spot-price optimization.
Challenges Impact Analysis
| Challenge | (~) % CAGR Friction Drag | Geographic Relevance | Mitigation Horizon |
|---|---|---|---|
| Multi-origin sourcing volatility | -0.8 pp | EU, North America, APAC import lanes | Medium term (2-4 years) |
| Cold-chain integrity gaps | -0.7 pp | APAC, Latin America, MEA | Long term (≥ 4 years) |
| Formulation stability trade-offs | -0.6 pp | Global premium segments | Medium term (2-4 years) |
| Allergen segregation complexity | -0.5 pp | EU, North America, developed APAC | Medium term (2-4 years) |
| Traceability data fragmentation | -0.5 pp | North America, EU, global suppliers | Medium term (2-4 years) |
| Freight-route disruption exposure | -0.4 pp | Asia–EU, India–EU, GCC–EU | Short term (≤ 2 years) |
Regional Insights
Asia Pacific – Dominating Region: 27.2% Share | USD 7.66 Billion
In 2025, Asia Pacific held a dominant market position, capturing more than a 27.2% share and generating approximately USD 7.66 billion in the Fillings and Toppings Market. The region benefits from large-scale bakery, confectionery, dairy, dessert, and foodservice consumption, particularly across China, Japan, South Korea, Australia, and Southeast Asia. China’s catering industry generated CNY 5,798.2 billion in 2025, increasing 3.2% year over year, according to the National Bureau of Statistics. This expanding foodservice base supports demand for chocolate toppings, fruit fillings, creams, glazes, syrups, and bakery decorations.
- China’s catering revenue reached CNY 2,825.5 billion, representing growth of 2.8% from the previous year. Australia also recorded improving food-manufacturing conditions, with food product manufacturing earnings rising 7.8%, or approximately AUD 815 million, during 2024–25. Rising urban foodservice activity, premium bakery consumption, convenient desserts, café culture, and demand for visually attractive confectionery products are encouraging producers to expand fruit-based, chocolate, nut, caramel, and reduced-sugar filling portfolios across the region.
North America is positioned as the fastest-growing regional market, supported by strong bakery, dessert, snack, and food-away-from-home expenditure. U.S. food spending reached USD 2.51 trillion in 2025, including USD 1.41 trillion spent on food away from home, creating significant demand for toppings and fillings used by restaurants, bakeries, cafés, and dessert chains.
Key Regions and Countries Insights
- North America
- US
- Canada
- Europe
- Germany
- France
- The UK
- Spain
- Italy
- Rest of Europe
- Asia Pacific
- China
- Japan
- South Korea
- India
- Australia
- Rest of APAC
- Latin America
- Brazil
- Mexico
- Rest of Latin America
- Middle East & Africa
- GCC
- South Africa
- Rest of MEA
Key Players Analysis
Barry Callebaut AG remains a major supplier to the fillings and toppings industry through chocolate, cocoa powders, cocoa butter, compounds, decorations, and bakery solutions. In the first 9 months of fiscal 2025/26, the group sold 1,557,239 tonnes, while sales revenue reached CHF 9.56 billion. Group volume declined 2.8%, although third-quarter volume returned to 5.7% growth. Global Cocoa volume improved 18.0% in the third quarter, indicating recovering demand for cocoa-based ingredients across bakery, confectionery, and dessert applications.
Cargill, Incorporated supports the fillings and toppings market through cocoa, chocolate, sweeteners, starches, oils, and texture solutions supplied to food manufacturers and foodservice customers. In fiscal 2026, the company generated USD 164 billion in revenue. Its global network includes more than 155,000 employees, operations in 70 countries, around 1,000 locations, and 1,200 scientists and innovators. This broad ingredient and R&D platform strengthens Cargill’s ability to develop reduced-sugar, functional, premium, and application-specific solutions for bakery, confectionery, dairy, and dessert producers.
Archer Daniels Midland Company (ADM) participates in the fillings and toppings value chain through sweeteners, starches, edible oils, flavors, colors, and nutrition ingredients. In the first quarter of 2026, ADM’s Nutrition segment delivered USD 135 million in operating profit, rising 42% year over year, while Human Nutrition profit increased 39%. Its Starches and Sweeteners subsegment generated USD 229 million in operating profit, up 11%. These capabilities support customized fillings, coatings, creams, sauces, and toppings requiring sweetness, texture, stability, and flavor performance.
Top Key Players Outlook
- Barry Callebaut AG
- Cargill, Incorporated
- Archer Daniels Midland Company (ADM)
- Tate & Lyle PLC
- Kerry Group plc
- AAK AB
- Ingredion Incorporated
- Puratos Group NV
- Dawn Food Products, Inc.
- CSM Ingredients
- AGRANA Beteiligungs-AG
- Zentis GmbH & Co. KG
- Associated British Foods plc
- Sensient Technologies Corporation
- PreGel S.p.A.
Recent Developments
- In February 2026, Kerry opened a Customer Co-Creation Centre in Medellín with dedicated Bakery & Confectionery laboratories; the company reported a global footprint of 124 production plants and more than 70 technology and innovation centres. Kerry also reported €6.758 billion revenue, €1.208 billion EBITDA and 3.0% volume growth for 2025.
- In June 2026, Ingredion announced a recommended all-cash acquisition of Tate & Lyle valued at approximately GBP 3.7 billion, or USD 5.0 billion, which would significantly strengthen its capabilities in mouthfeel, sweetening and fortification.
Report Scope
| Report Features | Description |
|---|---|
| Market Value (2025) | USD 28.2 Bn |
| Forecast Revenue (2035) | USD 48.1 Bn |
| CAGR (2026-2035) | 5.5% |
| Base Year for Estimation | 2025 |
| Historic Period | 2020-2024 |
| Forecast Period | 2026-2035 |
| Report Coverage | Revenue Forecast, Market Dynamics, Competitive Landscape, Recent Developments |
| Segments Covered | By Type (Creams, Fruits & Nuts, Pastes & Variegates, Syrups, Fondants, Sprinkles / Others), By Application (Bakery Products, Confectionery Products, Dairy & Frozen Desserts), By Flavor (Fruits, Chocolate, Vanilla, Caramel, Others), By Form (Solid, Liquid, Gel, Foam), By Raw material (Sweeteners, Fruits, Dairy Ingredients, Cocoa, Texturizers/Starches & Others) |
| Regional Analysis | North America – US, Canada; Europe – Germany, France, The UK, Spain, Italy, Rest of Europe; Asia Pacific – China, Japan, South Korea, India, Australia, Singapore, Rest of APAC; Latin America – Brazil, Mexico, Rest of Latin America; Middle East & Africa – GCC, South Africa, Rest of MEA |
| Competitive Landscape | Barry Callebaut AG, Cargill, Incorporated, Archer Daniels Midland Company (ADM), Tate & Lyle PLC, Kerry Group plc, AAK AB, Ingredion Incorporated, Puratos Group NV, Dawn Food Products, Inc., CSM Ingredients, AGRANA Beteiligungs-AG, Zentis GmbH & Co. KG, Associated British Foods plc, Sensient Technologies Corporation, PreGel S.p.A. |
| Customization Scope | Customization for segments, region/country-level will be provided. Moreover, additional customization can be done based on the requirements. |
| Purchase Options | We have three licenses to opt for: Single User License, Multi-User License (Up to 5 Users), Corporate Use License (Unlimited User and Printable PDF) |





































