


Report Overview
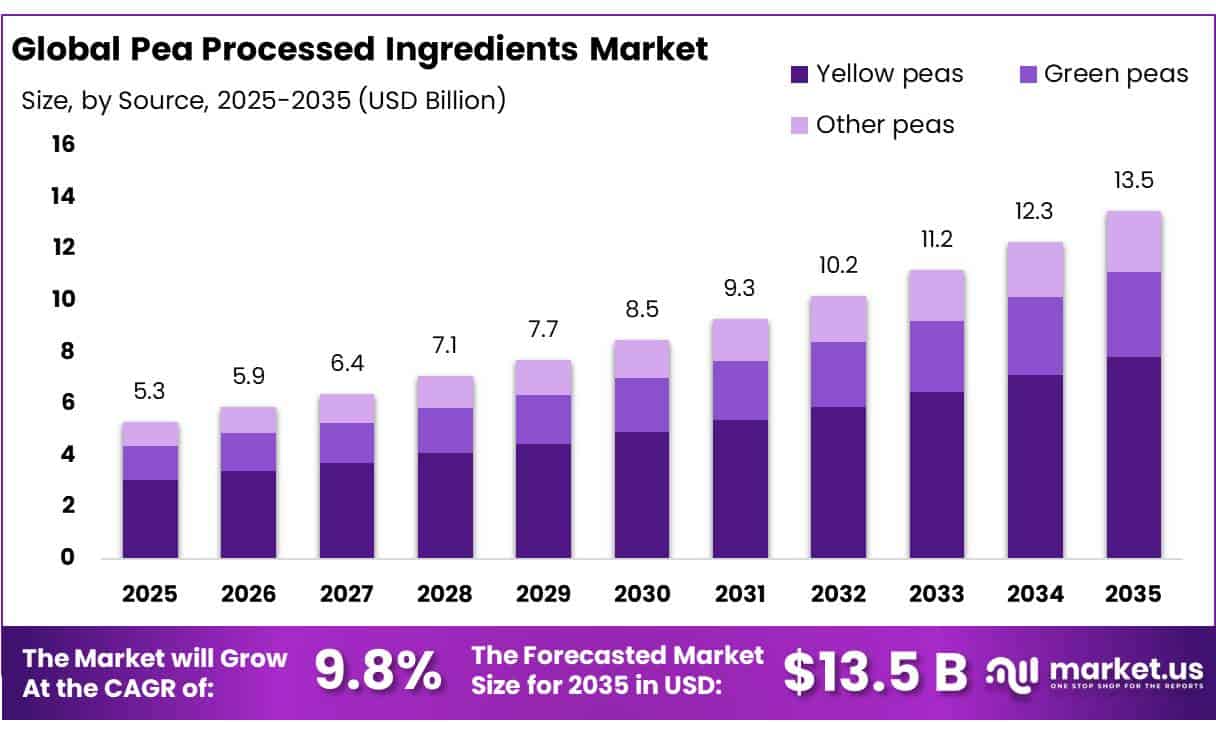
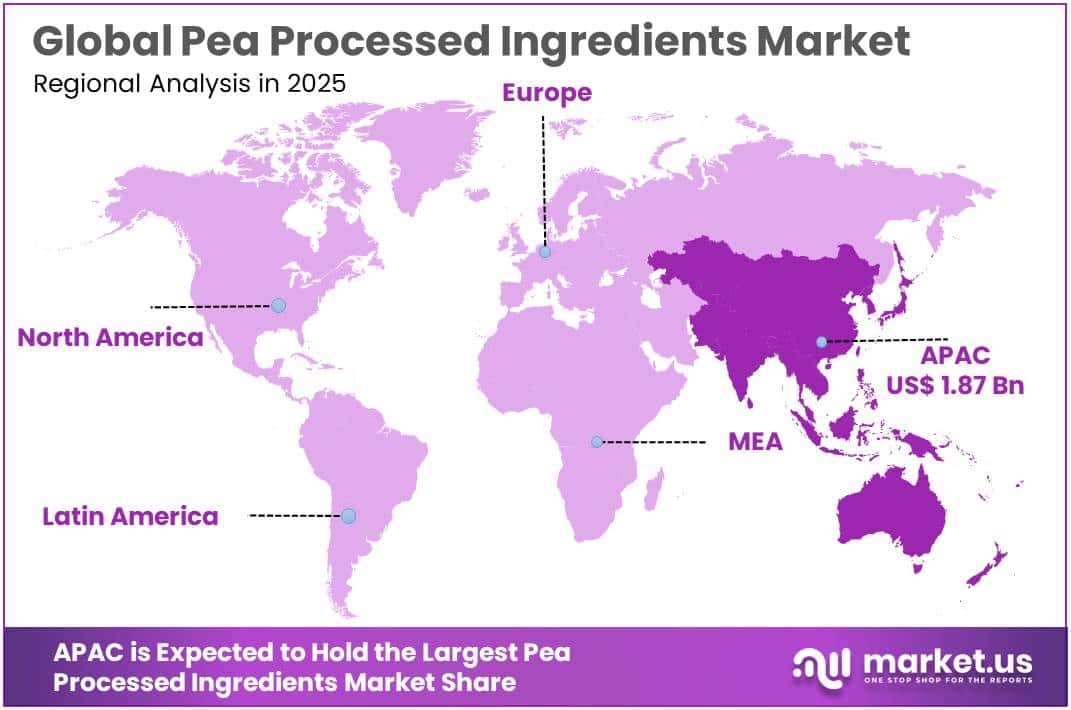
The Global Pea Processed Ingredients Market size is expected to be worth around USD 13.5 Billion by 2035, from USD 5.3 Billion in 2025, growing at a CAGR of 9.8% during the forecast period from 2026 to 2035. In 2025, Asia Pacific held a dominant market position, capturing more than a 35.0% share, holding USD 1.87 Billion revenue.
The pea processed ingredients industry is developing from a basic pulse-milling activity into a higher-value ingredient platform supplying food, nutrition and feed manufacturers. Key products include pea protein concentrates and isolates, pea starch, flour, fibre and processing co-products.
- Canada remains one of the strongest raw-material bases: for 2025–26, dry pea production reached 3.934 million tonnes, total supply reached 4.436 million tonnes, and domestic use was 746,000 tonnes. This availability supports large-scale fractionation plants and helps processors maintain consistent sourcing.
Key Takeaways
- Pea Processed Ingredients Market size is expected to be worth around USD 13.5 Billion by 2035, from USD 5.3 Billion in 2025, growing at a CAGR of 9.8%.
- Pea starch held a dominant market position, capturing more than a 32.88% share.
- Yellow peas held a dominant market position, capturing more than a 57.96% share.
- Dry held a dominant market position, capturing more than a 90.00% share.
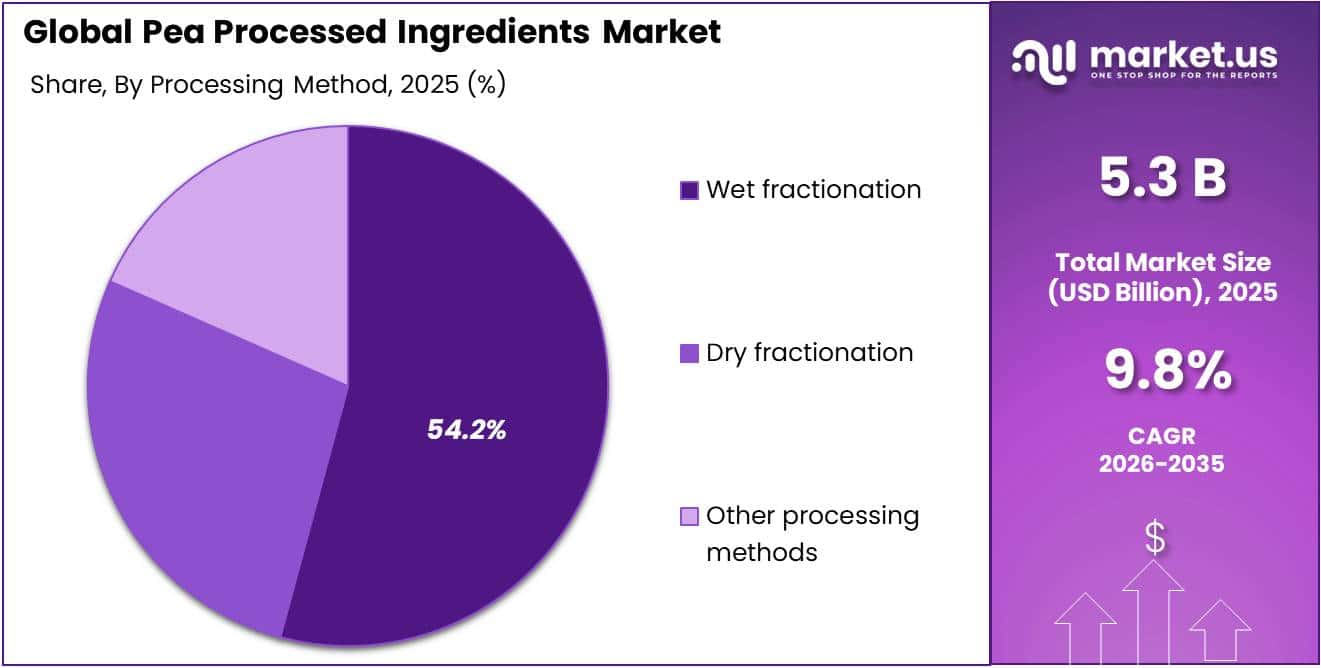
- Wet fractionation held a dominant market position, capturing more than a 54.00% share.
- Food and beverages held a dominant market position, capturing more than a 77.51% share.
- Asia Pacific held the dominant position in the Pea Processed Ingredients Market in 2025, capturing more than a 35.00% share and generating around USD 1.87 billion.
The United States is also strengthening the upstream supply base. USDA estimated 2025 dry pea production at 20.6 million cwt, representing a 23% increase, while planted area rose to 1.18 million acres. A larger crop improves access to yellow peas for protein, starch and flour processors and can support more stable utilization rates at processing facilities. For ingredient producers, broader North American supply also lowers dependence on a single growing region and supports local sourcing strategies.
Industrial investment shows how the sector is moving toward advanced, resource-efficient fractionation. Roquette’s Portage la Prairie pea protein facility can process 125,000 tons of yellow peas annually, occupies around 20,000 square metres, and recycles 30% of the water used during production. Such plants convert peas into several functional ingredients rather than one commodity output, improving value capture. Future competitiveness will increasingly depend on protein purity, neutral taste, solubility, texture, traceability and lower water and energy intensity.
- The European Commission reports that 74% of high-protein feed inputs are imported, while only 25.8% of protein from oilseeds and protein crops used in feed is currently produced within the EU. Its Protein Action Plan aims to lift that domestic share to 35% by 2035. This creates opportunities for peas as a locally produced protein crop and encourages investment in storage, processing infrastructure, contracting and regional ingredient value chains.
Innovation opportunities extend beyond protein isolate. Canada’s National Research Council states that plant-based protein could contribute more than CAD 4.5 billion to national GDP growth over the next 10 years, while the Canadian Food Inspection Agency evaluated 2 new pea-processing-residue feed ingredient descriptions. These developments highlight a move toward full-crop utilization, where starch, fibre, soluble protein streams and processing residues can be converted into food, feed and industrial inputs instead of becoming low-value waste.
The future growth path will therefore depend on efficient raw-material contracting, better fractionation technology and wider application development. Agriculture and Agri-Food Canada expects Canadian dry pea exports of 2.7 million tonnes in 2025–26, carry-out stocks of 990,000 tonnes and an average producer price near CAD 300 per tonne. This combination of abundant supply and competitive feedstock economics can encourage processors to expand value-added conversion, particularly for high-protein beverages, bakery products, nutrition foods, meat and dairy alternatives, pet food and specialty feed applications.
By Type Analysis
Pea starch leads the market with a 32.88% share, supported by its wide use as a thickener, binder and texture-improving ingredient.
In 2025, Pea starch held a dominant market position, capturing more than a 32.88% share. Its strong position is supported by its functional use in soups, sauces, bakery products, noodles, snacks and processed foods, where it improves viscosity, binding and texture. A strong pea supply base also supports commercial starch processing.
- Agriculture and Agri-Food Canada reported that Canadian dry pea production reached 3.934 million tonnes in 2025–26, while total dry pea supply stood at 4.436 million tonnes. Higher availability of peas gives processors a larger feedstock base for separating starch alongside protein and fibre, supporting efficient utilization of the whole pea.
Pea protein continues to gain importance in the pea processed ingredients market because it provides useful emulsifying, water-binding and nutritional properties for beverages, nutrition products, bakery foods, meat alternatives and animal feed. Government programs are also encouraging greater processing of pulse-based proteins.
In 2026, the European Commission reported that the EU produced about 67 million tonnes of plant-based protein from arable and fodder crops but used around 80 million tonnes across food, feed and industrial applications. The Commission also stated that only 25% of protein from oilseeds and protein crops used in the EU was sourced domestically in 2025, highlighting the need for additional local protein crops such as peas and greater processing capacity.
By Source Analysis
Yellow peas dominate the market with a 57.96% share, supported by strong supply and broad processing suitability.
In 2025, Yellow peas held a dominant market position, capturing more than a 57.96% share. Yellow peas are widely preferred for processed ingredients because their mild flavour, light colour and strong starch and protein content make them suitable for pea flour, starch, protein concentrates and isolates.
- In 2025–26, Canada produced 3.934 million tonnes of dry peas, while total dry pea supply reached 4.436 million tonnes, giving ingredient processors a large raw-material base. The strong supply supports continuous processing and improves the availability of yellow peas for value-added food and nutrition applications.
Green peas hold an important position in the pea processed ingredients market and are mainly used in flour, protein, fibre and specialty food formulations where their natural colour and characteristic pea flavour are desirable. Government data show a clear value difference between the two major dry pea types.
In 2025–26, Agriculture and Agri-Food Canada expected green dry peas to maintain a CAD 90 per tonne premium over yellow dry peas, while Canadian dry pea exports were projected at 2.7 million tonnes and domestic use at 746,000 tonnes. This supply and trade activity provides processors with an established raw-material network for developing both yellow- and green-pea-based ingredients.
By Form Analysis
Dry dominates with a 90.00% share, supported by easier storage, transport and wide use in food processing.
In 2025, Dry held a dominant market position, capturing more than a 90.00% share. Dry pea ingredients, including protein powders, starch, flour and fibre, are widely preferred because they are easier to store, transport, measure and blend into food formulations. They are commonly used in bakery products, snacks, nutrition products, meat alternatives and dry mixes.
- The strong raw-material base also supports large-scale dry ingredient manufacturing. In 2025–26, Canada produced 3.934 million tonnes of dry peas, while total supply reached 4.436 million tonnes and exports were estimated at 2.7 million tonnes.
Liquid pea processed ingredients serve more specialized applications, particularly beverages, nutritional drinks, sauces and other formulations where rapid mixing and uniform dispersion are important. Liquid formats can reduce the additional hydration step required for powders and can help manufacturers develop ready-to-use formulations.
However, their use remains more limited because liquid products generally require more careful handling, transportation and storage than dry ingredients. Government crop statistics do not separately report liquid pea ingredients, although the underlying processing base remains sizeable. In 2025–26, Canadian domestic dry pea use reached 746,000 tonnes, covering food and industrial use, feed, seed and handling-related uses.
By Processing Method Analysis
Wet fractionation dominates with a 54.00% share, supported by its ability to produce highly refined pea protein and starch ingredients.
In 2025, Wet fractionation held a dominant market position, capturing more than a 54.00% share. The method is widely used because soaking, separation, filtration and drying allow processors to recover refined protein, starch and fibre fractions with consistent functional properties. It is particularly suitable for pea protein isolates used in nutritional foods, beverages and plant-based formulations where purity and texture are important.
- In 2025–26, Canada produced 3.934 million tonnes of dry peas, while total supply reached 4.436 million tonnes and domestic use stood at 746,000 tonnes. This strong processing base provides manufacturers with reliable raw material for higher-value fractionation.
Dry fractionation is an important processing method for producing pea protein concentrates, starch-rich fractions and flour through milling and air classification. The process avoids intensive water-based separation, making it suitable for manufacturers focused on simpler production systems and reduced water handling.
USDA reported that U.S. dry pea production reached 20.6 million cwt in 2025, after increasing 23%, while planted area reached 1.18 million acres. Greater raw-material availability can support additional dry-milling and air-classification capacity, particularly for bakery foods, snacks, meat alternatives and blended protein products.
By Application Analysis
Food and beverages dominate with a 77.51% share, supported by the broad use of pea protein, starch, flour and fibre in everyday food products.
In 2025, Food and beverages held a dominant market position, capturing more than a 77.51% share. Pea processed ingredients are widely used in bakery products, snacks, nutritional beverages, meat alternatives, dairy-free foods and ready-to-eat products because they provide protein, binding, thickening and texture benefits. Government production data also show a strong raw-material base for food processors.
- In 2025–26, Canadian dry pea production reached 3.934 million tonnes, while total supply stood at 4.436 million tonnes and domestic use reached 746,000 tonnes. Agriculture and Agri-Food Canada states that domestic use includes food and industrial applications, along with feed and seed uses, showing the sizeable processing base available for value-added pea ingredients.
Animal Nutrition and Pet food represent an important application area for pea protein, pea meal, fibre and other processing fractions because these ingredients can provide protein, energy and functional benefits in formulated feeds. In 2025, the Canadian Food Inspection Agency evaluated 2 new pea-processing-residue feed ingredients, covering dehydrated and wet forms.
The agency stated that these ingredients are intended as sources of protein and dietary energy for swine and cattle, while wet pea-processing residue can contain up to 84% moisture. In addition, Canada’s official Feed Ingredients Table specifies that pea protein concentrate used in livestock feed must contain at least 40% crude protein on a dry-matter basis.
Key Market Segments
By Type
- Pea protein
- Pea starch
- Pea flour
- Pea fibre
- Others
By Source
- Yellow peas
- Green peas
- Other peas
By Form
- Dry
- Liquid
By Processing Method
- Dry fractionation
- Wet fractionation
- Other processing methods
By application
Food and beverages
Animal Nutrition and Pet food
Personal care and cosmetics
Others
Driver Analysis
Plant-Protein Reformulation Demand
This broad regulatory usability increases the commercial addressable market beyond meat analogues: a 1–3% inclusion rate in bakery or beverage fortification, 5–15% in protein snacks and dairy alternatives, and up to 20–30% in powdered nutrition or structured meat-free products creates multiple demand pools rather than dependence on one volatile category.
The business-model impact is a shift from bulk protein concentrate sales toward application-specific grades—high-solubility beverage isolates, high-gel meat-system proteins, emulsifying dairy-alternative ingredients, and neutral-taste protein blends—which can command estimated 15–35% price premiums over undifferentiated pea flour.
This remains a medium-term driver because food companies require 12–24 months of sensory trials, shelf-life validation, co-manufacturer qualification, and label transition before reformulations reach mass volume, but successful incorporation across multiple food formats could add an estimated 1.7 percentage points to baseline CAGR in North America, Europe, and higher-income APAC urban markets.
Drivers Impact Analysis
| Driver | (~) % Impact on CAGR | Geographic Relevance | Impact Timeline |
|---|---|---|---|
| Plant-protein reformulation demand | +1.7% | North America, EU, APAC metros | Medium term (2-4 years) |
| Allergen-aware ingredient substitution | +1.1% | North America core, EU, APAC export markets | Medium term (2-4 years) |
| Dry-fractionation efficiency gains | +1.0% | Canada, EU, China, India | Long term (≥ 4 years) |
| EU protein self-sufficiency policy | +0.9% | EU core, Eastern Europe, UK spill-over | Long term (≥ 4 years) |
| Co-product starch and fiber valorization | +0.8% | North America, EU, APAC processors | Medium term (2-4 years) |
| Pulse oversupply price advantage | +0.7% | Canada, EU, India, Southeast Asia | Short term (≤ 2 years) |
Restraint Analysis
China–India Pulse Tariff Shocks
China subsequently suspended the 100% tariff from 1 March 2026 through 31 December 2026, but the policy relief is temporary rather than structural, and China imposed a separate 73.5% tariff on Canadian pea starch effective 1 July 2026; this directly affects processors that had sought to diversify from raw peas into higher-value ingredient exports.
When Canadian bids reportedly fell to roughly CAD 6.95 per bushel, down about 34% year over year after the tariff sequence, surplus volume risk pushed part of the crop toward lower-value feed channels rather than food-grade processing, limiting the industry’s ability to convert cheap feedstock into predictable high-value ingredients.
This trade-policy volatility can reduce plant-utilization certainty by an estimated 10–20 percentage points in export-oriented facilities and defer greenfield CapEx, supporting a modeled -1.5 percentage-point deduction from baseline CAGR through 2026–2027 across Canada-linked, Chinese, Indian, and global pulse-trade corridors.
Restraint Impact Analysis
| Restraint | (~) % Impact on CAGR | Geographic Relevance | Impact Timeline |
|---|---|---|---|
| China–India pulse tariff shocks | -1.5% | Canada, China, India, global export lanes | Short term (≤ 2 years) |
| Beany flavour and astringency | -1.2% | North America, EU, APAC consumer markets | Medium term (2-4 years) |
| Wet-processing water burden | -0.9% | EU, North America, China, water-stressed APAC | Medium term (2-4 years) |
| Soy and wheat price competition | -0.8% | Global, acute in APAC and Latin America | Short term (≤ 2 years) |
| Pea-protein functionality gap | -0.7% | Beverage, dairy-alternative, meat-alternative markets | Medium term (2-4 years) |
| Emerging legume-allergen scrutiny | -0.5% | EU, UK, North America, premium APAC | Long term (≥ 4 years) |
Opportunity Analysis
High-Acid Beverage Proteins
High-acid ready-to-drink beverages are a major unpenetrated application pool because conventional pea proteins commonly lose solubility, sediment, or destabilize below pH 4.5, limiting their use in fruit-flavoured functional drinks, energy beverages, hydration products, and acidic dairy-alternative formats; most existing pea-protein volume remains concentrated in neutral-pH powders, shakes, bakery, and meat-alternative systems.
A manufacturer able to deliver 75–85% protein isolate with stable viscosity, no grit, and less than 5% sedimentation after 6–9 months could command an estimated 25–45% price premium versus standard food-grade concentrate, while beverage customers gain access to a new protein claim at roughly 10–20 grams per 330–500 mL serving without moving to dairy or soy.
The commercial prize is not merely greater volume but a higher-margin ingredient-plus-application-service model, where suppliers sell pre-validated acid-stable systems, flavour-masking support, and shelf-life testing; capturing even 5–10% of new high-protein RTD launches in North America, the EU, and affluent APAC markets could add approximately 1.5 percentage points above baseline CAGR over 2026–2030.
Opportunity Impact Analysis
| Opportunity | (~) % Potential CAGR Upside | Geographic Relevance | Execution Window |
|---|---|---|---|
| High-acid beverage proteins | +1.5% | North America, EU, APAC urban markets | Medium term (2-4 years) |
| Fermented clean-taste ingredients | +1.3% | North America, EU, Japan, South Korea | Medium term (2-4 years) |
| Clinical and senior nutrition | +1.1% | North America, EU, Japan, China | Long term (≥ 4 years) |
| Full-stream pea biorefineries | +1.0% | Canada, EU, India, China | Medium term (2-4 years) |
| Pet-food protein platforms | +0.8% | North America core, EU, APAC premium markets | Short term (≤ 2 years) |
| Pea-starch biomaterials | +0.7% | EU, North America, India, Southeast Asia | Long term (≥ 4 years) |
Challenges Analysis
Crop-Quality and Cultivar Variability
Separate analysis shows that harvest year and cultivation location significantly affect protein recovery, off-flavour compounds, and functional properties, meaning a beverage-grade isolate produced from one crop origin may not replicate solubility or sensory results when the procurement geography shifts.
This is not a demand barrier but an operating friction: a 2-percentage-point variation in incoming seed protein can change isolate output by roughly 20 kilograms per tonne of peas, while inconsistent colour, bitterness, or foaming may trigger off-spec downgrades, reblending, or customer revalidation that extends product-release cycles by 2–6 weeks.
However, because breeding, grower adoption, and multi-year agronomic validation take four or more years, cultivar and crop-quality inconsistency remains a modeled -1.0 percentage-point drag on attainable growth across Canadian, European, Indian, and Chinese supply chains.
Challenges Impact Analysis
| Challenge | (~) % CAGR Friction Drag | Geographic Relevance | Mitigation Horizon |
|---|---|---|---|
| Crop-quality and cultivar variability | -1.0% | Canada, EU, India, China | Long term (≥ 4 years) |
| Sensory standardization complexity | -0.8% | North America, EU, APAC consumer markets | Medium term (2-4 years) |
| Fractionation scale-up yields | -0.7% | Canada, EU, China, India | Medium term (2-4 years) |
| Skilled process-talent shortage | -0.6% | Canada, North America, EU, APAC hubs | Long term (≥ 4 years) |
| Multi-output demand balancing | -0.5% | Global processing corridors | Medium term (2-4 years) |
| Sustainability proof-data gaps | -0.4% | EU, North America, Japan, South Korea | Medium term (2-4 years) |
Geopolitical Impact Analysis
The ongoing Russia–Ukraine war and wider Middle East shipping tensions are creating indirect pressure on the Pea Processed Ingredients market through higher fertilizer, energy, freight and insurance costs.
FAO reported in March 2026 that Ukraine’s 2025 cereal production was about 5% below the five-year average, while 2025–26 cereal exports were forecast at about 40 million tonnes, 20% lower than the previous year. Although peas are not the main crop affected, weaker Black Sea agricultural logistics can raise input and transport costs across pulse and ingredient supply chains.
At the same time, disruption around the Strait of Hormuz is increasing risk for fertilizer and fuel markets. UNCTAD reported in March 2026 that vessel transits through the Strait had fallen by more than 95%, while oil tanker freight rates had risen by more than 90%. These conditions can increase farming and processing costs for pea protein, starch, flour and fibre producers.
Canada provides supply protection: Agriculture and Agri-Food Canada reported 2025–26 dry pea production of 3.934 million tonnes and exports of 2.7 million tonnes. Strong Canadian supply can reduce raw-material pressure, but prolonged conflict may keep logistics costs volatile and encourage processors to diversify suppliers, build inventories and secure long-term sourcing contracts.
Regional Insights
Asia Pacific Leads the Pea Processed Ingredients Market, While Europe Shows Strong Growth Potential
Asia Pacific held the dominant position in the Pea Processed Ingredients Market in 2025, capturing more than a 35.00% share and generating around USD 1.87 billion. The region benefits from strong demand for pea protein, starch, flour and fibre across processed foods, beverages and nutrition products. China remains an important destination for internationally traded peas.
Agriculture and Agri-Food Canada reported that Canadian dry pea production reached 3.934 million tonnes in 2025–26, while exports reached 2.7 million tonnes. For 2026–27, China and Bangladesh are expected to remain among Canada’s leading dry pea markets. The large flow of peas into Asian food-processing markets provides manufacturers with a reliable raw-material base for protein isolation, starch production and other value-added ingredients. Source: Agriculture and Agri-Food Canada
Europe is expected to be one of the fastest-growing regional markets, supported by policies aimed at increasing locally produced plant proteins and reducing reliance on imported protein ingredients. In July 2026, the European Commission reported that 74% of the EU’s high-protein feed inputs from oilseeds and protein crops were imported.
About 70% of crude protein from cereals, oilseeds and pulses produced and consumed in the EU is used for animal feed. Under its Protein Action Plan, the EU aims to increase the locally produced share of protein from oilseeds and protein crops used in feed from 25.8% to 35% by 2035. These measures are expected to encourage pulse cultivation, processing infrastructure and investment in pea-based proteins, concentrates and feed ingredients. Source: European Commission.
Key Regions and Countries Insights
- North America
- US
- Canada
- Europe
- Germany
- France
- The UK
- Spain
- Italy
- Rest of Europe
- Asia Pacific
- China
- Japan
- South Korea
- India
- Australia
- Rest of APAC
- Latin America
- Brazil
- Mexico
- Rest of Latin America
- Middle East & Africa
- GCC
- South Africa
- Rest of MEA
Key Players Analysis
Roquette Frères is a major plant-based ingredient producer with a strong position in pea protein, starch, fibre and nutrition solutions. In 2025, the company generated €4.9 billion in turnover and operated with more than 11,000 employees. Its global network includes over 40 manufacturing sites and more than 20 R&D and innovation centres. In February 2026, Roquette expanded its pea portfolio with NUTRALYS Pea 850F, strengthening its ability to serve high-protein food, beverage and plant-based formulation customers across global markets.
Ingredion Incorporated is an important supplier of pea proteins and pea starches used across food, beverage and nutrition applications. The company recorded approximately US$7.2 billion in net sales in 2025, served customers in more than 120 countries and employed over 11,000 people. Its VITESSENCE pea protein isolates typically provide 80% to 85% protein on a dry basis. In 2026, Ingredion also highlighted VITESSENCE Pea & Rice 400 N for beverages, high-moisture foods, nutrition products and plant-based yogurt applications worldwide today.
Emsland Group is a Germany-based producer of pea and potato ingredients, supplying starches, proteins, fibres and specialty solutions to food and industrial customers. In 2024/25, the company reported €960 million in turnover, employed around 1,500 people and served customers across 100 countries. It processed about 120,000 tonnes of peas and 2 million tonnes of potatoes. With 7 production sites in Germany, Emsland supports pea ingredient development for food, animal nutrition and technical applications through integrated processing and distribution.
Top Key Players Outlook
- Roquette Frères
- Ingredion Incorporated
- Emsland Group
- Cosucra Groupe Warcoing
- Kerry Group plc
- International Flavors & Fragrances—IFF
- AGT Food and Ingredients Inc.
- PURIS Proteins LLC
- Cargill Incorporated
- dsm-firmenich/Vestkorn Milling
- Archer Daniels Midland—ADM
- Yantai Shuangta Food Co., Ltd.
- Agrocorp International Pte. Ltd.
- Meelunie B.V.
- Axiom Foods, Inc.
Recent Developments
- In May 2026, Cosucra worked with 5 Belgian supplier partners and Jorion Philip-Seeds on yellow-pea field trials covering 22 varieties from 7 breeders, supporting future raw-material selection and crop development.
- In February 2026, Kerry Group plc reported 2025 revenue of €6.758 billion, EBITDA of €1.208 billion, a 17.9% EBITDA margin, and €643 million in free cash flow, giving it substantial resources for continued ingredient innovation and capacity development.
Report Scope
| Report Features | Description |
|---|---|
| Market Value (2025) | USD 5.3 Bn |
| Forecast Revenue (2035) | USD 13.5 Bn |
| CAGR (2026-2035) | 9.8% |
| Base Year for Estimation | 2025 |
| Historic Period | 2020-2024 |
| Forecast Period | 2026-2035 |
| Report Coverage | Revenue Forecast, Market Dynamics, Competitive Landscape, Recent Developments |
| Segments Covered | By Type (Pea protein, Pea starch, Pea flour, Pea fibre, Others), By Source (Yellow peas, Green peas, Other peas), By Form (Dry, Liquid), By Processing Method (Dry fractionation, Wet fractionation, Other processing methods) |
| Regional Analysis | North America – US, Canada; Europe – Germany, France, The UK, Spain, Italy, Rest of Europe; Asia Pacific – China, Japan, South Korea, India, Australia, Singapore, Rest of APAC; Latin America – Brazil, Mexico, Rest of Latin America; Middle East & Africa – GCC, South Africa, Rest of MEA |
| Competitive Landscape | Roquette Frères, Ingredion Incorporated, Emsland Group, Cosucra Groupe Warcoing, Kerry Group plc, International Flavors & Fragrances—IFF, AGT Food and Ingredients Inc., PURIS Proteins LLC, Cargill Incorporated, dsm-firmenich/Vestkorn Milling, Archer Daniels Midland—ADM, Yantai Shuangta Food Co., Ltd., Agrocorp International Pte. Ltd., Meelunie B.V., Axiom Foods, Inc. |
| Customization Scope | Customization for segments, region/country-level will be provided. Moreover, additional customization can be done based on the requirements. |
| Purchase Options | We have three licenses to opt for: Single User License, Multi-User License (Up to 5 Users), Corporate Use License (Unlimited User and Printable PDF) |





































