


Report Overview
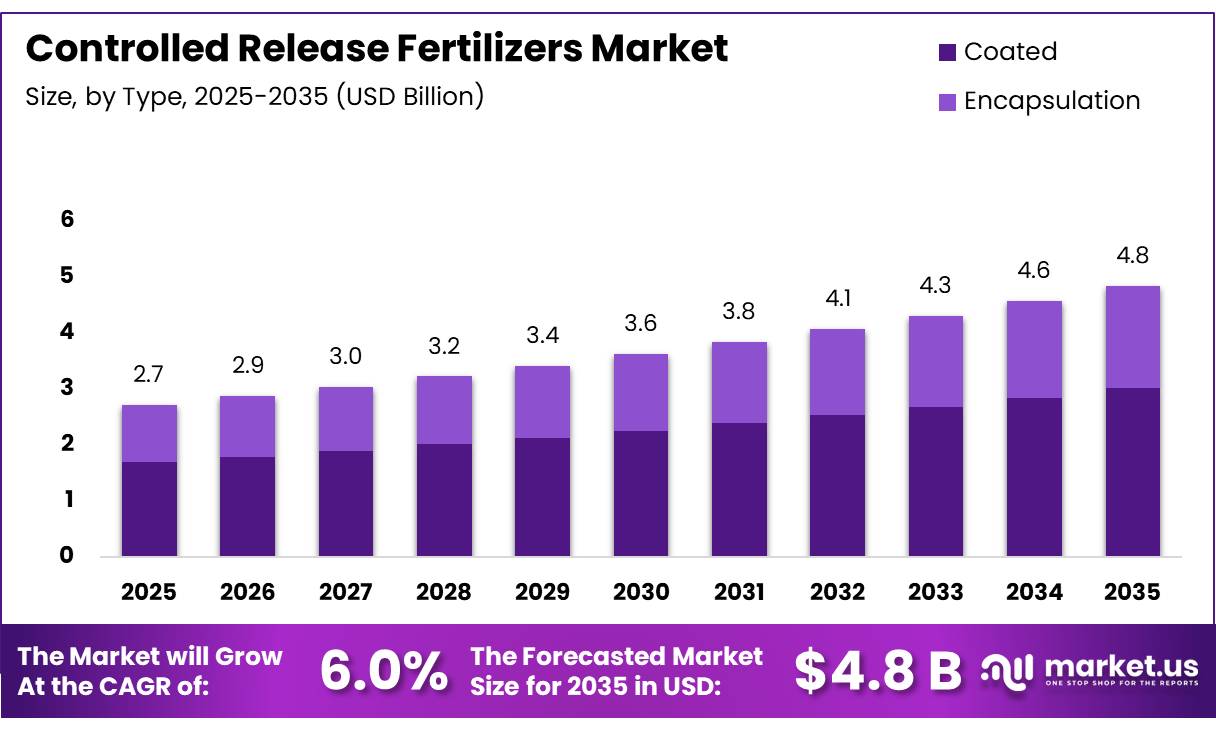
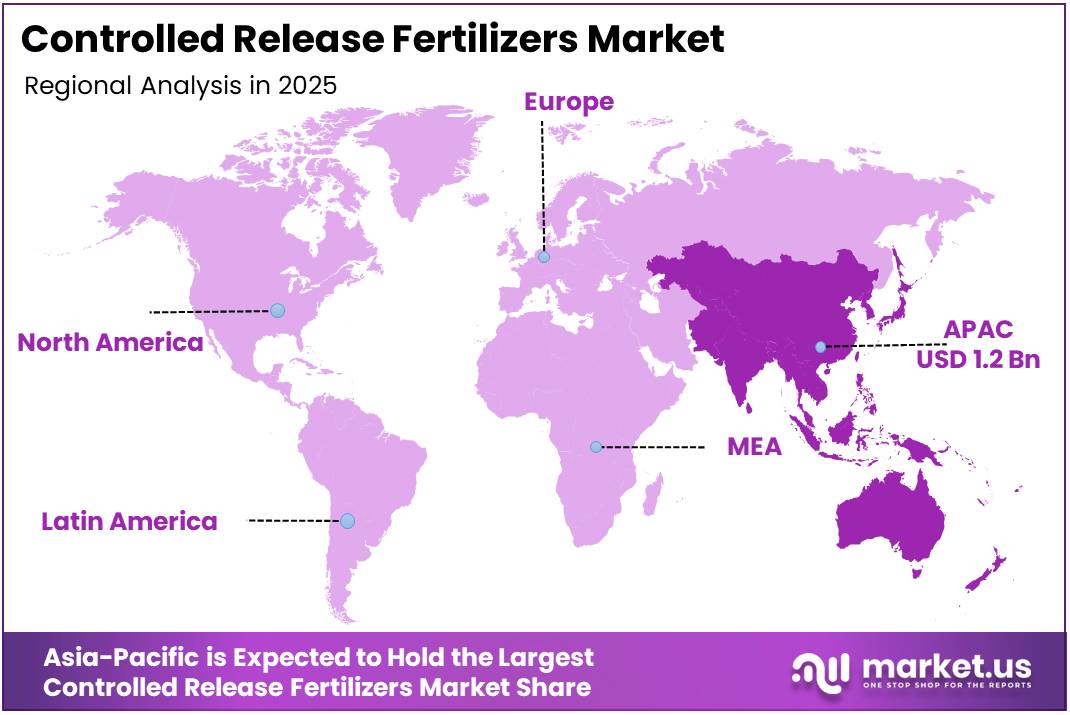
In 2025, the Global Controlled Release Fertilizers Market was valued at USD 2.7 billion, and between 2026 and 2035, this market is estimated to register a CAGR of 6.0%, reaching about USD 4.8 billion by 2035. In 2025, Asia-Pacific led the market, achieving over 43.5% share with a revenue of USD 1.2 billion.
Controlled release fertilizers are advanced plant nutrition products that release nitrogen, phosphorus, potassium, or micronutrients gradually during the crop cycle. Their release pattern is influenced by factors such as soil moisture, temperature, coating material, and coating thickness. Major product categories include sulfur-coated fertilizers, polymer-coated fertilizers, polymer-sulfur combinations, methylene urea, and urea-formaldehyde products. These formulations help maintain nutrient availability for longer periods while limiting losses through leaching, runoff, volatilization, and denitrification.
- According to the International Fertilizer Association’s Medium-Term Fertilizer Outlook 2025–2029, global fertilizer use increased by 4.5% to 198 million tonnes of nutrients in FY2023. IFA projected a further 4.4% increase to approximately 206 million tonnes in FY2024, rather than reporting 206 million tonnes as a finalized figure. The FY2024 estimate comprised approximately 118 million tonnes of nitrogen, 47 million tonnes of phosphate and 41 million tonnes of potash nutrients. Looking ahead, IFA forecast global fertilizer use to reach 224 million tonnes by FY2029, representing an increase of 18 million tonnes, or 9%, from the FY2024 estimate.
- The industrial environment is also being affected by supply disruptions and fertilizer price uncertainty. In June 2026, the Food and Agriculture Organization reported that global fertilizer trade volumes declined by 20% to 25% between January and April 2026 compared with the same period in 2025.
Key Takeaways
- The Global Controlled Release Fertilizers Market was valued at US$2.7 billion in 2025.
- The market is projected to grow at a CAGR of 6.0% and is estimated to reach US$4.8 billion by 2035.
- On the basis of type, Coated fertilizers dominated the market, constituting 62.3% of the total market share.
- Based on the formulation, Dry dominated the market, with a substantial market share of around 86.7%.
- Based on the application, Foliar Application led the market, comprising 53.5% of the total market.
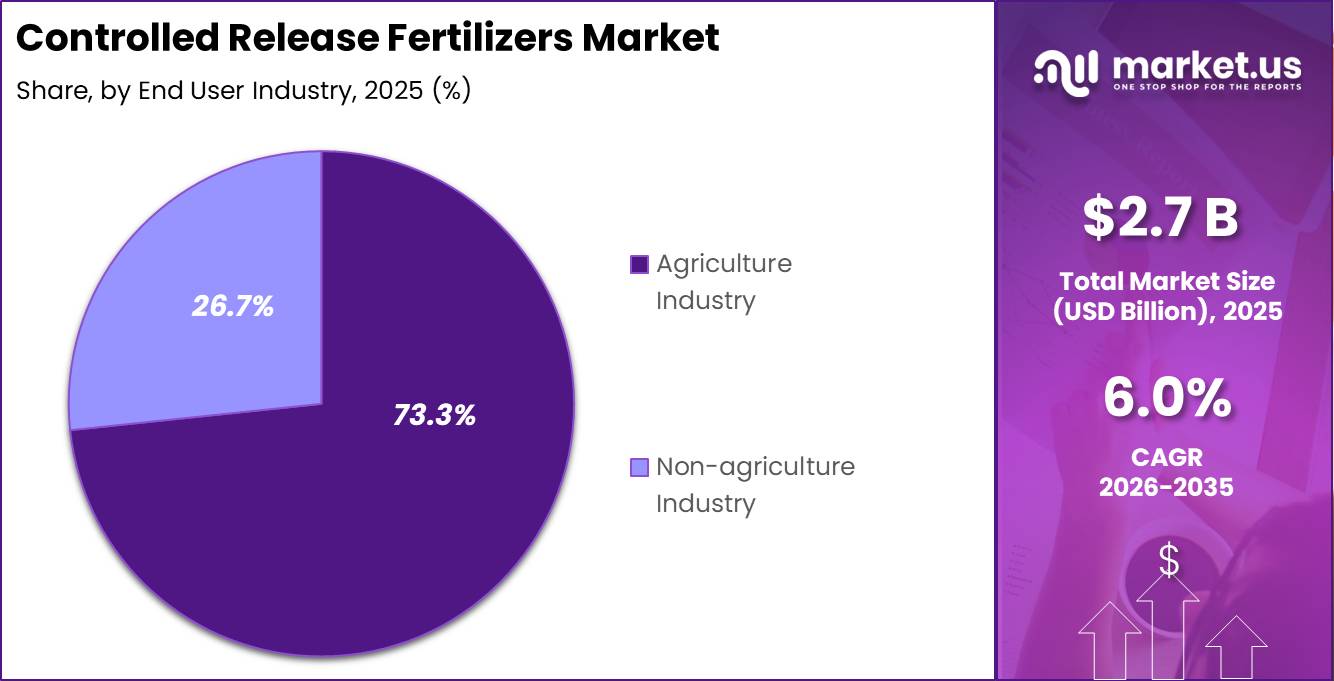
- On the basis of end user industry, Agriculture Industry dominated the market, constituting 73.3% of the total market share.
- In 2025, Asia-Pacific was the most dominant region in the market, accounting for 43.5% of the total global consumption.
Controlled release products can support more disciplined fertilizer planning during unstable supply periods because nutrients remain available for longer. However, higher product prices, specialized coating equipment, raw-material requirements, and crop-specific performance continue to restrict wider adoption.
Government-backed nutrient management programs are strengthening industry acceptance. USDA conservation guidance allows slow-release or controlled release nitrogen formulations to cover at least 50% of pre-plant or post-emergent applications. Enhanced-efficiency fertilizer products may also supply at least 50% of recommended early-season nitrogen requirements under eligible conservation practices. Such programs provide an important pathway for expanding coated urea and other advanced nitrogen products across commercial farming systems.
- In November 2024, the European Commission estimated that 19 Common Agricultural Policy Strategic Plans could provide climate mitigation of up to 31 million tonnes of CO₂ equivalent annually, including 9 million tonnes from emission reductions and 22 million tonnes from additional carbon sequestration.
The Commission also stated that measures covering 35% of EU farmland are expected to support carbon sequestration and reductions in nitrous oxide emissions. This policy direction creates opportunities for controlled release fertilizers and other nutrient-efficiency technologies that can reduce excess nitrogen availability in agricultural soils. Future opportunities are expected in biodegradable coatings, low-microplastic formulations, precision farming, greenhouse cultivation, horticulture, turf management, and high-value crops. The European Commission’s Fertiliser Action Plan, adopted on 19 May 2026, supports nutrient efficiency, low-carbon fertilizers, nutrient recovery, microbial solutions, and greater market transparency.
Type Analysis
Coated fertilizers lead with a 62.3% share due to dependable nutrient release
In 2025, Coated type held a dominant market position, capturing more than a 62.3% share. The coated type remained widely preferred because its sulfur, polymer, or resin layer controls the movement of nutrients into the soil. This helps match nutrient availability with crop growth, limits early nutrient loss and reduces repeated fertilizer applications. Large-scale crop production also supports demand for reliable nutrient-delivery products.
- In March 2025, the USDA Agricultural Research Service published results from a three-year corn study comparing conventional urea with polymer-coated urea applied at 202 kilograms of nitrogen per hectare. Polymer-coated urea reduced combined nitrate, nitrous oxide and ammonia losses by 47% to 49%, lowering total nitrogen loss to 14.4 kilograms per hectare, compared with 28.5 kilograms per hectare for conventional urea. It also produced an average corn yield of 11.1 metric tons per hectare, compared with 10.1 metric tons per hectare for conventional urea.
Encapsulation is the fastest-growing segment. In 2025, the segment gained attention as fertilizer producers increased the use of protective capsules and biodegradable carrier materials that release nutrients gradually after contact with soil moisture. Encapsulation can provide better control over nutrient-release timing while protecting fertilizer ingredients during storage and application.
Formulation Analysis
Dry formulation dominates with an 86.7% share due to easy handling and broad field use
In 2025, dry formulation held a dominant market position, capturing more than an 86.7% share. Dry controlled-release fertilizers are widely preferred because coated granules are easy to store, transport and apply through conventional spreading equipment. Government data also reflects the strong base for solid fertilizer use.
- In 2025, the UK Department for Environment, Food and Rural Affairs reported that urease-inhibited products represented 36% of solid urea use across Great Britain on a weighted-area basis. This indicates that farmers are increasingly adopting treated dry fertilizer products designed to slow nitrogen losses, improve nutrient-use efficiency and support more controlled nutrient availability after application.
Liquid formulation is the fastest-growing segment. In 2025, its adoption was supported by the expansion of fertigation, greenhouse cultivation and automated nutrient-dosing systems. Liquid controlled-release products allow growers to deliver nutrients through irrigation networks and adjust feeding according to crop development. This formulation is especially suitable for nurseries, protected crops and other intensive production systems where uniform application is important.
Application Analysis
Foliar Application dominates with a 53.5% share through direct and measured nutrient delivery
In 2025, Foliar Application held a dominant market position, capturing more than a 53.5% share. Its strong position was supported by the ability to deliver soluble nutrients directly onto plant leaves, allowing deficiencies to be corrected faster than through conventional soil treatment.
- In July 2025, the Florida Department of Environmental Protection stated that foliar feeding generally uses around 1/8 pound of nitrogen or iron per 1,000 square feet, applied with nearly 1/2 gallon of spray solution per 1,000 square feet. The department also noted that increasing spray volume to 3 to 5 gallons per 1,000 square feet can wash fertilizer from the leaves.
Fertigation is the fastest-growing segment in the controlled release fertilizers market. The method distributes fertilizer through irrigation lines, enabling growers to deliver frequent and lighter nutrient applications directly into the soil. In July 2025, the Florida Department of Environmental Protection identified fertigation as a best management practice because it can reduce nutrient-leaching risks and lower the labor required for repeated granular fertilizer applications.
End User Industry Analysis
Agriculture Industry dominates the Controlled Release Fertilizers Market with a 73.3% share
In 2025, Agriculture Industry held a dominant market position, capturing more than a 73.3% share. Controlled-release fertilizers are widely used in crop production because their coatings regulate nutrient release and help match nitrogen availability with plant uptake. Under its fiscal 2025 nutrient-management guidance, the USDA Natural Resources Conservation Service specified the use of slow-release or controlled-release nitrogen fertilizers for at least 50% of pre-plant or post-emergent applications.
- In January 2026, USDA Agricultural Research Service researchers evaluated 11 enhanced-efficiency fertilizers against 2 conventional fertilizers across 2 soil types. The study found that 6 enhanced-efficiency products performed well when ammonia volatilization and nitrogen leaching were considered together, including 4 polymer-coated fertilizers.
Non-agriculture Industry is the fastest growing segment. Controlled-release fertilizers are increasingly used across lawns, golf courses, sports fields, ornamental plants, public parks, and professional landscaping. These products provide gradual nutrient feeding, helping users reduce repeated applications and maintain consistent turf and plant growth.
Key Market Segments
By Type
- Coated
- Encapsulation
By Formulation
- Dry
- Liquid
By Application
- Foliar Application
- Fertigation
- Others
By End User Industry
- Agriculture Industry
- Non-agriculture Industry
Driver Analysis
Soil degradation and micronutrient imbalance raise response rates
Controlled-release fertilizers perform best when conventional application creates mismatch between crop demand and nutrient availability, and government evidence increasingly shows those mismatch conditions are widespread. India’s 2026 PIB analysis links continuous cultivation and over-reliance on nitrogenous fertilizers to nutrient imbalances, depletion of secondary and micronutrients, soil-structure decline, and rising losses through runoff and leaching.
The Soil Health Card scheme tests 12 parameters and had distributed more than 25.55 crore soil health cards by mid-November 2025, after over 93,000 farmer training programs and roughly 6.8 lakh field demonstrations by July 2025. At market level, this creates a data-rich sales environment where suppliers can target CRF recommendations by crop, soil, and deficiency profile instead of selling undifferentiated NPK tonnage. The stronger the evidence of localized deficiency and loss, the easier it becomes for growers to accept the higher upfront per-tonne price of controlled-release inputs in exchange for fewer applications, better nutrient synchronization, and lower hidden loss costs
Drivers Impact Analysis
| Driver | (~) % Impact on CAGR Forecast | Geographic Relevance | Impact Timeline |
|---|---|---|---|
| Nutrient-efficiency mandates and 4R stewardship pull | +1.9% | North America core, EU, India, APAC corridors | Short term (≤ 2 years) |
| EU CE-mark compliance favors premium coated inputs | +1.4% | EU core, EEA spill-over, import corridors | Short term (≤ 2 years) |
| India subsidy architecture expands specialty nutrient formats | +1.7% | India core, South Asia spill-over | Medium term (2-4 years) |
| Soil degradation and micronutrient imbalance raise response rates | +1.5% | India, China, Southeast Asia, Latin America | Medium term (2-4 years) |
| Circular and bio-based input rules widen formulation innovation | +1.2% | EU, North America, developed APAC | Medium term (2-4 years) |
| Labor, application frequency, and input-loss economics support premiumization | +1.6% | North America, Brazil, Australia, intensive horticulture belts | Short term (≤ 2 years) |
Restraint Analysis
Nitrogen input inflation
Controlled release fertilizers remain structurally exposed to urea and ammonia economics because coated urea is still the dominant carrier platform in many premium nitrogen products, so the current cost shock in upstream nitrogen feeds directly into finished-goods pricing and demand elasticity; the World Bank reports the fertilizer price index rose more than 12 percent quarter on quarter in 2026Q1 and projected a more than 30 percent increase for 2026, while urea climbed above $850 per metric ton in April, up 80 percent since February, with nearly one-quarter of global urea exports exposed to Middle East shipping disruption through the Strait of Hormuz.
For CRF producers, that magnitude of upstream volatility can push quarterly raw-material procurement budgets 20 to 35 percent above plan, widen distributor replacement-cost risk, and force list-price resets of roughly 8 to 15 percent in a market where agronomic payback is not immediate for all crops, thereby delaying channel stocking, compressing gross margins on fixed-price contracts, and lowering forecast conversion from conventional fertilizers to premium controlled-release grades.
Restraint Impact Analysis
| Restraint | (~) % Impact on CAGR Forecast | Geographic Relevance | Impact Timeline |
|---|---|---|---|
| Nitrogen input inflation | -1.6% | EU, India, MENA-importing APAC, LatAm importers | Short term (≤ 2 years) |
| Polymer compliance shift | -1.1% | EU core, UK-aligned channels, export-to-EU suppliers | Medium term (2-4 years) |
| Export controls & tariffs | -1.3% | EU, Brazil, India, APAC corridors | Short term (≤ 2 years) |
| Sulfur/ammonia tightness | -0.9% | EU, North America specialty blends, APAC coating hubs | Short term (≤ 2 years) |
| Freight and inland delays | -0.7% | North America core, EU inland, India, Brazil | Short term (≤ 2 years) |
| Farm affordability squeeze | -1.4% | Emerging Asia, LatAm, Eastern Europe, Africa import markets | Medium term (2-4 years) |
Opportunity Analysis
Carbon-linked premium agronomy
This is a future opportunity rather than a present driver because CRF is still sold mostly on input efficiency and yield stability, whereas the larger upside comes from converting it into a measurable emissions-abatement and water-quality service within farm sustainability programs, carbon insetting contracts, and retailer-backed Scope 3 reduction frameworks that are not yet fully monetized at scale.
If suppliers capture even $12 to $25 per hectare in additional service revenue from MRV-enabled nutrient plans, while improving customer retention by 10% to 15% and compressing distributor-led customer acquisition cost by 8% to 12% through embedded sustainability procurement channels, the category could add about +1.9 percentage points to sector CAGR in premium row-crop and specialty-acre segments by the early 2030s.
Opportunity Impact Analysis
| Opportunity | (~) % Potential CAGR Upside | Geographic Relevance | Execution Window |
|---|---|---|---|
| Subsidy-to-EEF conversion | +2.4% | India, Southeast Asia | Short term (≤ 2 years) |
| Carbon-linked premium agronomy | +1.9% | EU, North America, Oceania | Medium term (2-4 years) |
| Horticulture & nursery mix shift | +1.6% | EU, North America, Japan, Gulf | Short term (≤ 2 years) |
| Rice deep-placement hybrid CRF | +2.1% | India east, Bangladesh, ASEAN | Medium term (2-4 years) |
| Precision nutrient platforms | +1.4% | EU, U.S., China, Brazil | Medium term (2-4 years) |
| Bio-based coating roll-up | +1.8% | EU core, North America | Long term (≥ 4 years) |
Challenges Analysis
High‑cost coating inputs
This challenge stems from the structurally higher material and energy intensity of CRF coating technologies, which use polymers, resins, and occasionally sulfur or biodegradable biopolymers that add 18–35% on top of the nutrient bulk cost compared with conventional granular NPK, creating a recurring unit economics penalty of 40–80 USD per tonne in many markets when benchmarked against government‑subsidized urea and standard NPK blends.
In 2026, petrochemical price volatility has driven feedstock cost swings of 10–15% year‑on‑year for key coating resins, while electricity tariffs and gas prices in EU and East Asia expose CRF plants to operating cost variability of 8–12% relative to baseline, translating to margins that can compress by 200–300 basis points in unfavorable quarters, and forcing manufacturers to either trim production utilization by 5–10 percentage points or accept lower returns on invested capital.
This systematically shaves an estimated 1.2 percentage points off potential global CAGR because at least 25–30% of addressable acres particularly in price‑sensitive horticulture and broadacre segments remain locked into cheaper, subsidized conventional fertilizers, as evidenced by large national fertilizer subsidy programs that keep urea retail prices flat even as total NPK consumption rises from roughly 25.6 to 32.9 million nutrient tonnes over the last decade.
Strategically, producers must move toward lower‑cost and partially bio‑based coatings, targeting a 10–15% reduction in per‑tonne coating cost by 2029 via process yields improvements of 3–5 percentage points, higher plant load factors (from ~70% to ~85%) and long‑term gas and power contracts; they must also pivot pricing models toward outcome‑based packages that can justify a 5–10% premium per hectare by quantifying yield gain and reduced application frequency, thereby slowly normalizing unit economics and reducing friction drag over a 2–4‑year horizon.
Challenges Impact Analysis
| Challenge | (~) % CAGR Friction Drag | Geographic Relevance | Mitigation Horizon |
|---|---|---|---|
| High-cost coating inputs | -1.2% | North America, EU, East Asia | Medium term (2-4 years) |
| Formulation and field-use complexity | -0.9% | North America core, EU regulatory hubs, APAC growth belts | Medium term (2-4 years) |
| Supply chain and logistics volatility | -1.0% | Global, APAC logistics corridors, MEA importers | Long term (≥ 4 years) |
| Talent and technical know-how gap | -0.8% | Emerging Asia, LATAM, MEA | Long term (≥ 4 years) |
| Regulatory data and compliance burden | -0.7% | EU, North America, East Asia | Medium term (2-4 years) |
| Farmer adoption and behavioral inertia | -1.1% | South Asia, Sub-Saharan Africa, fragmented smallholder markets | Long term (≥ 4 years) |
Geopolitical Impact Analysis
Geopolitical Impact Analysis: Ongoing Conflicts Reshape the Controlled Release Fertilizers Supply Chain.
The ongoing geopolitical conflicts, particularly the Russia-Ukraine war and continued instability in parts of the Middle East, have created new challenges for the Controlled Release Fertilizers Market. Russia and Belarus are major suppliers of fertilizer nutrients such as potash and nitrogen products. Trade restrictions, sanctions, and disruptions to transportation have affected the availability and pricing of key raw materials used in manufacturing controlled-release fertilizers. As production costs increased, fertilizer manufacturers faced pressure on profit margins, while farmers in several countries delayed purchases because of higher input prices.
At the same time, these disruptions have encouraged governments and agricultural companies to reduce dependence on a limited number of suppliers. Many fertilizer producers are expanding manufacturing facilities in North America, Asia-Pacific, and Latin America to strengthen regional supply chains. Farmers are also showing greater interest in controlled-release fertilizers because they improve nutrient use efficiency and reduce the number of fertilizer applications, helping offset rising input and labor costs.
Investment in precision agriculture and sustainable farming has accelerated as countries focus on improving food security during uncertain global conditions. Although geopolitical tensions continue to create short-term volatility in raw material supply and logistics, they are also driving long-term innovation, localized production, and wider adoption of advanced fertilizer technologies across the global agricultural sector.
Regional Analysis
Asia Pacific Held the Largest Share of the Global Controlled Release Fertilizers Market.
Asia-Pacific dominated the Controlled Release Fertilizers Market in 2025, accounting for 43.45% of the global market and valued at approximately USD 1.2 billion. The region’s leadership is supported by its large agricultural sector, expanding population, and rising demand for higher crop productivity while reducing fertilizer losses. Japan and South Korea continue to adopt advanced coated and polymer-based fertilizers for high-value horticulture and precision farming.
- The United States Department of Agriculture (USDA) reported that U.S. farmers planted approximately 95.3 million acres of corn in 2025, creating substantial demand for fertilizers that improve nitrogen use efficiency. Rising adoption of GPS-guided equipment, variable-rate fertilizer application, and digital farm management systems is encouraging greater use of controlled-release products.
In January 2025, the U.S. Environmental Protection Agency announced USD 2.4 million in funding for 24 small businesses developing environmental technologies, including enhanced-efficiency fertilizer innovations that support future controlled-release fertilizer development.
Key Regions and Countries Covered
- North America
- The US
- Canada
- Europe
- Germany
- France
- The UK
- Spain
- Italy
- Russia & CIS
- Rest of Europe
- APAC
- China
- Japan
- South Korea
- India
- ASEAN
- Rest of APAC
- Latin America
- Brazil
- Mexico
- Rest of Latin America
- Middle East & Africa
- GCC
- South Africa
- Rest of MEA
Key Players Analysis
Koch Industries participates in controlled and enhanced-efficiency fertilizers through Koch Fertilizer and Koch Agronomic Services. Koch Fertilizer distributes more than 12 million metric tons annually through 6 production facilities and over 50 terminals. Its SUPERU product contains 46% nitrogen and is supported by 25 years of research.
SQM supports the controlled release fertilizers market through its large specialty plant nutrition business and broad specialty-blend portfolio. In 2025, this division generated US$982.4 million in revenue from 1.013 million metric tons of sales. Specialty blend volumes reached 301,600 metric tons, increasing 9%, while other specialty plant nutrients grew 16%. SQM expects plant-nutrition sales volumes to rise by 2% to 4%, supporting continued investment in differentiated fertilizers, nutrient efficiency, premium horticultural segments globally.
COMPO EXPERT maintains a strong position in controlled release fertilizers through a portfolio covering slow-release, controlled-release, stabilized, water-soluble, and liquid fertilizers. The company operates 4 fertilizer plants and 22 international locations, while employing about 750 people. It serves approximately 5,000 customers and sells products in more than 100 countries.
Jinfeng Agricultural Services operates as a modern agricultural service platform backed by Kingenta and international financial partners. The company’s expansion model targets 1,000 county-level agricultural service platforms capable of reaching 50 million farmers nationwide. Its controlled release fertilizer access is strengthened by Kingenta’s manufacturing base, which includes 11 production sites and more than 2 million tons of annual capacity.
The Major Players in The Industry
- Yara
- ICL
- Scottsmiracle-Gro
- Koch Industries
- Kingenta
- SQM
- Haifa Chemicals
- Compo Expert
- Aglukon
- Jinfeng Agricultural Services Co. Ltd
- CF Industries Holdings
- Ocp Group
- Potash Corporation Of Saskatchewan
- Other Key Players
Key Development
- In January 2026, ScottsMiracle-Gro increased its fiscal 2026 capital expenditure plan to USD 130 million, including an additional USD 30 million for upgrading its Marysville facility, expanding fertilizer innovation, improving automation and increasing production capacity. The company also planned to invest a further USD 25 million in media activities, digital systems and research and development.
- In May 2025, Yara expanded its long-term agreement with PepsiCo across 9 Latin American markets, with the program expected to cover more than 20,000 hectares and supply over 30,000 tonnes of lower-carbon fertilizers. This partnership supports wider use of efficient crop nutrition programs among potato growers.
Report Scope
| Report Features | Description |
|---|---|
| Market Value (2025) | USD 2.7 Bn |
| Forecast Revenue (2035) | USD 4.8 Bn |
| CAGR (2026-2035) | 6.0% |
| Base Year for Estimation | 2025 |
| Historic Period | 2020-2024 |
| Forecast Period | 2026-2035 |
| Report Coverage | Revenue Forecast, Market Dynamics, Competitive Landscape, Recent Developments |
| Segments Covered | By Type (Coated and Encapsulation), By Formulation (Dry and Liquid), By Application (Foliar Application, Fertigation, and Others), By End User Industry (Agriculture Industry and Non-agriculture Industry) |
| Regional Analysis | North America – The US & Canada; Europe – Germany, France, The UK, Spain, Italy, Russia & CIS, Rest of Europe; APAC– China, Japan, South Korea, India, ASEAN & Rest of APAC; Latin America– Brazil, Mexico & Rest of Latin America; Middle East & Africa– GCC, South Africa, & Rest of MEA |
| Competitive Landscape | Yara, ICL, Scottsmiracle-Gro, Koch Industries, Kingenta, SQM, Haifa Chemicals, Compo Expert, Aglukon, Jinfeng Agricultural Services Co. Ltd, CF Industries Holdings, Ocp Group, Potash Corporation Of Saskatchewan, and Other Key Players. |
| Customization Scope | Customization for segments, region/country-level will be provided. Moreover, additional customization can be done based on the requirements. |
| Purchase Options | We have three licenses to opt for: Single User License, Multi-User License (Up to 5 Users), Corporate Use License (Unlimited Users and Printable PDF) |





































