
Quick Navigation
Report Overview
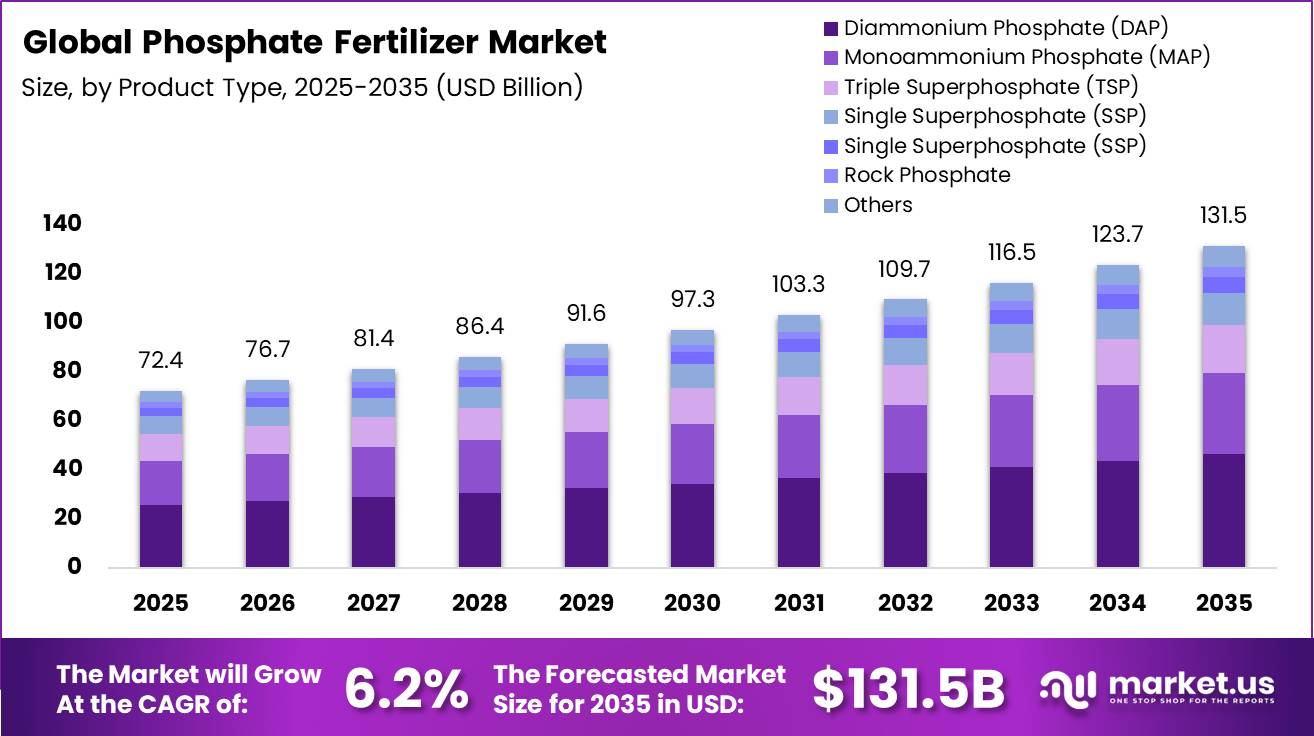
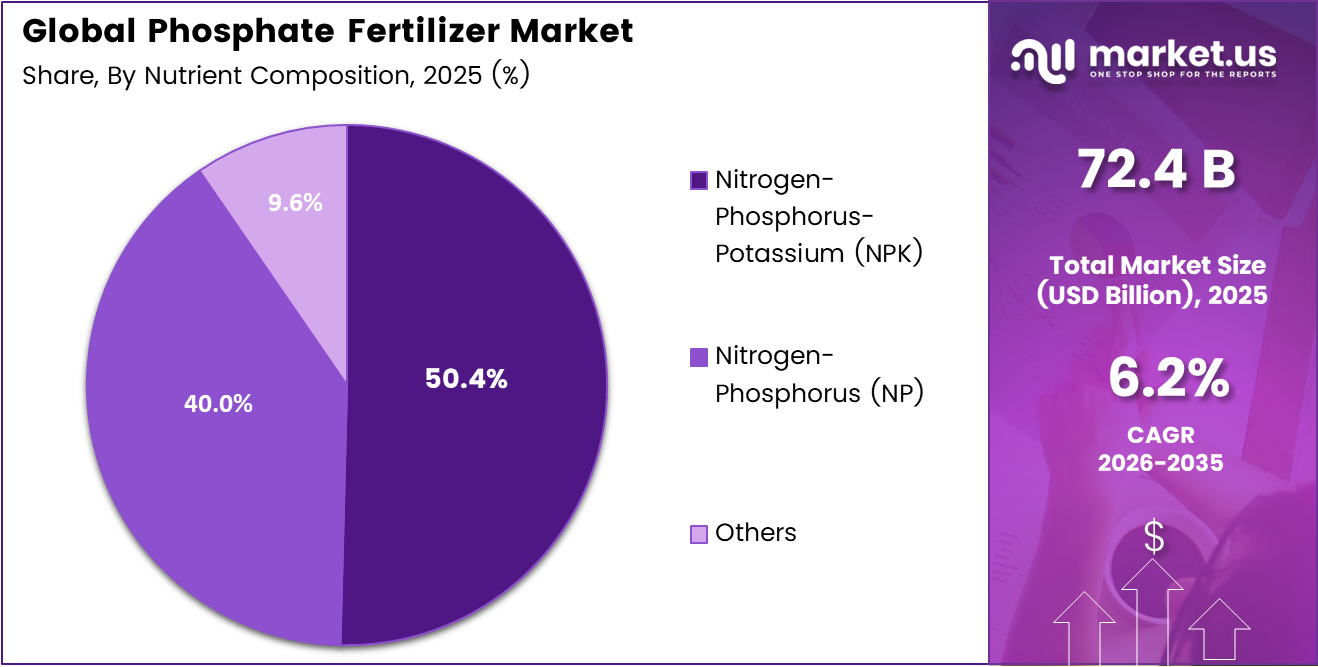
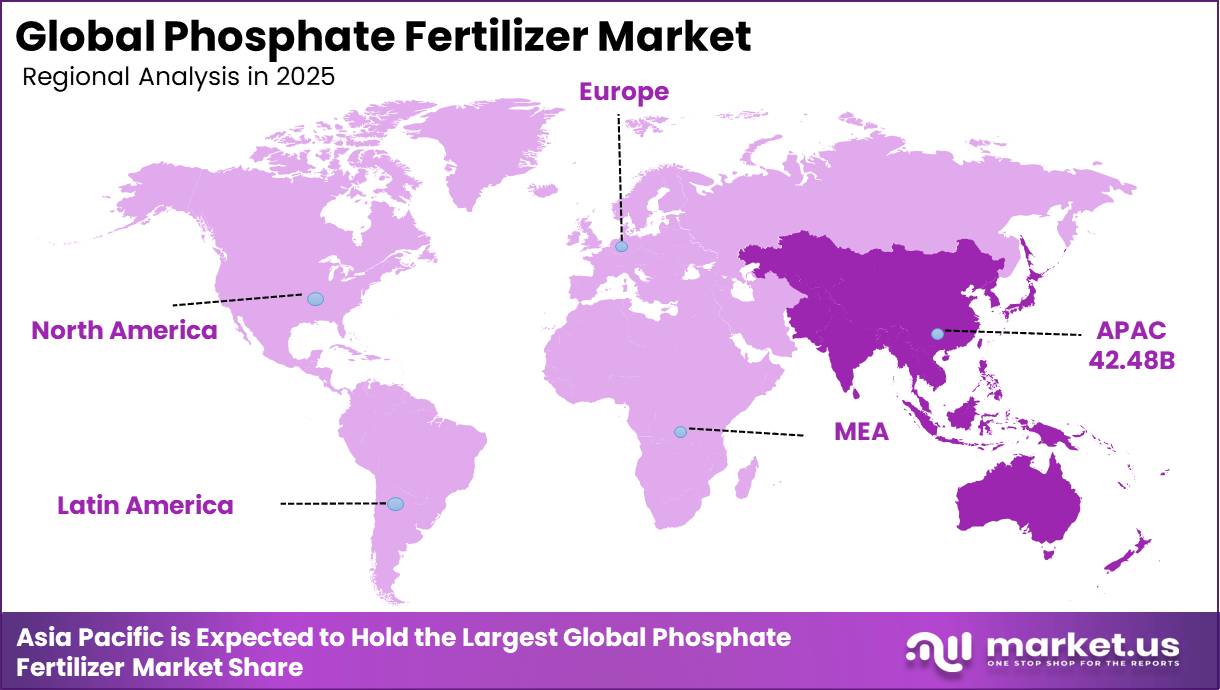
The Global Phosphate Fertilizer Market was valued at USD 72.4 billion in 2025, and between 2026 and 2035, this market is estimated to register a CAGR of 6.2%, reaching about USD 131.5 billion by 2035. Asia Pacific held a dominant market position, capturing more than a 58.7% share, holding USD 42.48 billion in revenue.
Phosphate fertilizers constitute a core segment of global inorganic fertilizers, supplying essential phosphorus to intensive crop production systems in major agricultural regions outside India. Worldwide agricultural use of phosphorus fertilizers (expressed as P2O5P_2O_5) increased from about 34 million tonnes in 2002 to roughly 41 million tonnes in 2023, a rise of around 20 percent, underscoring their growing role in supporting food and feed sectors.
Industrially, phosphate fertilizer production is closely linked to phosphate rock extraction, with deposits geographically concentrated in a limited number of countries, which creates an oligopolistic supply structure and exposes importing economies to price volatility and trade policy risks.
End‑use sectors relying on phosphate fertilizers include cereals, oilseeds, sugar crops and intensive horticulture, alongside emerging uses in high‑value segments such as wood production and bioenergy crops. International organizations such as FAO and the Agricultural Market Information System highlight that world inorganic fertilizer production reached about 208 million tonnes in 2023, with phosphorus contributing approximately one‑fifth of total plant nutrient use, and project continued demand growth driven by population increase and dietary shifts.
Policy frameworks and government‑linked initiatives focus on improving market transparency, monitoring fertilizer trade flows and promoting balanced nutrient management to mitigate environmental impacts, particularly eutrophication from phosphate runoff, while maintaining reliable access for agribusiness, food processing and broader value chains dependent on stable crop supplies.
Key Takeaways
- The global phosphate fertilizer market was valued at US$ 72.4 billion in 2025.
- The global phosphate fertilizer market is projected to grow at a CAGR of 6.2% and is estimated to reach US$ 131.5 billion by 2035.
- On the basis of product type, Diammonium Phosphate (DAP) dominated the market, constituting 35.4% of the total market share.
- Based on nutrient composition, Nitrogen-Phosphorus-Potassium (NPK) dominated the phosphate fertilizers market, with a substantial market share of around 50.4%.
- Based on crop type, Cereals & Grains led the market, comprising 45.6% of the total market share.
- Among the distribution channels, Distributors & Dealers held a major share in the phosphate fertilizers market, accounting for 45.6% of the market share.
- In 2025, Asia Pacific was the most dominant region in the phosphate fertilizers market, accounting for 58.7% of the total global consumption.
Product Type Analysis
Diammonium Phosphate (DAP) dominated the product type segment.
Diammonium Phosphate (DAP) was the prominent product type in the worldwide phosphate fertilizers industry, accounting for 35.4% of the market share. This dominance in the market is attributed to the high concentration of nutrients, simple availability of phosphorus, and widespread application in a variety of agricultural products such as cereals, grains, oilseeds, and crops. Farmers value DAP because it promotes root growth, increases crop yield, and ensures balanced plant growth.
Monoammonium Phosphate (MAP), Triple Superphosphate (TSP), and Single Superphosphate (SSP) have a strong market presence because to their high phosphorus content, low cost, and appropriateness for boosting soil fertility and crop productivity in a variety of agricultural applications.
Ammonium Polyphosphate (APP) is also becoming used in liquid fertilizer and precision irrigation systems due to its high solubility and effective nutrient delivery. Rock phosphate is still an essential raw material for fertilizer manufacture, and the Others category includes specialist phosphate fertilizers and customized nutrient blends designed for sustainable agriculture and precision farming approaches.
Nutrient Composition Analysis
Dominance of NPK Segment in Global Phosphate Fertilizers Market.
The part of the global phosphate fertilizers market that focuses on nutrition is mainly taken by nitrogen-phosphorus-potassium (NPK), which holds 50.4% of the market. NPK is popular because it provides a good mix of nutrients that help plants grow well, produce more crops, and keep the soil healthy.
These fertilizers are used a lot in growing things like grains, fruits, vegetables, and other commercial crops because they give the necessary nutrients for roots, flowers, and better harvests. The increased use of efficient fertilizers and modern farming methods has made the demand for NPK-based phosphate fertilizers go up around the world.
Nitrogen-Phosphorus (NP) fertilizers have a strong and expanding market presence, thanks to their demonstrated effectiveness in treating phosphorus-deficient soils and supporting crops that require strong root formation and aggressive vegetative growth. Their low cost and consistent nutrient delivery make them a feasible and popular alternative among large-scale agricultural producers aiming to reduce input expenditures while maintaining crop performance.
Crop Type Analysis
Cereals and grains dominated the crop segment of the worldwide phosphate fertilizer industry, accounting for 45.6% of total market share. The segment’s success is mostly due to the significant role of phosphate fertilizers in increasing yields of the world’s most important staple crops, such as wheat, rice, corn, and barley.
The expanding worldwide demand for food security, rising consumption of staple grains in developing nations, and government-backed cereal production programs all contribute to increased phosphate fertilizer demand in this category.
Commercial crops like sugarcane, cotton, coffee, and tea are key applications for phosphate fertilizers due to their high nutrient requirements and large-scale cultivation in nations like Brazil, India, and the United States. Meanwhile, the Turf & Ornamentals segment is expanding steadily, driven by increased landscaping activities, sports turf maintenance, golf course management, and rising demand for ornamental gardening and urban green spaces.
Distribution Channel Analysis
Distributors and Dealers dominated the distribution channel segment of the global phosphate fertilizer market, accounting for 45.6% of total market share, owing to their deeply embedded rural networks, strong farmer relationships, and consistent product accessibility across key agricultural regions.
Distributors and dealers continue to be a vital and highly trusted element in the worldwide phosphate fertilizer supply chain because they bridge the gap between producers and farmers at the grassroots level. Direct Sales hold a strong and growing presence, particularly among large-scale commercial farms and agribusiness companies that prefer sourcing fertilizers directly from manufacturers in bulk, a model that offers greater pricing control, supply security, and operational efficiency.
Cooperatives continue to play a meaningful role across several agricultural economies, acting as a collective purchasing force that helps smaller farmers access fertilizers at competitive prices through group buying arrangements and government-supported distribution programs.
Key Market Segments
By Product Type
- Diammonium Phosphate (DAP)
- Monoammonium Phosphate (MAP)
- Triple Superphosphate (TSP)
- Single Superphosphate (SSP)
- Ammonium Polyphosphate (APP)
- Rock Phosphate
- Others
By Nutrient Composition
- Nitrogen-Phosphorus-Potassium (NPK)
- Nitrogen-Phosphorus (NP)
- Others
By Crop Type
- Cereals & Grains
- Wheat
- Rice
- Corn
- Barley
- Others
- Oilseeds & Pulses
- Soybean
- Canola
- Sunflower
- Pulses
- Others
- Fruits & Vegetables
- Commercial Crops
- Sugarcane
- Cotton
- Coffee
- Tea
- Others
- Turf & Ornamentals
- Others
By Distribution Channel
- Direct Sales
- Distributors & Dealers
- Cooperatives
- Online Sales
- Retail Agricultural Stores
Market Dynamics
Drivers
| Driver | (~) % Impact on CAGR Forecast | Geographic Relevance | Impact Timeline |
|---|---|---|---|
| Rising Global Food Demand & Population-Driven Crop Intensification | +2.1% | South Asia, Latin America, Sub-Saharan Africa | Short term (≤ 2 years) |
| Government Subsidy Programs & Strategic Nutrient-Based Incentives | +1.4% | India, Brazil, Southeast Asia | Short term (≤ 2 years) |
| Expanding Oilseed & Soybean Cultivation in Latin America | +1.0% | Brazil, Argentina, Paraguay | Short term (≤ 2 years) |
| Tight Global Supply Triggering Restocking & Forward Procurement | +0.9% | Global, especially import-dependent markets | Short term (≤ 2 years) |
| OCP Group & Saudi Arabia Capacity Expansion Sustaining Accessible Supply | +0.6% | North Africa, Middle East, Global export destinations | Medium term (2–4 years) |
| Shift Toward Blended NPK & High Efficiency Phosphate Formulations | +0.5% | Europe, North America, East Asia | Medium term (2–4 years) |
The most structurally durable driver of phosphate fertilizer market expansion is the unrelenting pressure of population growth on staple crop production, particularly across South Asia and Latin America, which together account for a major share of incremental global fertilizer consumption growth. Global fertilizer use is forecast to reach 205 Mt of nutrients in FY 2025, surpassing the previous record of 201.5 Mt set in FY 2020, after consecutive years of demand compression driven by affordability shocks.
In India alone, the Union Cabinet revised Nutrient Based Subsidy rates in March 2025, maintaining DAP availability under a special one-time subsidy of ₹3,500 per tonne and extending freight subsidies on SSP to sustain phosphate offtake across kharif and rabi seasons, demonstrating how state-backed demand floors prevent discretionary demand destruction even at elevated price levels.
Brazil, importing roughly 87% of its fertilizer needs in 2024 with phosphate imports forecast to climb from 14.7 billion kg in 2024 to 17.1 billion kg by 2028, exemplifies how large-scale agricultural economies remain structurally dependent on external phosphate supply. The commercial implication is a demand floor that is both policy-protected and agronomically non-discretionary; phosphorus cannot be substituted or skipped across a crop cycle, cementing a minimum 2 to 3% annual volumetric growth trajectory in phosphate nutrient consumption even under price-elevated conditions.
Restraints
| Restraint | (~) % Impact on CAGR Forecast | Geographic Relevance | Impact Timeline |
|---|---|---|---|
| China’s Structural Phosphate Export Suspension & Quota Regime | −1.8% | Global, acutely India, Southeast Asia, USA | Short term (≤ 2 years) |
| EU Farm to Fork Fertilizer Reduction Mandates | −0.8% | European Union | Medium term (2–4 years) |
| Extreme Price Volatility Suppressing Smallholder Purchasing Power | −0.7% | Sub-Saharan Africa, South & Southeast Asia | Short term (≤ 2 years) |
| Geopolitical Sanctions on Russia & Belarus Fragmenting Potash Phosphate Trade Routes | −0.5% | Europe, Americas | Short term (≤ 2 years) |
| High Input Cost Inflation (Sulfur, Ammonia) Compressing Producer Margins | −0.4% | Global, especially non-integrated producers | Short term (≤ 2 years) |
China’s progressive tightening of phosphate fertilizer export policy represents the single most potent supply side restraint operating on the global market today, functioning as a hard regulatory block on roughly 30 to 35% of historical global MAP and DAP trade volumes. In Q1 2025, China exported just 111,000 metric tonnes of phosphate fertilizer, a collapse from the prior three-year average of 785,000 tonnes over the same period, as domestic priorities shifted toward food security and lithium iron phosphate battery supply chains over export revenue.
Exports to India, historically among the largest recipients of Chinese DAP, are explicitly restricted. Commercially, this has driven DAP Gulf prices from approximately $568 per tonne in December 2024 to $615 per tonne by March 2025, with intra-year peaks exceeding $795 per tonne, a 34%+ increase from the start of 2025, directly compressing downstream importer margins by an estimated $30 to $40 per tonne on production cost alone and delaying seasonal application in import-dependent markets.
Challenges
| Challenge | (~) % CAGR Friction Drag | Geographic Relevance | Mitigation Horizon |
|---|---|---|---|
| Phosphate Reserve Geographic Concentration Risk | −1.2% | Global, Morocco, China, Russia dependency | Long term (≥ 4 years) |
| Sulfur & Ammonia Input Volatility | −0.9% | Global, especially non-integrated producers in Asia & Europe | Medium term (2–4 years) |
| Agricultural Logistics & Last Mile Delivery Gaps | −0.6% | Sub-Saharan Africa, South Asia, Southeast Asia | Medium term (2–4 years) |
| Phosphate Battery Sector Feedstock Competition | −0.5% | China, Global, especially LFP battery supply chains | Long term (≥ 4 years) |
| Regulatory Compliance & Environmental Permitting Complexity | −0.4% | EU, North America | Medium term (2–4 years) |
The structural vulnerability at the foundation of global phosphate fertilizer supply chains is the extreme geographic concentration of economically recoverable phosphate rock reserves. Morocco alone holds 68% of global reserves, approximately 50 billion tonnes out of a global total of 74 billion tonnes, operated primarily through the state-owned OCP Group, while the next largest holders such as China, USA, and Russia are largely self-supply focused and increasingly export restrictive.
A study on global phosphate rock economics estimated reserves at 83 Gt run of mine containing 21 Gt P₂O₅ at current cost and technology parameters, representing commercially finite geology in a market that consumes approximately 215 to 280 Mt of phosphate rock annually at projected plateau production levels. The friction drag on growth operates through sovereign pricing concentration, geopolitical exposure in Western Sahara that can disrupt logistics corridors, and the absence of viable near-term alternative large-scale supply sources.
Total phosphate capacity growth outside Morocco is limited, with global incremental expansion expected at only about 55.3 Mt P₂O₅ by 2025 driven by small-scale additions in Brazil, India, and China. For buyers and downstream blenders, mitigation requires multi-year supply agreements, diversification across Jordan, Togo, Mauritania, and Senegal, and investment in nutrient recycling infrastructure, which collectively increases procurement costs by an estimated 8 to 15% versus spot purchasing and extends rebalancing timelines by 3 to 5 years.
Opportunities
| Opportunity | (~) % Potential CAGR Upside | Geographic Relevance | Execution Window |
|---|---|---|---|
| Sub-Saharan Africa Fertilizer Adoption Scale Up | +1.9% | Sub-Saharan Africa, Kenya, Nigeria, Ethiopia, Côte d’Ivoire | Medium term (2–4 years) |
| Green & Low Carbon Phosphate Fertilizer Premium Segment | +1.1% | EU, North America, Japan, Australia | Long term (≥ 4 years) |
| Precision Fertigation & Controlled Release Phosphate Products | +0.8% | India, Brazil, China, USA | Medium term (2–4 years) |
| Phosphate Nutrient Recycling & Struvite Recovery Commercialization | +0.6% | EU, North America, Japan | Long term (≥ 4 years) |
| Strategic M&A in Junior Phosphate Mining Projects (ex Morocco) | +0.5% | Peru, Senegal, Togo, Brazil, Jordan | Long term (≥ 4 years) |
Sub-Saharan Africa represents the most under-exploited white space in the global phosphate fertilizer market today. The region’s average fertilizer application rate remains at just 13 to 22 kg per hectare compared to global averages of 135 to 140 kg/ha in East Asia and 90 to 100 kg/ha in South Asia, despite its significant share of global arable land. This application gap is driven by market access constraints such as logistics costs, fragmented distribution systems, lack of blending capacity, and limited rural financing.
If application rates increase toward 50 kg/ha across approximately 200 million cultivated hectares, incremental phosphate demand could reach 5 to 7 Mt P₂O₅ annually, equivalent to 8 to 11% of current global consumption. Key markets include Kenya, Côte d’Ivoire, Senegal, Namibia, Rwanda, and Lesotho, which combine strong consumption growth trajectories with high import costs and renewable energy potential for future integration.
Margin expansion potential is significant for distributors establishing regional warehousing and blending infrastructure, as reducing freight layers can lower landed fertilizer costs by 15 to 25%, improving affordability and unlocking latent demand. Execution requires investment in logistics, partnerships with governments for subsidy systems, and agronomic extension services, none of which are yet fully embedded in existing producer business models.
Geopolitical Impact Analysis
Geopolitical instability and issues with international trade greatly affect the global market for phosphate fertilizers because most phosphate rock and fertilizer production happens in a few key countries. The countries that lead in producing phosphates, like China, Morocco, Russia, and Saudi Arabia, play a big role in supplying fertilizers worldwide. Because of this, the international market is very sensitive to any problems like export restrictions, economic sanctions, trade issues, or even local conflicts.
The ongoing conflict between Russia and Ukraine has caused fertilizer prices to rise and led to shortages in countries that rely heavily on imported fertilizers. At the same time, more concerns about having enough food and being able to grow enough crops on their own are making governments try to increase the production of fertilizer made locally and find more sources for it.
Countries are slowly putting more money into building local fertilizer plants, storing enough phosphate, and making long-term deals to get fertilizer from other places. Also, competition between nations for important minerals and new laws about the environment are changing how fertilizer is traded and where investments are made. All of these things are expected to keep affecting the cost of fertilizer, how steady the supply is, and how the global market works in the years to come.
Regional Analysis
Asia Pacific Held the Largest Share of the Global Phosphate Fertilizer Market.
Asia Pacific dominated the global phosphate fertilizer market, with 58.70% of the overall market share. The region’s strong position is primarily maintained by its vast agricultural sector, growing population, and widespread production of staple commodities such as rice, wheat, and corn in China, India, and Southeast Asian countries. Furthermore, favourable government policies, fertilizer subsidy programs, and an increased emphasis on food security continue to encourage fertilizer consumption throughout the region.
North America has a well-established phosphate fertilizer industry, owing to large-scale crop growth of corn, soybeans, and wheat. In Europe, market demand is being driven by rigorous environmental restrictions as well as a growing preference for sustainable and eco-friendly fertilizers. Latin America, notably Brazil, is emerging as one of the world’s fastest-growing marketplaces as soybean, sugarcane, and corn agriculture expands and agricultural expenditures increase.
Key Regions and Countries Covered in this Report
- North America
- The US
- Canada
- Europe
- Germany
- France
- The UK
- Spain
- Italy
- Russia & CIS
- Rest of Europe
- APAC
- China
- Japan
- South Korea
- India
- ASEAN
- Rest of APAC
- Latin America
- Brazil
- Mexico
- Rest of Latin America
- Middle East & Africa
- GCC
- South Africa
- Rest of MEA
Key Players Analysis
The worldwide phosphate fertilizer industry is a somewhat consolidated market, with a few major multinational companies such as Yara International ASA, EuroChem Group AG, PhosAgro, and ICL Group Ltd. accounting for significant portions of production capacity, raw material reserves, and international business operations. An oligopoly exists due to the concentration of phosphate rock and phosphate fertilizer production in specific geographical regions.
The advantages include effective phosphate mining capabilities, vast distribution reach, modern phosphate fertilizer production technology, and attractive supply contracts, which enable dominant businesses to gain a competitive advantage in the industry.
At the same time, smaller and medium-sized farmers operate in a variety of geographic marketplaces in response to local farming needs and distribution routes. The competition among the industry’s top competitors focuses on increasing production capacity, securing reliable raw material sources, price tactics, product innovation, and sustainability. Increasing efforts have been made to develop innovative phosphate fertilizers and ecologically friendly nutrition products, as well as to form alliances and engage in phosphate mining operations in new markets.
The Following are some of the Major Players in the Industry
- OCP Group
- The Mosaic Company
- Nutrien Ltd.
- Yara International
- PhosAgro
- EuroChem Group
- Ma’aden (Saudi Arabian Mining Co.)
- CF Industries
- K+S AG
- Israel Chemicals Ltd. (ICL)
- Sinofert Holdings
- Coromandel International
- Deepak Fertilizers
- Jordan Phosphate Mines Company
- Kazphosphate LLP
- Sumitomo Chemical
- Other Key Players
Key Development
- In April 2026, OCP Group increased its focus on Triple Superphosphate (TSP) fertilizer production to strengthen supply stability and reduce dependence on volatile raw material markets amid global geopolitical disruptions.
- In February 2025, The Mosaic Company expanded phosphate production capabilities and highlighted tightening global phosphate supply due to lower Chinese exports and rising global agricultural demand.
Report Scope
| Report Features | Description |
|---|---|
| Market Value (2025) | USD 72.4 Bn |
| Forecast Revenue (2035) | USD 131.5 Bn |
| CAGR (2026-2035) | 6.2% |
| Base Year for Estimation | 2025 |
| Historic Period | 2020-2024 |
| Forecast Period | 2026-2035 |
| Report Coverage | Revenue Forecast, Market Dynamics, Competitive Landscape, Recent Developments |
| Segments Covered | By Product Type (Diammonium Phosphate (DAP), Monoammonium Phosphate (MAP), Triple Superphosphate (TSP), Single Superphosphate (SSP), Ammonium Polyphosphate (APP), Rock Phosphate, and Others), By Nutrient Composition (Nitrogen-Phosphorus (NP), Nitrogen-Phosphorus-Potassium (NPK), and Others), By Crop Type (Cereals & Grains, Oilseeds & Pulses, Fruits & Vegetables, Commercial Crops, Turf & Ornamentals, and Others), By Distribution Channel (Direct Sales, Distributors & Dealers, Cooperatives, Online Sales, and Retail Agricultural Stores) |
| Regional Analysis | North America – The US & Canada; Europe – Germany, France, The UK, Spain, Italy, Russia & CIS, Rest of Europe; APAC- China, Japan, South Korea, India, ASEAN & Rest of APAC; Latin America- Brazil, Mexico & Rest of Latin America; Middle East & Africa- GCC, South Africa, & Rest of MEA |
| Competitive Landscape | OCP Group, The Mosaic Company, Nutrien Ltd., Yara International, PhosAgro, EuroChem Group, Ma’aden (Saudi Arabian Mining Co.), CF Industries, K+S AG, Israel Chemicals Ltd. (ICL), Sinofert Holdings, Coromandel International, Deepak Fertilizers, Jordan Phosphate Mines Company, Kazphosphate LLP, Sumitomo Chemical, Other Key Players. |
| Customization Scope | Customization for segments and region/country-level will be provided. Moreover, we can provide further customization to meet your requirements. |
| Purchase Options | We have three licenses to opt for: Single User License, Multi-User License (Up to 5 Users), Corporate Use License (Unlimited Users and Printable PDF) |


