


Report Overview
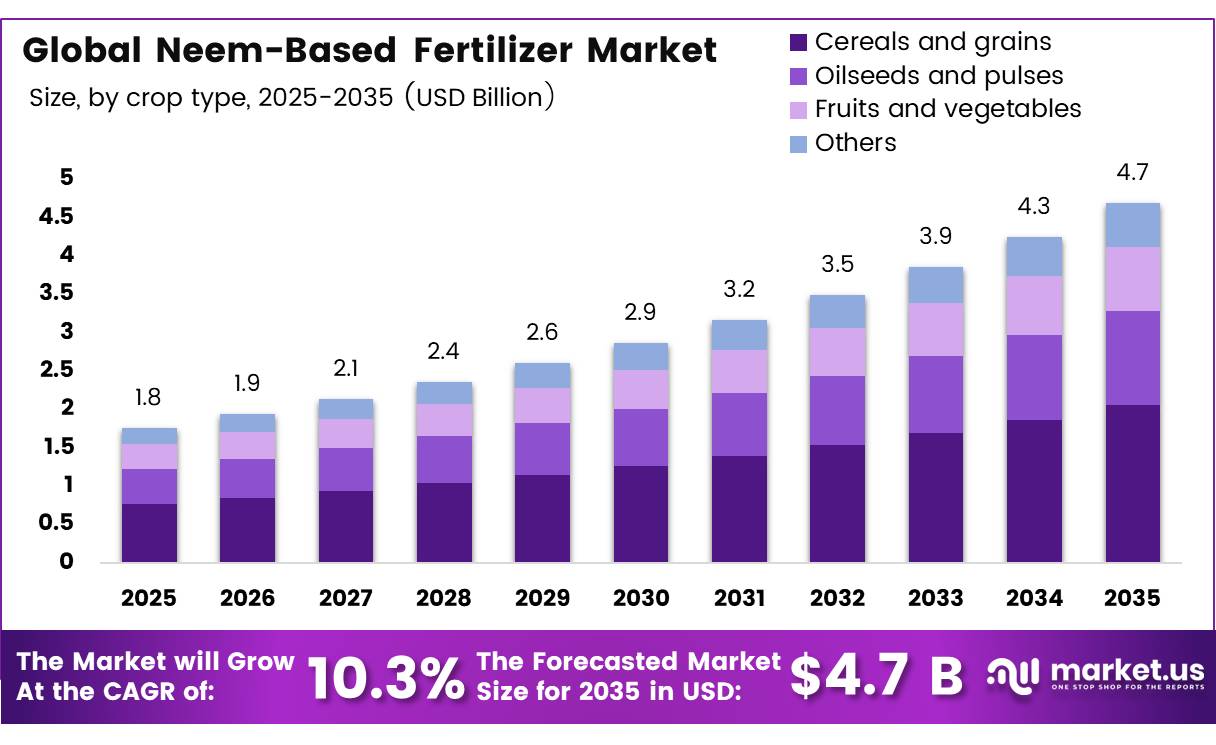
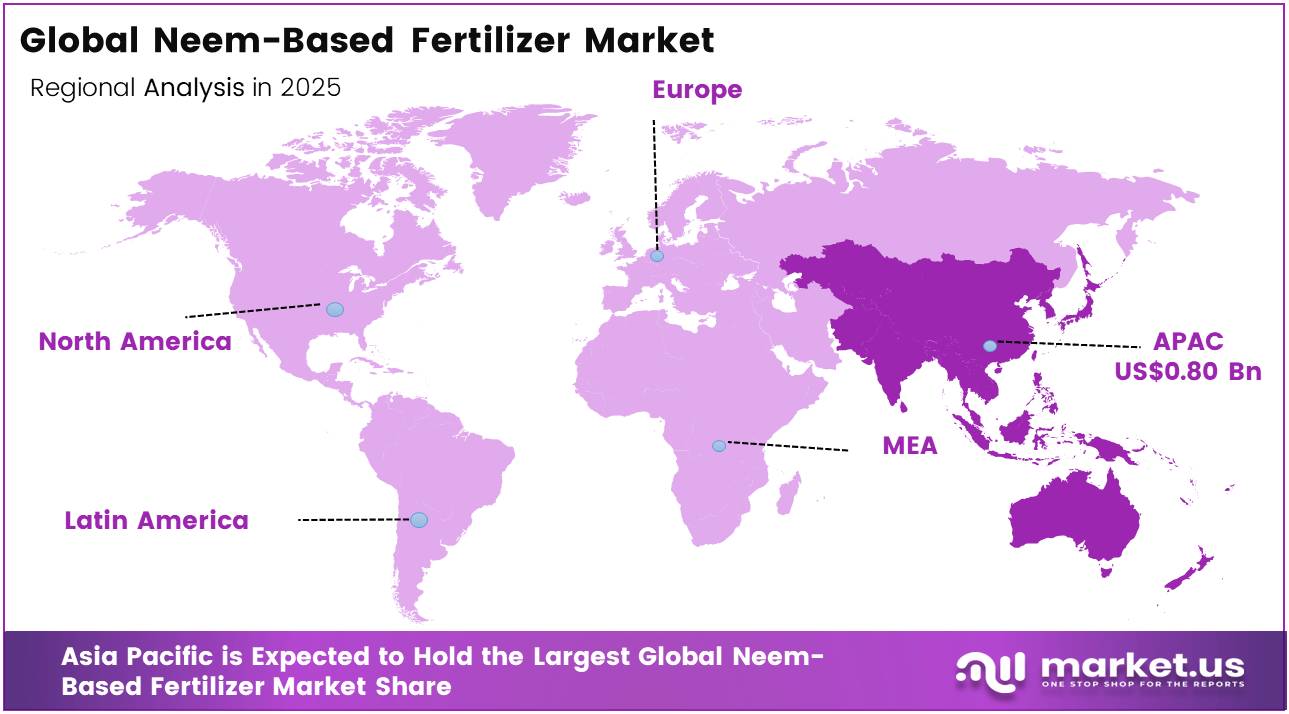
In 2025, the Global Neem-Based Fertilizer Market was valued at US$1.8 billion, and between 2026 and 2035, this market is estimated to register a CAGR of 10.3%, reaching about US$4.7 billion by 2035. In 2025, Asia Pacific held a dominant market position, capturing more than a 45.20% share, holding USD 0.80 Billion revenue.
Neem-based fertilizer is produced mainly from neem seed cake, the residue left after oil extraction. It is used as an organic nutrient source and soil amendment, while naturally occurring neem compounds may also support pest and nematode management. Commercial products are supplied as cake, powder, granules, enriched compost and blended fertilizer.
- The Food and Agriculture Organization reported that global agricultural use of inorganic fertilizers reached 190 million tonnes, representing a 34% increase from 2002. Nitrogen use reached 112 million tonnes, while phosphorus and potassium use stood at 41 million tonnes and 38 million tonnes, respectively. This large input base creates opportunities for neem-based products in integrated nutrient-management programmes, particularly where growers seek organic matter and gradual nutrient release.
Neem-based fertilizer is developing as a bio-based soil-input category made from neem seed cake and oil-processing residues. Its role is linked to organic-matter addition, gradual nutrient release, and the need to improve nitrogen-use efficiency. In 2024, the International Fertilizer Association estimated global ammonia output at 190.5 million tonnes and urea production at 201 million tonnes, both 3% above 2023, showing the scale of conventional fertilizer supply that biological alternatives must complement.
During 2025/26, nitrogen represented 57.5% of global N, P₂O₅, and K₂O fertilizer use, while phosphate accounted for 23.0% and potash 19.6%. This nutrient concentration, combined with farmer sensitivity to input costs, supports demand for neem-enriched blends designed to reduce nutrient losses and improve soil performance. In November 2025, USDA invested USD 6.4 million across seven Organic Transitions awards, strengthening research and adoption capacity for organic production systems.
Future growth will depend on standardized nutrient content, pelletized neem cake, microbial combinations, and organo-mineral formulations. In March 2026, USDA announced USD 66 million for organic-agriculture research, with awards ranging from USD 5,000 to USD 3.5 million. These programs create development opportunities across North America, Europe, Africa, Southeast Asia, and Latin America
Key Takeaways
- The global Neem-Based Fertilizer market was valued at USD 1.8 billion in 2025.
- The global market is projected to grow at a CAGR of 10.3% and is estimated to reach USD 4.7 billion by 2035.
- On the basis of formulation, the Powder Neem-Based Fertilizer dominated the market, constituting 38.5% of the total market share.
- Based on the Crop Type, the Cereals and grains dominated the Neem-Based Fertilizer market, with a substantial market share of around 43.8%.
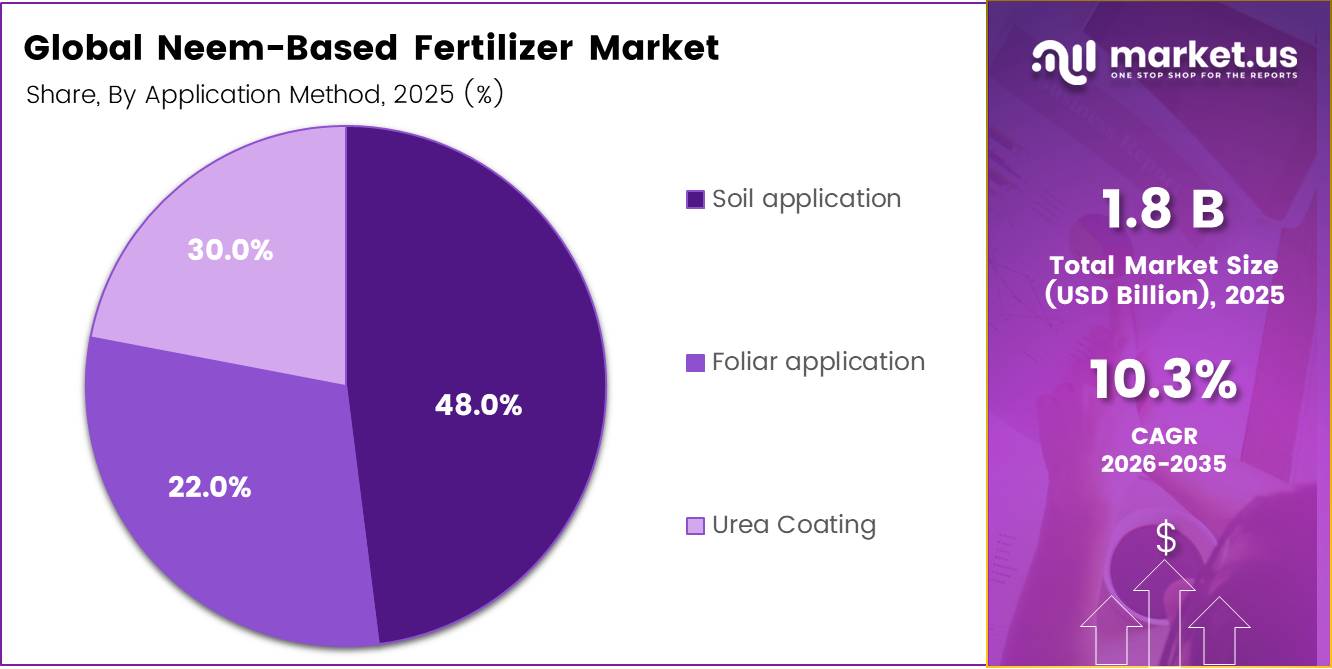
- Based on the application method, Soil application led the market, comprising 48.0% of the total market.
- Among the Distribution Channel, the indirect sales held a major share in the Neem-Based Fertilizer market, 39.8% of the market share.
- In 2025, the Asia Pacific was the most dominant region in the Neem-Based Fertilizer market, accounting for 45.20% of the total global consumption.
Formulation Analysis
Powder Neem-Based Fertilizer represents dominant Segment in the Market.
Powder neem-based fertilizer held the leading position with a 38.50% market share, supported by the established use of neem seed cake as a soil-applied fertilizer. The powder can be mixed directly with soil, compost, manure, or other nutrient inputs, making it practical for farms, nurseries, and broad-acre cultivation. A USAID technical publication confirms that neem cake, produced after oil extraction, is packaged and sold as fertilizer, while neem products are available as dust and wettable-powder formulations. In September 2024, the USDA also announced nearly USD 121 million for specialty-crop and organic-agriculture research, including USD 50.5 million for organic production programs.
Liquid formulations are expanding rapidly because they suit irrigation injection, foliar spraying, and accurately calibrated application systems. USDA Forest Service research states that soluble fertilizer spraying can be faster, more uniform, and easier to calibrate than traditional dry application. In November 2025, USDA-NIFA invested USD 6.4 million through seven Organic Transitions awards, while its FY2026 organic initiative issued three funding opportunities
Crop Type Analysis
Cereals and grains a significant crop type.
Cereals and grains held the leading position in the neem-based fertilizer market, accounting for 43.80% of total application demand. Their leadership is supported by extensive cultivated acreage, recurring nutrient requirements, and the suitability of neem-based inputs for soil application across large fields. In March 2026, the USDA estimated that U.S. farmers intended to plant 95.3 million acres of corn and 43.8 million acres of wheat, highlighting the scale of the grain-production base available to biological fertilizer suppliers. Neem-based formulations can gain further acceptance where growers seek gradual nutrient release and improved soil management.
Fruits and vegetables are emerging as the fastest-growing application because high-value crops support targeted nutrition, organic cultivation, and frequent fertilizer dosing. In 2025, U.S. fresh organic cultivated-blueberry exports increased 54% to a record 13.4 million pounds, indicating strong activity in organically produced fruit. This trend creates opportunities for liquid, soluble, and crop-specific neem fertilizer formulations.
Application Method Analysis
Neem-Based Fertilizer are mostly utilized in Soil Application
Soil application held the leading position in the neem-based fertilizer market, capturing a 48.0% share. The method remains widely preferred because neem cake, powder, and granules can be incorporated into soil alongside compost or mineral nutrients, supporting gradual nutrient availability and routine field preparation. The need for better soil nutrient management remains significant. In 2024, England recorded a nitrogen surplus of 86.3 kilograms per hectare, up 6.8% from 2023, even though total nutrient inputs declined 2.3%. These conditions support demand for soil-focused products that complement conventional fertilizer programs.
Foliar application is emerging as the faster-growing method because liquid neem formulations can be sprayed directly onto crops and integrated with modern application equipment. Growth is particularly promising in fruits, vegetables, nurseries, and other high-value crops. In 2025, USDA increased specialty-crop assistance to USD 2.65 billion, including an additional USD 1.3 billion payment round, indicating strong investment across crops suited to targeted input programs
Distribution Channel Analysis
Indirect sales Is the Most Widely Used Distribution Channel.
Indirect sales held the leading position in the neem-based fertilizer market, capturing a 58.00% share. Distributors, agricultural dealers, cooperatives, and specialist retailers help manufacturers maintain local inventory and reach farmers across widely dispersed agricultural areas. This channel is particularly suitable for fertilizers that require product guidance, bulk handling, and timely seasonal availability. In July 2025, the USDA reported that U.S. farms spent USD 33.8 billion on fertilizers, lime, and soil conditioners during 2024, representing 7.1% of total farm production expenditure. This substantial purchasing base supports established agricultural input-distribution networks.
Direct sales are growing as fertilizer manufacturers adopt online ordering, farm demonstrations, contract supply, and doorstep delivery. Digital channels also allow producers to communicate application instructions directly to buyers. In May 2026, the U.S. Census Bureau reported that first-quarter retail e-commerce sales reached USD 326.7 billion, rising 9.8% from the previous year and accounting for 16.9% of total retail sales.
Key Market Segments
By Formulation
- Powder
- Granular
- Liquid
By Crop Type
- Cereals and grains
- Oilseeds and pulses
- Fruits and vegetables
- Others
By Application Method
- Soil application
- Foliar application
- Urea Coating
By Distribution Channel
- Direct sales
- Indirect sales
- Distributors and wholesalers
- Agricultural cooperatives
- Agrochemical retailers
- Others
Driver Analysis
Organic and natural farming expansion boosting neem input demand
The expansion of organic and natural farming clusters is a core driver because it structurally increases addressable hectares that can legally and commercially use neem-based fertilizers as compliant inputs, with Indian schemes such as Paramparagat Krishi Vikas Yojana (PKVY) and Bharatiya Prakritik Krishi Padhati already supporting organic and natural farming on tens of thousands of hectares at assistance levels of roughly Rs 50,000 per hectare over three years, including incentives for organic inputs.
Similar pushes for chemical-free and low-input farming in Europe and North America translate into premium markets where residue-free and organically certified produce can achieve price uplifts of 10–30% versus conventional crops, increasing farmers’ willingness to invest 5–10% of revenue in specialized inputs such as neem cake, neem-coated urea, and neem biofertilizers.
Drivers Impact Analysis
| Driver | (~) % Impact on CAGR | Geographic Relevance | Impact Timeline |
|---|---|---|---|
| Organic and natural farming expansion boosting neem input demand | +2.3% | India core, EU, North America, APAC corridors | Medium term (2-4 years) |
| Government subsidies and schemes supporting biofertilizers and neem-based inputs | +2.1% | India core, selected APAC and African programs | Medium term (2-4 years) |
| Integrated pest–nutrient management preference favoring neem dual-function products | +1.8% | EU regulatory hubs, North America, Latin America spill-over | Long term (≥ 4 years) |
| Soil health and residue-free export crop requirements driving neem adoption | +1.9% | EU, North America, MENA export belts, India | Short term (≤ 2 years) |
| Rising chemical fertilizer and pesticide cost pushing farmers to neem blends | +1.7% | India, APAC emerging markets, Africa, Latin America | Short term (≤ 2 years) |
| Growth in neem extract and processing capacity improving supply economics | +1.5% | India core, Southeast Asia, Africa neem-growing regions | Long term (≥ 4 years) |
Restraint Analysis
Logistics and supply-chain disruptions for fertilizer distribution
Logistics and supply-chain disruptions for fertilizer distribution act as a restraint because neem-based fertilizers share freight and warehousing networks with other inputs and are therefore exposed to the same shocks—port congestion, container shortages, rising fuel costs, and geopolitical disruptions—that have characterized global fertilizer movements since at least 2022, with supply-chain guides for 2025 explicitly citing ongoing conflicts and regulatory changes as sources of volatility.
While digital tools and diversified supplier strategies can mitigate some of this friction over a 2–4-year horizon, current logistics realities still cap growth below demand potential, justifying around a 1.5 percentage-point drag on CAGR until distribution networks, local warehousing, and risk-management practices for neem-based fertilizers catch up with the new volatility regime.
Restraint Impact Analysis
| Restraint | (~) % Impact on CAGR | Geographic Relevance | Impact Timeline |
|---|---|---|---|
| Limited neem feedstock availability outside core growing regions | -2.2% | North America, EU, non-neem APAC, LatAm | Long term (≥ 4 years) |
| Regulatory complexity and multi-agency approvals for neem-based inputs | -1.9% | India, EU regulatory hubs, North America | Medium term (2-4 years) |
| Price competitiveness versus heavily subsidized chemical fertilizers | -2.4% | India core, APAC emerging, Africa | Short term (≤ 2 years) |
| Fragmented processing capacity and inconsistent product quality | -1.7% | India, Southeast Asia, Africa corridors | Medium term (2-4 years) |
| Limited farmer awareness and agronomic advisory reach | -1.8% | India hinterlands, Africa, LatAm smallholders | Long term (≥ 4 years) |
| Logistics and supply-chain disruptions for fertilizer distribution | -1.5% | APAC logistics corridors, Africa, LatAm | Medium term (2-4 years) |
Opportunity Analysis
High-margin export-grade Neem Fertilizer Programs
High-margin export-grade neem fertilizer programs are a future opportunity because most neem-based fertilizers today target domestic organic segments, whereas export-oriented agriculture faces tightening sustainability and residue requirements that could justify premium, standardized neem input programs aligned with EU and US buyer specifications, with per-hectare input budgets often 20–40% higher than domestic conventional farms.
By building contract farming models where neem fertilizer suppliers co-design input packages for crops such as okra, spices, fruits, or horticultural exports—leveraging evidence that neem treatments can deliver yield uplifts of nearly 300% and pest suppression above 80% in specific trials—players can capture incremental margins of 10–20 percentage points over commodity organic fertilizers while tying volumes to multi-year export contracts.
Opportunity Impact Analysis
| Opportunity | (~) % Potential CAGR Upside | Geographic Relevance | Execution Window |
|---|---|---|---|
| High-margin export-grade neem fertilizer programs | +2.3% | India core, Africa, LatAm export belts, EU/US buyers | Medium term (2-4 years) |
| Localized organic fertilizer factories co-processing neem with agri waste | +2.2% | North America, EU, India, APAC emerging | Long term (≥ 4 years) |
| Digital advisory and input-subscription platforms bundling neem | +2.0% | India, Southeast Asia, Africa smallholder markets | Medium term (2-4 years) |
| Co-developed neem solutions for climate-resilient, regenerative agriculture projects | +1.9% | EU, North America, India, global climate funds | Long term (≥ 4 years) |
| Value-added multi-product neem portfolios (fertilizer + biopesticide + soil amendments) | +2.1% | Asia Pacific core, Africa corridors, LatAm | Medium term (2-4 years) |
| Strategic alliances and M&A roll-ups building global neem supply and brand platforms | +1.7% | Global, with APAC and EU integration hubs | Long term (≥ 4 years) |
Challenges Analysis
Volatile global fertilizer and energy cost environment
The volatility itself forces companies to carry more inventory, hedge freight and energy, and hold working capital buffers, adding 2–4 weeks of average supply-chain lead time and 3–5 percentage points of cost variance that must be absorbed in margins or passed on to farmers. Long-term mitigation requires diversified sourcing, forward energy and freight contracts, regional warehousing, and digital supply-chain tools for forecasting and risk management, all of which take 2–4 years to institutionalize across mid-sized neem producers, making this an ongoing friction that drags potential CAGR by around 1–1.5 percentage points rather than an immediate restraint that halts sales.
Challenges Impact Analysis
| Challenge | (~) % CAGR Friction Drag | Geographic Relevance | Mitigation Horizon |
|---|---|---|---|
| Volatile global fertilizer and energy cost environment | -1.4% | North America core, EU regulatory hubs, APAC logistics corridors | Medium term (2-4 years) |
| Concentrated fertilizer distribution power and channel dependence | -1.2% | North America, India, LatAm, Africa | Long term (≥ 4 years) |
| Seasonal neem fruit supply and extraction efficiency variability | -1.3% | India core, Africa neem belts, Southeast Asia | Long term (≥ 4 years) |
| Technical optimization and standardization of neem extraction processes | -1.0% | India, APAC processing hubs, EU importers | Medium term (2-4 years) |
| Persistent agronomic validation and data-gap issues for diverse crops | -1.1% | India, Africa, LatAm smallholder systems | Long term (≥ 4 years) |
| Regulatory and sustainability compliance uncertainty in global trade | -0.9% | EU regulatory hubs, North America, export-oriented APAC | Medium term (2-4 years) |
Geopolitical Impact Analysis
Geopolitical Fertilizer Dependence Strengthening Neem-Based Supply Chains.
Geopolitical shocks are making mineral fertilizers less predictable for growers. In April 2026, EU nitrogen fertilizer prices were 71% above the 2024 average, while natural gas determines about 70% of nitrogen-production costs. The EU imports around 30% of its nitrogen fertilizers, 70% of phosphatic fertilizers and 40% of potassium fertilizers. This exposure strengthens interest in neem-based products as locally processable complementary inputs.
Raw-material concentration adds another layer of risk. USGS reported 93% U.S. net import reliance for potash in 2024. During 2020–2023, Canada supplied 79% of imports, Russia 11%, Belarus 4%, and Israel 3%. Tariffs, sanctions or border friction involving a small supplier group can quickly affect fertilizer availability and farm budgets.
For neem-based fertilizer producers, the practical opportunity lies in regional residue collection, decentralized cake processing, diversified packaging suppliers and shorter dealer networks. Neem inputs cannot replace essential mineral nutrients, but they can ease procurement pressure, support soil-focused programs and give distributors a more resilient product mix.
Regional Analysis
Asia Pacific Held the Largest Share of the Global Neem-Based Fertilizer Market.
Asia-Pacific held the leading position in the neem-based fertilizer market, capturing a 45.20% share. Its dominance is supported by extensive crop cultivation, high soil-input requirements, and growing regulatory attention toward plant-derived agricultural products. In 2025, China cultivated 119.41 million hectares of grain and produced 714.88 million tonnes, representing annual growth of 1.2%. China also introduced phytosanitary requirements for imported plant-derived fertilizers in January 2025, indicating more formal oversight of botanical inputs.
North America is emerging as the faster-growing region as organic producers, distributors, and agricultural programs expand access to alternative soil inputs. In August 2024, the USDA awarded USD 9.7 million to 13 projects, bringing Organic Market Development Grant investment to USD 85 million. These projects support organic processing, storage, transportation, distribution, and market capacity, creating stronger channels for neem-based fertilizer suppliers.
Key Regions and Countries Covered
- North America
- The US
- Canada
- Europe
- Germany
- France
- The UK
- Spain
- Italy
- Russia & CIS
- Rest of Europe
- APAC
- China
- Japan
- South Korea
- India
- ASEAN
- Rest of APAC
- Latin America
- Brazil
- Mexico
- Rest of Latin America
- Middle East & Africa
- GCC
- South Africa
- Rest of MEA
Key Players Analysis
Neem-Based Fertilizer manufacturers focus on improving product consistency, nutrient efficiency, and raw material integration to strengthen market competitiveness. A key priority is formulation development, including powdered, granular, liquid, and coated products that support controlled nutrient release, soil conditioning, and more convenient field application. Companies increasingly invest in modern extraction, drying, blending, and granulation facilities to maintain stable quality and reduce variation in neem cake and oil-based inputs.
Integration with neem seed suppliers, oil processors, and agricultural cooperatives helps secure feedstock availability and control production costs during seasonal supply fluctuations. Strategic expansion across major farming regions enables manufacturers to remain closer to crop demand and lower transportation expenses. Additionally, producers emphasize quality testing, organic certification, residue management, and standardized nutrient composition to build farmer confidence, while developing distributor partnerships and direct farm relationships to improve market reach and strengthen their position in cereals, horticulture, and high-value crop applications.
The Major Players In The Industry
- Coromandel International Limited (E.I.D. Parry)
- Indian Farmers Fertiliser Cooperative Limited (IFFCO)
- National Fertilizers Limited
- Parker Biotech Private Limited
- Agro Extracts Limited
- J. Margo Private Limited
- Fortune Biotech Limited
- Ozone Biotech
- GreeNeem Agri Private Limited
- Trifolio-M GmbH
- Neeming Australia Pty Ltd.
- Nikita Agro Industries
- Gramin India Agri BusiNest
- Bros India Group
- Neem India Products Private Limited
Key Development
- In April 2025, Coromandel International Limited signed a long-term supply MoU with Ma’aden while expanding phosphate-fertilizer capacity from 6 million tonnes to 9 million tonnes, representing a 50% increase and strengthening its crop-nutrition supply base.
- In May 2025, IFFCO partnered with FDRVC to supply nano, specialty, and organic inputs through more than 800 Farmer Producer Organizations, potentially reaching over 1 million farmers across organized agricultural networks.
Report Scope
| Report Features | Description |
|---|---|
| Market Value (2025) | USD 1.8 Bn |
| Forecast Revenue (2035) | USD 4.7 Bn |
| CAGR (2026-2035) | 10.3% |
| Base Year for Estimation | 2025 |
| Historic Period | 2020-2024 |
| Forecast Period | 2026-2035 |
| Report Coverage | Revenue Forecast, Market Dynamics, Competitive Landscape, Recent Developments |
| Segments Covered | By Formulation (Powder, Granular and Liquid), By Crop Type (Cereals and grains, Oilseeds and pulses, Fruits and vegetables and Others), By Application Method (Soil application, Foliar application and Urea Coating), By Distribution Channel (Direct sales and Indirect sales) |
| Regional Analysis | North America – The US & Canada; Europe – Germany, France, The UK, Spain, Italy, Russia & CIS, Rest of Europe; APAC– China, Japan, South Korea, India, ASEAN & Rest of APAC; Latin America– Brazil, Mexico & Rest of Latin America; Middle East & Africa– GCC, South Africa, & Rest of MEA |
| Competitive Landscape | Coromandel International Limited (E.I.D. Parry), Indian Farmers Fertiliser Cooperative Limited (IFFCO), National Fertilizers Limited, Parker Biotech Private Limited, Agro Extracts Limited, P.J. Margo Private Limited, Fortune Biotech Limited, Ozone Biotech, GreeNeem Agri Private Limited, Trifolio-M GmbH, Neeming Australia Pty Ltd., Nikita Agro Industries, Gramin India Agri BusiNest, Bros India Group, Neem India Products Private Limited. |
| Customization Scope | Customization for segments, region/country-level will be provided. Moreover, additional customization can be done based on the requirements. |
| Purchase Options | We have three licenses to opt for: Single User License, Multi-User License (Up to 5 Users), Corporate Use License (Unlimited Users and Printable PDF) |





































