


Report Overview
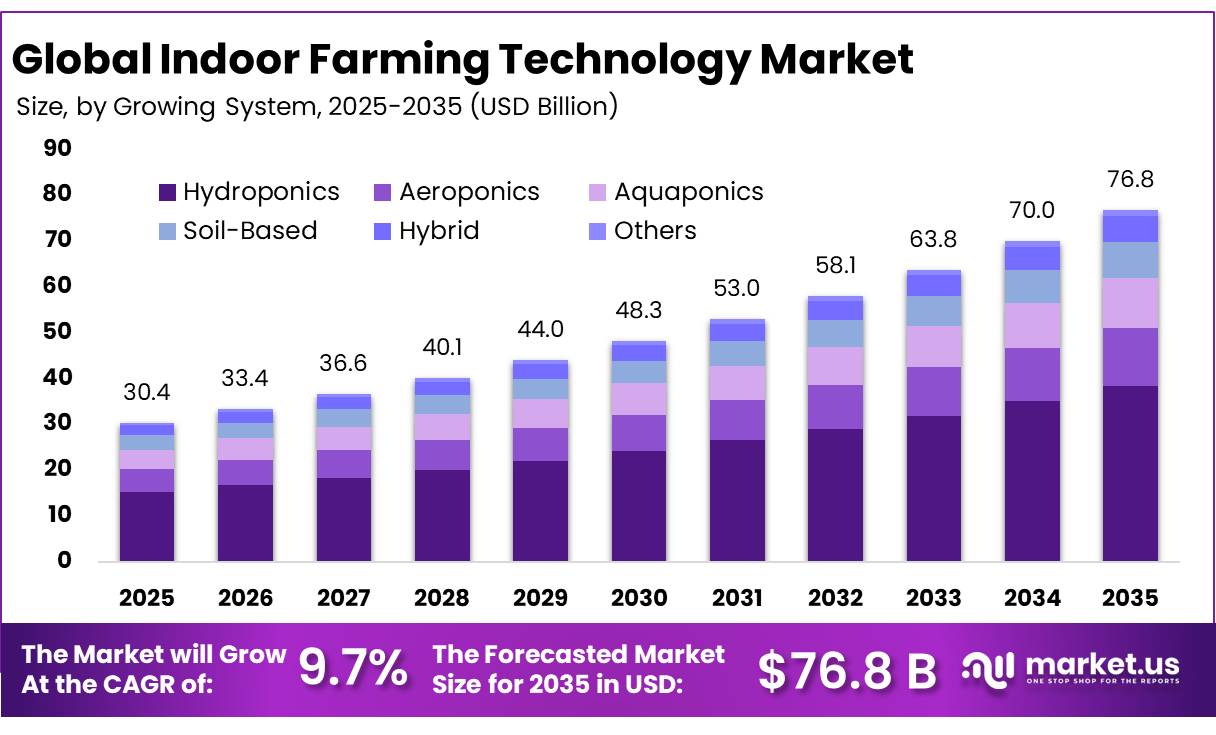
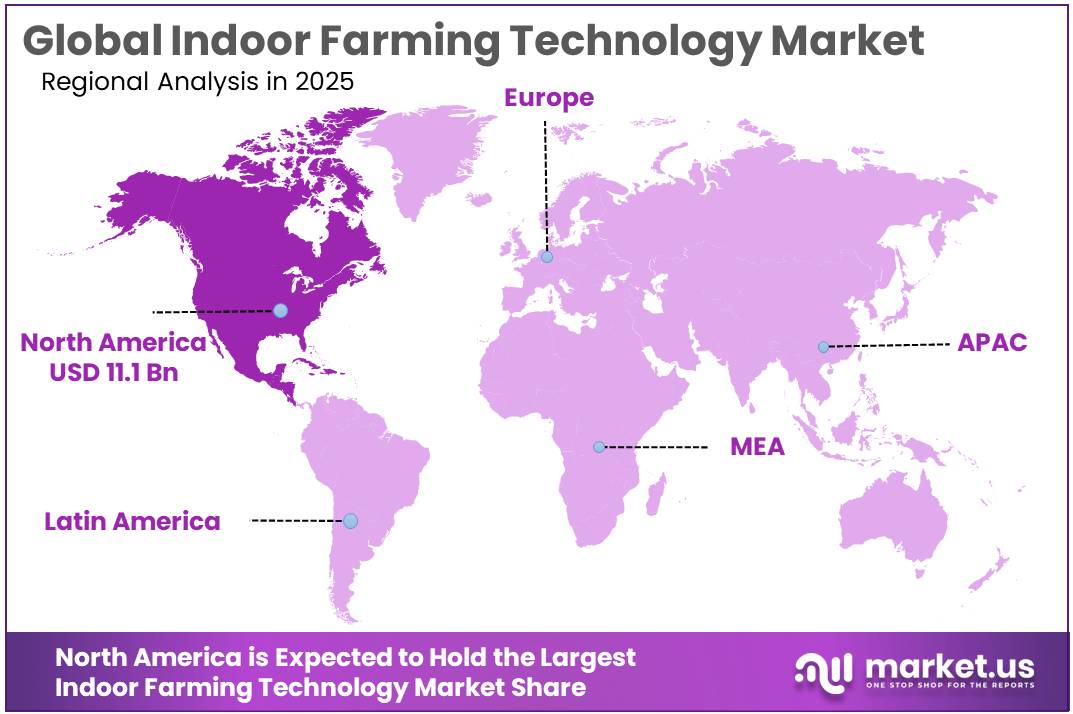
The Global Indoor Farming Technology Market size is expected to be worth around USD 76.8 Billion by 2035, from USD 30.4 Billion in 2025, growing at a CAGR of 9.7% during the forecast period from 2026 to 2035. In 2025, North America held a dominant market position, capturing more than a 36.50% share, holding USD 11.1 Billion revenue.
Indoor farming technology is developing into an important part of modern controlled-environment agriculture, where crops are produced inside greenhouses, vertical farms, warehouses, and other enclosed facilities. These farms combine hydroponics, aeroponics, aquaponics, LED lighting, climate-control systems, sensors, automation, robotics, and data-based crop management.
- FAO reported in 2025 that commercial urban agriculture, including advanced greenhouses and indoor vertical farms, had developed into an industry worth more than USD 5 billion globally. Its study incorporated discussions involving around 950 participants, representing nearly 200 companies across 65 countries. Nearly 50% of high-technology farming identified in the study was carried out through vertical farms operating in large, fully controlled environments. These facilities increasingly use robotics, remote-control systems, LED lighting, hydroponics, and automated heating and cooling equipment.
Water efficiency is one of the strongest factors encouraging the adoption of indoor farming systems. FAO states that hydroponic cultivation can use up to 90% less water than conventional cultivation because water and nutrients can be circulated through closed or semi-closed production systems. A 2024 study indexed through FAO AGRIS similarly found that hydroponic systems could reduce water use by more than 90% and fertilizer consumption by around 60%, depending on crop type and production configuration. These savings make indoor cultivation increasingly relevant where freshwater availability and productive agricultural land are under pressure.
- Government data also show the scale of protected-production infrastructure. USDA’s 2024 Census of Horticultural Specialties, published in 2026, recorded 23,060 horticultural operations generating USD 18.3 billion in U.S. horticultural sales. The country contained approximately 866 million square feet of greenhouse production space and another 38 million square feet of fixed enclosed structures in 2024. These figures demonstrate an established physical base on which advanced lighting, fertigation, automation, sensing, and climate-management technologies can expand.
Public investment is also supporting future technology development. The U.S. Department of Energy announced USD 2.5 million for technologies and business models supporting controlled-environment agriculture, with emphasis on reducing land, water, transportation, and energy-related pressures. In Europe, the 2025 Horizon Europe programme allocated an indicative EUR 6 million specifically to research exploring the potential of controlled-environment agriculture.
Key Takeaways
- Indoor Farming Technology Market size is expected to be worth around USD 76.8 Billion by 2035, from USD 30.4 Billion in 2025, growing at a CAGR of 9.7% .
- Hydroponics held a dominant market position, capturing more than a 50.00% share.
- Glass or Poly Greenhouses held a dominant market position, capturing more than a 71.00% share.
- Hardware held a dominant market position, capturing more than a 60.10% share.
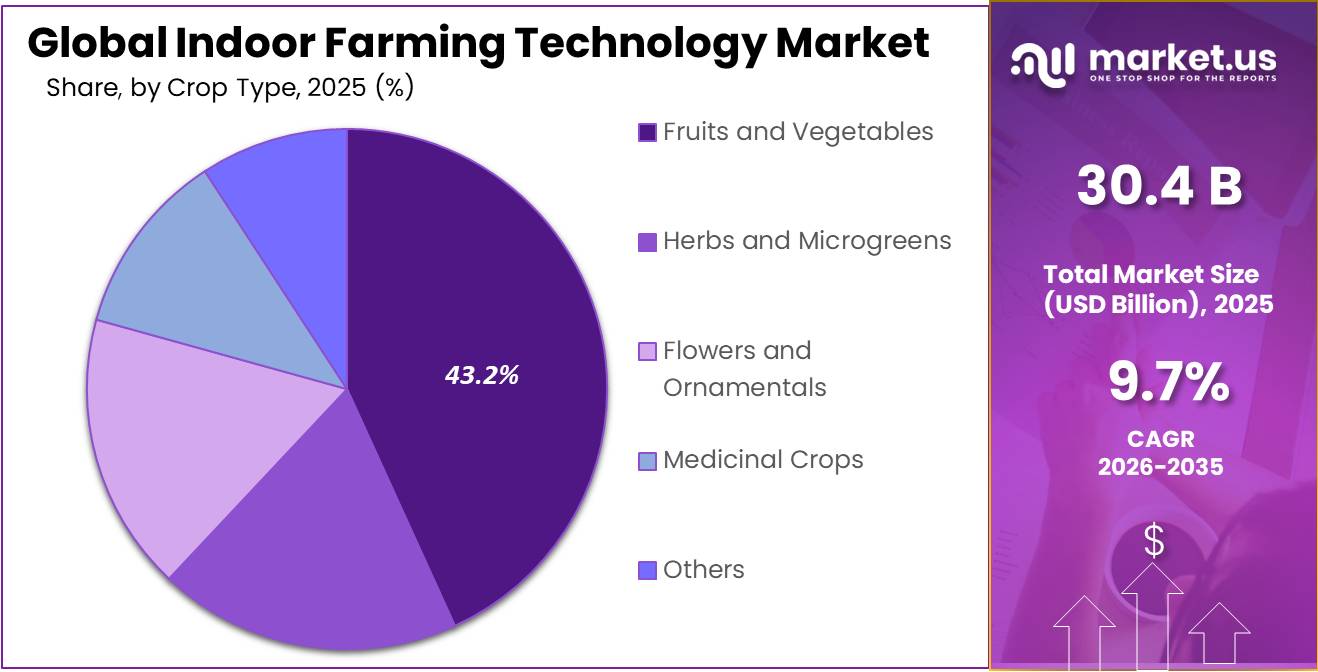
- Fruits and Vegetables held a dominant market position, capturing more than a 43.00% share.
- North America held a dominant position in the Indoor Farming Technology Market, capturing more than a 36.50% share and reaching approximately USD 11.11 billion.
By Growing System Analysis
Hydroponics Leads with More Than 50.00% Share, Supported by Efficient Water and Nutrient Management
In 2025, “Hydroponics” held a dominant market position, capturing more than a 50.00% share. The segment remained widely used in indoor farming because plants can be grown directly in a water-based nutrient solution without soil, allowing growers to manage nutrients, irrigation, temperature, and root conditions more closely. The U.S. Department of Agriculture describes hydroponics as a production method used by commercial enterprises as well as smaller growers, with plants supported through water-based nutrient solutions and materials such as coconut coir, perlite, or vermiculite.
Government-backed research highlights its resource-efficiency potential. NASA reports that aeroponic systems can reduce water consumption by around 98% and fertilizer use by approximately 60% compared with conventional production approaches. NASA-supported work also reported an 80% increase in dry-weight biomass per square metre under certain aeroponic trials compared with hydroponic and soil-based production.
Aeroponics is developing as an advanced growing system within the Indoor Farming Technology Market because it allows plant roots to remain suspended in air while receiving nutrients through a controlled mist or spray. The approach can reduce dependence on growing media and gives operators closer control over moisture, nutrient delivery, airflow, and root-zone conditions. It is particularly suitable for vertical farms, container farms, research facilities, seedling production, and high-density indoor growing operations.
By Facility Type Analysis
Glass or Poly Greenhouses Lead with More Than 71.00% Share, Supported by Large Protected-Cultivation Infrastructure
In 2025, “Glass or Poly Greenhouses” held a dominant market position, capturing more than a 71.00% share. Glass and polyethylene-covered greenhouses remain widely used in indoor farming because they combine natural sunlight with controlled irrigation, heating, ventilation, humidity management, and crop-protection systems. Their established infrastructure also makes it easier for growers to add hydroponics, sensors, automated fertigation, supplemental LED lighting, and climate-control equipment without moving completely to artificial-light production.
Government statistics show the scale of this protected-production base. According to the USDA 2024 Census of Horticultural Specialties, released in February 2026, U.S. growers operated around 866 million square feet of greenhouse area. This included approximately 637 million square feet covered with plastic film, 114 million square feet of glass-covered greenhouse space, and 116 million square feet using rigid plastic materials. These figures indicate that poly and glass structures continue to provide a substantial physical platform for controlled-environment crop production.
Indoor Vertical Farms are emerging as an advanced facility type in the Indoor Farming Technology Market, particularly where land availability, water efficiency, crop consistency, and year-round production are important. These facilities grow crops on vertically arranged layers inside warehouses, purpose-built structures, or other enclosed environments.
By Component Analysis
Hardware Leads with More Than 60.10% Share, Driven by Lighting, Sensors, Irrigation, and Climate-Control Equipment
In 2025, “Hardware” held a dominant market position, capturing more than a 60.10% share. Hardware remains the core part of indoor farming systems because every controlled growing facility depends on physical equipment such as LED lights, irrigation units, nutrient dosing systems, HVAC equipment, sensors, pumps, climate controllers, racks, and automated handling systems. These components help growers maintain stable temperature, humidity, light, water, airflow, and nutrient conditions throughout the production cycle.
Government-backed research continues to strengthen the role of physical farming equipment. In 2025, USDA Agricultural Research Service projects focused on developing measurement systems for lighting and airflow in controlled environments, while also improving water-management and treatment technologies for greenhouse and soilless crop production.
Software is becoming an important component of the Indoor Farming Technology Market as growers increasingly depend on digital platforms to monitor lighting, irrigation, nutrient dosing, temperature, humidity, airflow, and crop performance. These platforms collect information from connected sensors and convert it into operational data that can be used to adjust growing conditions automatically or guide farm managers in real time.
By Crop Type Analysis
Fruits and Vegetables Lead with More Than 43.00% Share, Supported by Strong Demand for Fresh, Year-Round Produce
In 2025, “Fruits and Vegetables” held a dominant market position, capturing more than a 43.00% share. Fruits and vegetables remain well suited to indoor farming because growers can manage light, temperature, irrigation, nutrients, humidity, and crop protection throughout the year. Tomatoes, lettuce, cucumbers, peppers, strawberries, and leafy vegetables are particularly suitable for greenhouse, hydroponic, and other controlled-environment systems because consistent growing conditions can support uniform quality and predictable harvest schedules.
Government data underline the commercial importance of crops commonly produced through controlled-environment agriculture. The USDA Vegetables 2025 Summary, published in February 2026, reported U.S. romaine lettuce production of 46.7 million cwt during 2025, while leaf lettuce production reached 16.1 million cwt and cucumber production totaled 14.3 million cwt. These crops are increasingly relevant to indoor farming because their high fresh-market demand and relatively frequent harvesting make controlled production commercially attractive.
Herbs and Microgreens are developing as an attractive crop category within the Indoor Farming Technology Market due to their compact size, short production cycles, high planting density, and suitability for controlled environments. Basil, parsley, cilantro, mint, specialty herbs, and different microgreen varieties can be produced on stacked growing systems using LED lighting, hydroponics, automated irrigation, and precise environmental controls.
Key Market Segments
By Growing System
- Hydroponics
- Aeroponics
- Aquaponics
- Soil-Based
- Hybrid
- Others
By Facility Type
- Glass or Poly Greenhouses
- Indoor Vertical Farms
- Container Farms
- Indoor Deep-Water Culture Systems
- Others
By Component
- Hardware
- Software
- Services
By Crop Type
- Fruits and Vegetables
- Herbs and Microgreens
- Flowers and Ornamentals
- Medicinal Crops
- Others
Driver Analysis
Climate-Resilient Production Systems
Increasing weather volatility converts controlled-environment agriculture (CEA) from a yield-enhancement option into a continuity asset for retailers, food-service buyers, seed companies and specialty-crop producers: FAO identifies unpredictable rainfall, heat, drought, floods, pests and disease as direct threats to agrifood systems, while a 2025 FAO–WMO assessment reported that a single heatwave can cut agricultural productivity by as much as 50%, 470 billion labor hours were lost to extreme heat in 2021, and each additional 1°C of warming could reduce maize and wheat yields by 4–10%.
Indoor systems cannot economically replace broad-acre grain production, but they can protect high-value leafy greens, herbs, tomatoes, berries, seedlings and pharmaceutical or seed crops through year-round temperature, humidity, light, CO2 and nutrient control; USDA-linked analysis notes that CEA can operate in diverse environments, support year-round harvests, shorten crop cycles and reduce exposure to damaging weather and pests. The commercial mechanism is therefore a shift from one-time equipment procurement toward resilience contracts: modular climate rooms, redundant chillers, disease-monitoring sensors, crop-model software, remote agronomy and uptime service-level agreements are purchased against avoided stock-outs and rejected deliveries, not simply against yield per square metre.
A buyer that loses 20% of a 1,000-tonne seasonal specialty-crop programme to heat has 200 tonnes of exposure; moving even 10–15% of that programme into protected capacity creates recurring demand for controls, HVAC, lighting and service while diversifying rather than replacing field supply. Given the widening frequency of weather shocks but the multi-year permitting, power and crop-economics work required for CEA deployment, this is assigned the largest incremental CAGR contribution, approximately +2.4 percentage points over 2026–2031, with strongest value capture in climate-control integration, biological risk management and performance-guaranteed after-sales services rather than undifferentiated farm structures.
Drivers Impact Analysis
| Driver | (~) % Impact on CAGR Forecast | Geographic Relevance | Impact Timeline |
|---|---|---|---|
| Climate-resilient production | +2.4% | North America, EU, MENA, APAC | Long term (≥ 4 years) |
| LED efficiency upgrade | +1.9% | North America, EU, East Asia | Medium term (2–4 years) |
| Water-efficient hydroponics | +1.7% | MENA, India, China, US West | Long term (≥ 4 years) |
| AI and labor automation | +1.5% | North America, EU, Japan, Korea | Medium term (2–4 years) |
| Urban localized supply | +1.3% | APAC cities, EU, North America | Long term (≥ 4 years) |
| Residue and traceability compliance | +1.0% | EU core, North America, export APAC | Short term (≤ 2 years) |
Restraint Analysis
Power-Cost Exposure
Indoor farms substitute purchased electricity for sunlight and substantial portions of natural ventilation, making lighting, cooling, heating, air movement and dehumidification a structurally unavoidable operating-cost block rather than a temporary inefficiency: a peer-reviewed 2025 analysis cites an operating commercial farm consuming approximately 5 million kWh to produce 500,000 kg of lettuce, or 10 kWh/kg, while other published operating studies place enclosed lettuce production near 10–18 kWh/kg and measured seasonal cases at 29.6–43.9 kWh/kg.
At the efficient 10-kWh/kg case, the 2025 US commercial tariff of 13.41 cents/kWh embeds $1.34/kg of electricity before seed, nutrients, labor, packaging, rent, depreciation and distribution; at the EU’s second-half 2025 non-household average of €0.1837/kWh, the same load costs €1.84/kg, rising to €2.55/kg in Ireland and €2.26/kg in Germany, while a 10-million-kWh site faces an annual power bill of about $1.34 million in the US or €1.84 million at the EU mean. LED conversion can reduce lighting electricity by 24–30%, but it cannot remove plant photon requirements or the latent HVAC load from transpiration, and research finds artificial lighting can represent almost 0–95% of facility energy depending on architecture, crop and climate.
Consequently, a $0.03/kWh tariff increase adds $0.30/kg at 10 kWh/kg and can consume a large share of leafy-greens gross margin; vendors then face cancelled expansions, requests for guaranteed kWh/kg and delayed fixture, HVAC and automation replacements. The modeled -2.4-percentage-point CAGR impact is the largest restraint because unfavorable power economics can render an otherwise technically productive site non-bankable for more than four years, shifting technology demand toward sun-assisted greenhouses, waste-heat integration and low-tariff regions while destroying addressable demand for fully enclosed farms in high-cost grids.
Restraint Impact Analysis
| Restraint | (~) % Impact on CAGR Forecast | Geographic Relevance | Impact Timeline |
|---|---|---|---|
| Power-Cost Exposure | -2.4% | EU, North America, Japan | Long term (≥ 4 years) |
| Capital and Debt Burden | -2.1% | North America, EU, APAC | Medium term (2–4 years) |
| Narrow Crop Economics | -1.6% | Global vertical farms | Long term (≥ 4 years) |
| Weak Premium Capture | -1.2% | North America, EU | Medium term (2–4 years) |
| Grid Access Delays | -1.0% | EU hubs, US metros, APAC cities | Long term (≥ 4 years) |
| Hardware Tariff Inflation | -0.8% | US core, China-linked chains | Short term (≤ 2 years) |
Opportunity Analysis
Greenhouse Retrofit Stack
The largest near-term white space is not building more capital-heavy vertical farms but converting the extensive installed greenhouse base into a recurring smart-technology customer pool: the Netherlands alone operated approximately 10,000 hectares of greenhouse cultivation in 2024, 94% of which already used biological pest control, while the 2022 US agricultural census separately tracks a large and fragmented protected-crop base and more than 7,000 US protected-crop producers operate below 3,000 ft². This is an opportunity rather than a current driver because most revenue today is attached to new-build equipment or isolated replacements; vendors have not yet standardized a vendor-neutral retrofit package combining wireless sensors, edge controls, variable-speed HVAC and pumps, supplemental LEDs, fertigation optimization, machine vision and subscription agronomy across legacy brands.
A modeled conversion of only 5% of the Dutch area—500 hectares or 5 million m²—at an average $35/m² hardware-and-integration ticket creates roughly $175 million of project revenue before software; adding $1.50/m² per month for controls, diagnostics and crop analytics produces $90 million of annual recurring revenue, and rolling the architecture into larger EU, North American and East Asian greenhouse corridors multiplies that addressable pool.
The customer case can be underwritten against measurable savings: a five-year US greenhouse case reduced weather-adjusted propane consumption by 65% using a specialized heating system alone and by 45% when combined with the incumbent unit heater, indicating sufficient efficiency headroom for performance-linked retrofits.
Commercial execution requires open BACnet/Modbus gateways, crop-specific commissioning templates, financing against verified utility savings and a channel of greenhouse installers rather than costly direct sales; this can shorten deployment to weeks, lower customer-acquisition cost through distributor portfolios and lift supplier lifetime value through 5–10-year software and service contracts. Successful penetration therefore adds an estimated 2.2 percentage points above baseline CAGR while shifting market economics from irregular capital projects toward repeatable retrofit kits and recurring digital gross margin.
Opportunity Impact Analysis
| Opportunity | (~) % Potential CAGR Upside | Geographic Relevance | Execution Window |
|---|---|---|---|
| Greenhouse Retrofit Stack | +2.2% | EU, North America, East Asia | Short term (≤ 2 years) |
| Farm-Tech-as-a-Service | +1.8% | North America, EU, GCC, India | Short term (≤ 2 years) |
| Propagation and Speed Breeding | +1.5% | EU, North America, APAC | Medium term (2–4 years) |
| Bioactive Crop Platforms | +1.3% | US, EU, Japan, Singapore | Long term (≥ 4 years) |
| Energy-Grid Monetization | +1.1% | EU, Canada, US, Japan | Medium term (2–4 years) |
| Distressed-Asset Roll-Ups | +0.9% | US, UK, EU | Short term (≤ 2 years) |
Challenges Analysis
Cross-System Integration
Indoor farms increasingly combine LEDs, fertigation skids, HVAC/dehumidification, CO₂ dosing, machine vision, robots, building-management systems and crop-management software from different suppliers, yet a 2025 systematic review identified 27 distinct smart-agriculture integration challenges spanning organizational, technical and data-governance layers, with data-governance issues alone representing 27% of observed challenge occurrences and incompatible formats, protocols and embedded procedures remaining a central barrier.
The operational penalty is not merely an IT inconvenience: low-cost CO₂ sensors tested across price tiers produced a mean pre-calibration RMSE of 27.57 ppm, while ensemble correction improved accuracy by about 65%; separate long-duration work found biases reaching 27.9 ppm over two years and recommended calibration at least every three to six months to maintain approximately 5 ppm accuracy. In a tightly coupled farm, inconsistent timestamps, proprietary APIs or drifting sensors can make lighting, vapor-pressure deficit, nutrient EC and cooling controls optimize against different versions of reality, increasing commissioning cycles, engineering change orders and false alarms while weakening multi-site recipe transfer.
The modeled -1.4 percentage-point drag reflects deferred controller, sensor and analytics upgrades when buyers cannot verify compatibility or avoid vendor lock-in, rather than an immediate sales prohibition; vendors can compress the drag through protocol gateways, published APIs, common semantic models, device-level calibration records, digital commissioning and performance contracts that tie software fees to verified kWh/kg, yield and uptime outcomes.
Challenges Impact Analysis
| Challenge | (~) % CAGR Friction Drag | Geographic Relevance | Mitigation Horizon |
|---|---|---|---|
| Cross-System Integration | -1.4 pp | North America, EU, East Asia | Medium term (2–4 years) |
| Hybrid Skills Deficit | -1.3 pp | North America, EU, GCC, APAC | Long term (≥4 years) |
| Yield-Recipe Variability | -1.2 pp | Global vertical-farm hubs | Medium term (2–4 years) |
| Recirculation Biosecurity Risk | -1.0 pp | North America, EU, Asia | Long term (≥4 years) |
| Component Lifecycle Exposure | -0.9 pp | North America, EU, import-led APAC | Medium term (2–4 years) |
| Connected-Farm Cyber Risk | -0.7 pp | North America, EU, advanced APAC | Long term (≥4 years) |
Geopolitical Impact Analysis
The ongoing 2026 Middle East war is creating fresh cost and supply-chain pressure for the Indoor Farming Technology market, mainly through higher electricity, natural gas, fertilizer, and equipment costs. Indoor farms depend heavily on continuous power for LED lighting, cooling, heating, ventilation, pumps, sensors, and automated nutrient systems.
- The International Energy Agency reported in July 2026 that disruptions linked to the Middle East conflict pushed natural gas prices in Asia and Europe to their highest levels since the 2022–2023 energy crisis, while nearly 20% of global LNG supply was temporarily affected.
This pressure is particularly important for energy-intensive vertical farms and greenhouse operators. The World Bank expects global energy prices to rise by 24% in 2026, while fertilizer prices are projected to increase by more than 30% amid disruptions around the Strait of Hormuz.
FAO also warned in 2026 that the conflict is disrupting energy and fertilizer trade and increasing agricultural input costs worldwide. These conditions may slow new indoor-farm investments where electricity costs are already high, but they are also encouraging operators to adopt renewable power, energy-efficient LEDs, closed-loop nutrient systems, automation, and local production models. Indoor farming can therefore gain strategic importance by reducing dependence on long-distance food supply chains during geopolitical disruption.
Regional Insights
North America Leads the Indoor Farming Technology 36.50% Share and USD 11.11 Billion
In 2025, North America held a dominant position in the Indoor Farming Technology Market, capturing more than a 36.50% share and reaching approximately USD 11.11 billion in value. The region benefits from established controlled-environment agriculture, strong technology adoption, and investment in hydroponics, greenhouse automation, sensors, LED lighting, and climate-management systems.
According to the USDA, U.S. horticultural operations generated USD 18.3 billion in sales during 2024, while food crops produced under protection generated USD 1.01 billion, increasing 44% compared with 2019. These indicators demonstrate a strong commercial base for further indoor-farming technology adoption.
North America maintains its leading position because growers increasingly use controlled environments to reduce weather risk, improve crop consistency, and locate fresh-food production closer to cities. In 2026, USDA’s National Institute of Food and Agriculture announced USD 4 million in funding for Urban, Indoor, and Emerging Agriculture projects, with individual awards ranging from USD 50,000 to USD 500,000. USDA also reported in 2025 that U.S. demand for culinary herbs was increasing by as much as 10% annually, while fresh-herb imports exceeded USD 294 million each year, supporting further investment in local greenhouse and indoor production.
Asia Pacific is positioned as a fast-expanding region as governments support smart greenhouses, vertical farming, automation, and data-driven agriculture. In 2025, Japan’s Ministry of Agriculture promoted smart-greenhouse programmes focused on data-driven production, while official projections indicate that the country’s core agricultural workforce could fall to around one-quarter of its present level over the next 20 years, increasing the need for automation.
Key Regions and Countries Insights
- North America
- US
- Canada
- Europe
- Germany
- France
- The UK
- Spain
- Italy
- Rest of Europe
- Asia Pacific
- China
- Japan
- South Korea
- India
- Australia
- Rest of APAC
- Latin America
- Brazil
- Mexico
- Rest of Latin America
- Middle East & Africa
- GCC
- South Africa
- Rest of MEA
Key Players Analysis
Signify Holding plays an important role in indoor farming through professional LED lighting and connected lighting systems designed for controlled crop production. In 2025, Signify generated EUR 5.8 billion in sales, employed around 27,000 people, and operated across more than 70 markets. Its horticulture lighting portfolio supports growers in managing light intensity, crop growth, and energy use inside greenhouses and vertical farms. These capabilities strengthen Signify’s position in the hardware side of indoor farming technology. Signify Australia
Netafim Ltd., part of Orbia’s Precision Agriculture business, supports indoor and greenhouse farming through drip irrigation, fertigation, filtration, valves, pumps, digital monitoring, and automated water-management systems. In 2025, Orbia’s Precision Agriculture business generated approximately USD 1.095 billion in sales and employed 4,552 people. It operated 18 production sites plus 2 recycling plants, while serving more than 100 countries. These resources give Netafim a strong base for precision irrigation and controlled-environment farming projects worldwide.
Priva B.V. is a key technology supplier for indoor farms and high-tech greenhouses, with solutions covering climate control, irrigation, process computers, sensors, and cloud-based farm management. Its systems monitor major growing variables including temperature, humidity, light, and CO₂, while integrated platforms also manage water and energy use from a single digital environment. Priva’s indoor-growing technology combines intelligent controllers, sensor networks, and remote monitoring, helping operators maintain stable conditions and automate production across controlled cultivation facilities.
Top Key Players Outlook
- Signify Holding
- Netafim Ltd.
- Priva B.V.
- Argus Control Systems Ltd.
- Heliospectra AB
- Scotts Company LLC
- EVERLIGHT Electronics Co., Ltd.
- Certhon B.V.
- Ridder Group
- Hoogendoorn Growth Management
- LOGIQS B.V.
- Freight Farms, Inc.
- Intelligent Growth Solutions Ltd.
- CubicFarm Systems Corp.
- SANANBIO
Recent Developments
- In April 2026, Heliospectra reported SEK 6.23 million in first-quarter order intake and SEK 5.15 million in net sales, introduced the new MITRA VF 4-channel lighting solution, and secured a roughly SEK 1.3 million project with New Zealand’s Plant & Food Research.
- EVERLIGHT reported NT$1.80 billion in consolidated revenue in January 2026, up 11.86% year over year, followed by NT$1.75 billion in April 2026.
Report Scope
| Report Features | Description |
|---|---|
| Market Value (2025) | USD 30.4 Bn |
| Forecast Revenue (2035) | USD 76.8 Bn |
| CAGR (2026-2035) | 9.7% |
| Base Year for Estimation | 2025 |
| Historic Period | 2020-2024 |
| Forecast Period | 2026-2035 |
| Report Coverage | Revenue Forecast, Market Dynamics, Competitive Landscape, Recent Developments |
| Segments Covered | By Growing System (Hydroponics, Aeroponics, Aquaponics, Soil-Based, Hybrid, Others), By Facility Type (Glass or Poly Greenhouses, Indoor Vertical Farms, Container Farms, Indoor Deep-Water Culture Systems, Others), By Component (Hardware, Software, Services), By Crop Type ( Fruits and Vegetables, Herbs and Microgreens, Flowers and Ornamentals, Medicinal Crops, Others) |
| Regional Analysis | North America – US, Canada; Europe – Germany, France, The UK, Spain, Italy, Rest of Europe; Asia Pacific – China, Japan, South Korea, India, Australia, Singapore, Rest of APAC; Latin America – Brazil, Mexico, Rest of Latin America; Middle East & Africa – GCC, South Africa, Rest of MEA |
| Competitive Landscape | Signify Holding, Netafim Ltd., Priva B.V., Argus Control Systems Ltd., Heliospectra AB, Scotts Company LLC, EVERLIGHT Electronics Co., Ltd., Certhon B.V., Ridder Group, Hoogendoorn Growth Management, LOGIQS B.V., Freight Farms, Inc., Intelligent Growth Solutions Ltd., CubicFarm Systems Corp., SANANBIO |
| Customization Scope | Customization for segments, region/country-level will be provided. Moreover, additional customization can be done based on the requirements. |
| Purchase Options | We have three licenses to opt for: Single User License, Multi-User License (Up to 5 Users), Corporate Use License (Unlimited User and Printable PDF) |





































