


Report Overview
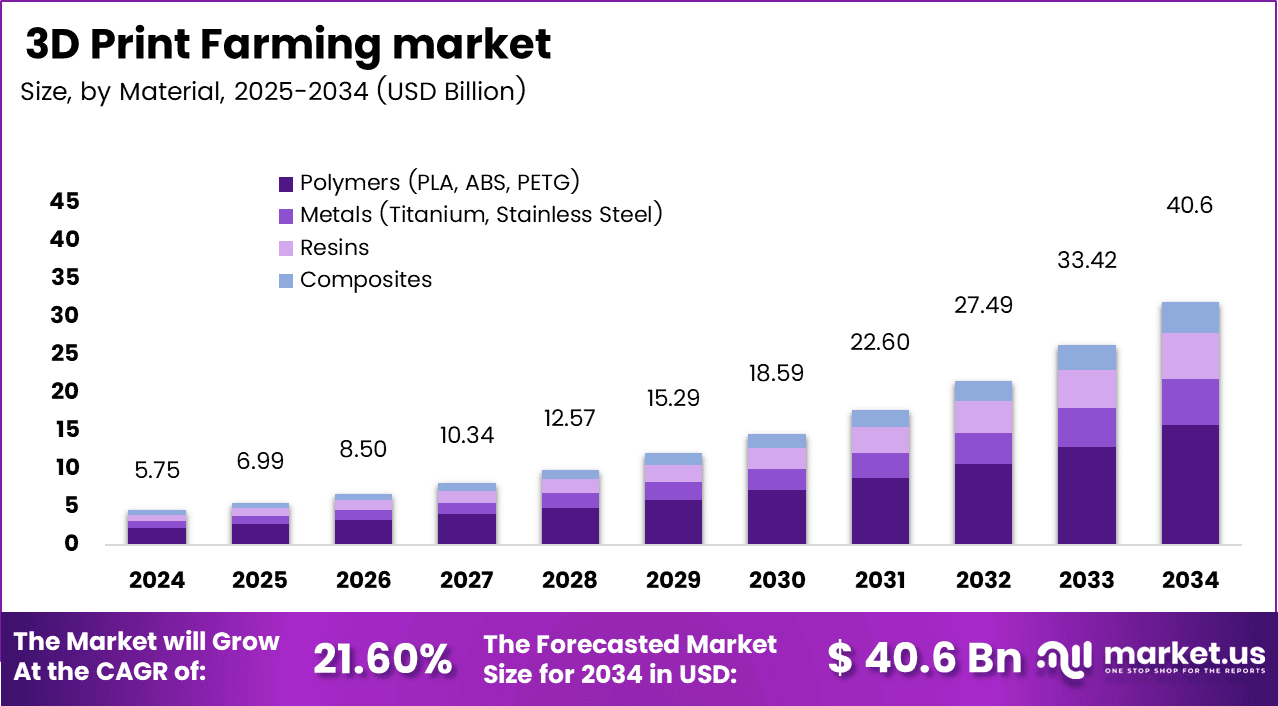
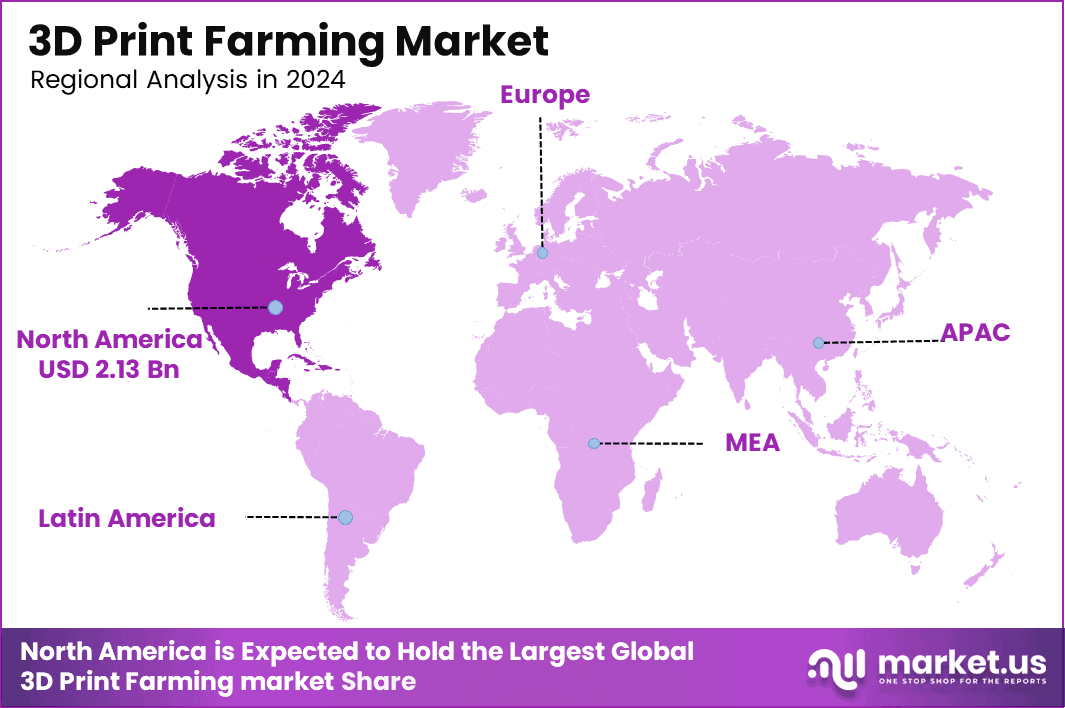
In 2024, the 3D Print Farming Market was valued at USD 5.7 billion. The market is projected to grow at a CAGR of 21.6% from 2025 to 2034, reaching approximately USD 40.6 billion by 2034. North America dominated the global market in 2024, accounting for more than 37.2% of the total market share and generating approximately USD 2.1 billion in revenue.
3D Print Farming Market revolutionizes agricultural production by enabling on-demand manufacturing of tools, spare parts, and equipment. It reduces downtime, lowers costs, and enhances customization. Farmers can quickly prototype and produce components using sustainable materials, improving efficiency and innovation across modern precision and smart farming operations.
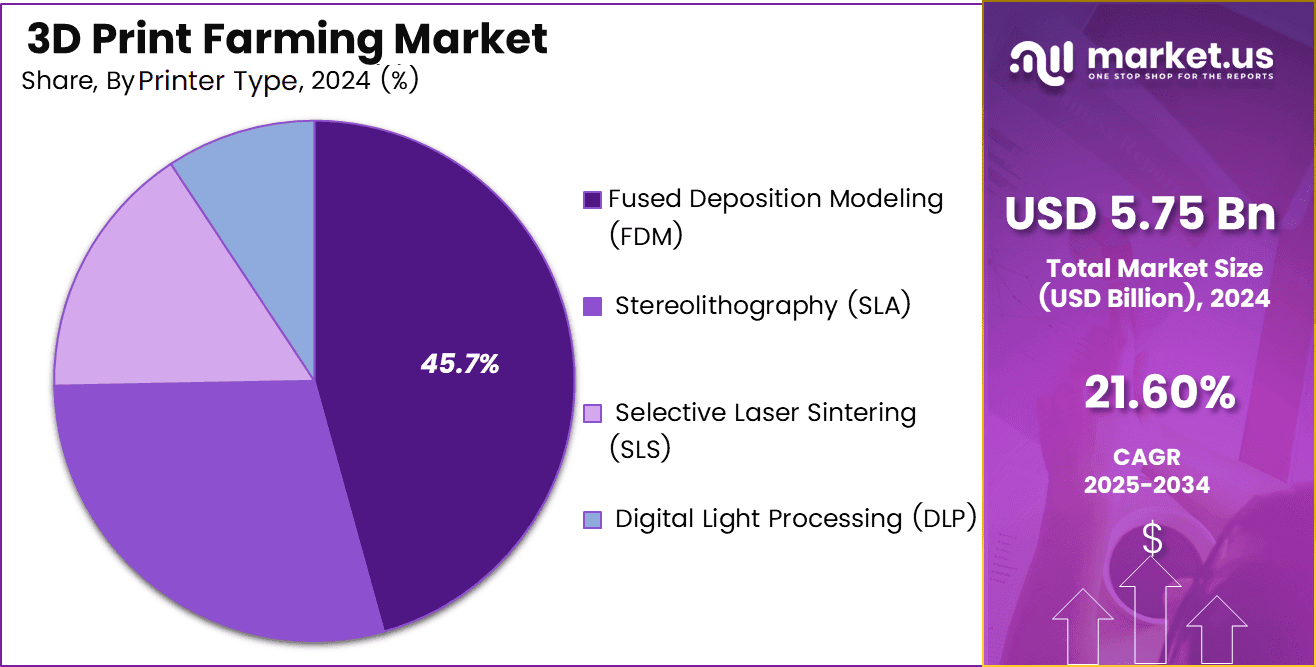
The market growth is driven by the increasing integration of additive manufacturing technologies into agricultural machinery design, spare parts production, and customized tool fabrication, enabling greater precision and cost efficiency in farming operations. Among printer types, Fused Deposition Modeling (FDM) holds the dominant 45.7% share in 2024, owing to its affordability and compatibility with a range of thermoplastics such as PLA and ABS.
Key Takeaways
- The global 3D Print Farming Market is valued at USD 5.75 billion in 2024 and is projected to reach USD 40.6 billion by 2034, growing at a strong CAGR of 21.6% from 2025 to 2034.
- By Printer Type, Fused Deposition Modeling (FDM) dominates the market with a 45.7% share in 2024 due to its cost-effectiveness.
- By Application, Mass Customization & Production leads with a 32.6% share, reflecting rising demand for customized farm tools.
- By Deployment Model, on-premises print Farms hold a commanding 67.2% share, driven by enhanced control.
- By Material, Polymers (PLA, ABS, PETG) represent 38.7% of the market share, supported by their durability and recyclability.
- By End-User Industry, Manufacturing remains the leading sector with a 33.6% share, propelled by the growing use of 3D printing in equipment design.
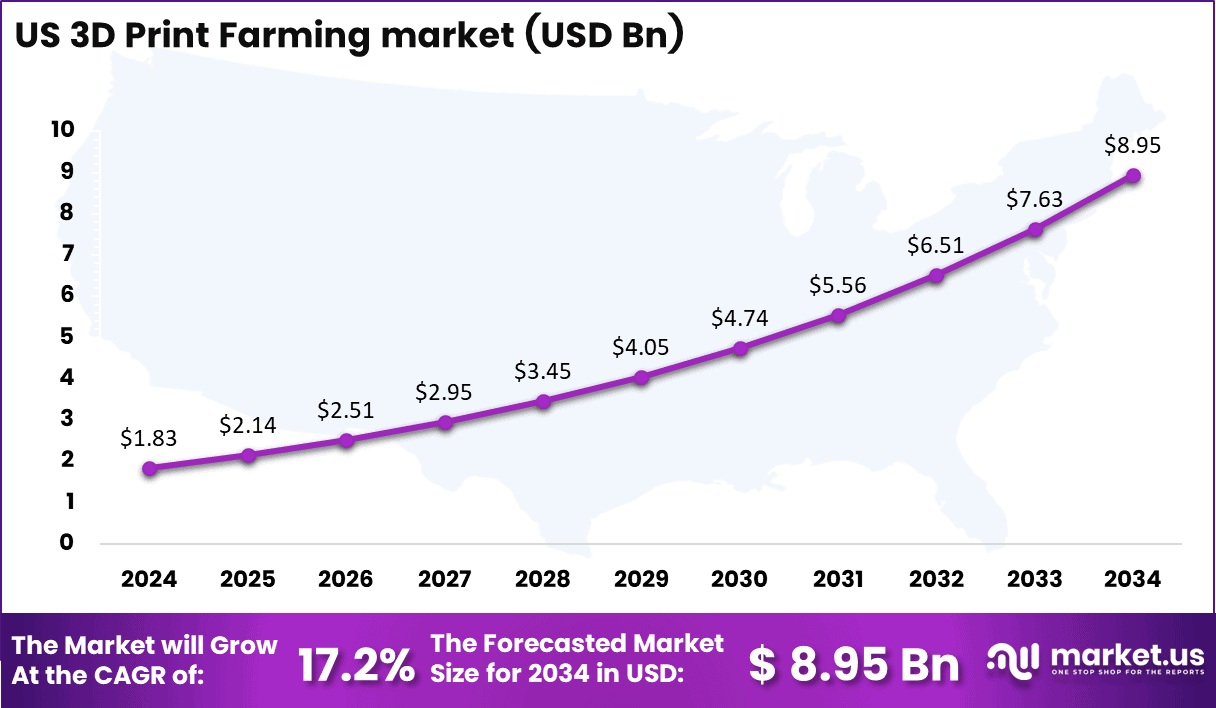
- North America leads the global market with a valuation of USD 2.13 billion in 2024. The US Market alone is projected to grow from USD 1.83 billion in 2024 to USD 8.95 billion by 2034, reflecting a robust CAGR of 17.2%.
Generative AI in 3D Print Farming
Generative AI is revolutionizing the Print Farming Market Region by automating design optimization, predictive modeling, and print efficiency. AI algorithms analyze material performance, environmental conditions, and design constraints to generate optimal models for precision agriculture components. This technology enables predictive maintenance of 3D printers, improving reliability and reducing material waste by nearly 25-30%.
Generative AI also supports adaptive printing, where machine learning systems fine-tune layer thickness, nozzle movement, and temperature based on real-time feedback. As AI-driven design and process control expand, 3D print farming is expected to become more autonomous, sustainable, and data-driven, transforming agricultural innovation into a faster, smarter, and greener process.
By Printer Type
Fused Deposition Modeling (FDM) dominates with 45.7% due to low entry cost and easy material handling.
Fused Deposition Modeling leads 3D print farming because it offers the lowest machine and material cost at scale, which suits farm operators who may run 100 to 500 networked printers in a single facility. OECD work on 3D printing and trade shows that lower equipment cost strongly links with higher volumes of printed goods.
This cost advantage lets farms offer parts at prices 20 to 30 percent below traditional machining for simple geometries while still keeping margins. The fastest growth now comes from Stereolithography systems, as resin printers move from prototyping into dental, jewelry, and high-detail consumer products.
By Application
Mass Customization & Production dominates with 32.6% due to high-volume personalized part demand.
Mass customization and series production lead 3D print farming because farms increasingly produce thousands of similar yet personalized parts, from phone case shells to small machine components, in a single coordinated workflow. The OECD notes that a higher stock of 3D printers in a country links with a measured rise in exports of 3D printable goods, with each 1 percent increase in printer imports associated with about $3.3 million in extra export value.
This effect reflects how farms shift from one-off prototypes to repeat batches of 5,000 to 20,000 units with small design changes per customer or per region. At the same time, medical devices and prosthetics represent the fastest-growing application in print farming. In healthcare, the WHO estimates that assistive device needs reach more than 2.5 billion people worldwide, yet only about 10 percent currently receive suitable products.
3D print farms close part of this gap by producing custom prosthetic sockets, dental aligners, and surgical guides at unit costs that can be 40 percent lower than conventional methods, and by scaling production across cloud-managed farms near hospitals. This unmet need and cost advantage drive rapid growth in medical use of print farms.
By Deployment Model
On-Premise Print Farms dominate with 67.2% due to strong control over sensitive production workflows.
On-premise print farms hold the largest share because industrial and healthcare users prefer to keep machines, materials, and design files within their own facilities to protect intellectual property and patient data. World Bank data shows that manufacturing still makes up more than 16 percent of value added in OECD economies, and many of these plants integrate clusters of 50 to 200 printers directly into shop floors for just-in-time part production.
This setup improves control of quality and allows firms to match 3D output with legacy machining and assembly lines. On-premise farms also reduce logistics time, which is important when firms ship millions of parts yearly. In contrast, cloud-based farms represent the fastest-growing model as connectivity and remote management improve.
Global fixed broadband penetration reached around 19 subscriptions per 100 inhabitants and mobile broadband reached about 87 subscriptions per 100 inhabitants, according to ITU. This connectivity lets operators monitor hundreds of printers across several cities from one cloud dashboard, balance loads between locations, and offer “manufacturing-as-a-service” to small firms that cannot invest in their own equipment.
By Material
Polymers (PLA, ABS, PETG) dominate with 38.7% due to broad compatibility with low-cost desktop printers.
Polymer materials lead 3D print farming because PLA, ABS, and PETG work on most FDM printers, and these printers form the bulk of units in service farms. The OECD reports that the number of additive manufacturing patents, many focused on polymer processes, surged between 2013 and 2017, with the United States filing about 32 percent of such patents and Japan and Germany together adding over 34 percent.
This strong innovation base supports steady improvements in filament quality, color range, and recyclability, which in turn helps farms run tens of thousands of print jobs per month for consumer and light industrial parts. Polymers also cost far less than metals, which keeps material spend manageable when farms produce more than 10,000 kilograms of prints per year.
By End-User Industry
Manufacturing dominates with 33.6% due to strong integration with factory-scale digital workflows.
Manufacturing end users lead demand for 3D print farming because factories use farms for quick tooling, spare parts, and short-run production that would be too slow or expensive with molding or machining.
World Bank data shows that global manufacturing value added exceeded $16 trillion in recent years, with many economies where industry contributes more than 20 percent of GDP. Within this large base, even a small shift of 1 to 2 percent of production volume toward 3D printing translates into hundreds of billions of dollars in potential output, which explains why manufacturing clients often run farms of 100 or more printers tied into their MES and ERP systems.
Healthcare stands out as the fastest-growing end-user group. The World Health Organization reports that non-communicable diseases now cause about 74 percent of global deaths, while aging populations grow sharply, pushing up demand for surgical devices, orthopedic implants, and personalized aids. Print farms respond with custom surgical guides, dental appliances, and prosthetic components tailored to each patient, and hospitals increasingly partner with specialized farms rather than relying only on large device firms.
Key Market Segments
By Printer Type
- Fused Deposition Modeling (FDM)
- Stereolithography (SLA)
- Selective Laser Sintering (SLS)
- Digital Light Processing (DLP)
By Application
- Mass Customization & Production
- Prototype Printing Farms
- Medical Devices & Prosthetics
- Consumer Products
- Automotive & Aerospace
- Educational Tools
- Jewelry & Fashion
- Others
By Deployment Model
- Cloud-based Print Farms
- On-Premise Print Farms
By Material
- Polymers (PLA, ABS, PETG)
- Metals (Titanium, Stainless Steel)
- Resins
- Composites
By End-User Industry
- Manufacturing
- Healthcare
- Education
- Architecture
- Automotive
- Defense & Aerospace
- Others
Regional Analysis
North America dominates the global 3D Print Farming Market, holding a market value of USD 2.13 billion in 2024, primarily led by the United States. The region’s strong manufacturing base, early technological adoption, and substantial R&D investment make it a frontrunner in integrating 3D printing with precision agriculture.
Europe follows with increasing applications in smart farming and agricultural automation, while Asia-Pacific is emerging as the fastest-growing region due to expanding digital agriculture programs in China, India, and Japan. Meanwhile, Latin America and the Middle East & Africa are gradually adopting 3D printing farms to enhance productivity, reduce import dependence, and develop localized agricultural components.
US Market Size
The US 3D Print Farming Market is valued at USD 1.83 billion in 2024 and is projected to reach USD 8.95 billion by 2034, expanding at a CAGR of 17.2% during 2025–2034. This growth is driven by the rapid adoption of additive manufacturing in agriculture, enabling farmers and manufacturers to produce customized tools, spare parts, and machinery components on demand.
The increasing focus on cost-efficient operations, reduced material waste, and faster production turnaround is fueling the transition from traditional to digital manufacturing models. Supportive government initiatives toward sustainable agriculture and the integration of AI-driven design software in farm equipment are further accelerating the market’s expansion across the US.
Key Regions and Countries
- North America
- US
- Canada
- Europe
- Germany
- France
- The UK
- Spain
- Italy
- Rest of Europe
- Asia Pacific
- China
- Japan
- South Korea
- India
- Australia
- Rest of APAC
- Latin America
- Brazil
- Mexico
- Rest of Latin America
- Middle East & Africa
- GCC
- South Africa
- Rest of MEA
Market Dynamics
Drivers
| Driver | (~) % Impact on CAGR Forecast | Geographic Relevance | Impact Timeline |
|---|---|---|---|
| Shift to distributed print farms | +4.0% | North America, Europe, East Asia | Short term (2 years or less) |
| Industry 4.0 factory integration | +3.0% | Global developed manufacturing hubs | Medium term (2 to 4 years) |
| Falling desktop FFF/SLA hardware costs | +2.5% | Global | Short term (2 years or less) |
| On-demand manufacturing network adoption | +2.0% | Global | Medium term (2 to 4 years) |
| Agriculture & food tooling use cases | +1.8% | Europe, North America, Asia-Pacific | Medium term (2 to 4 years) |
| Government additive manufacturing incentives | +1.5% | Asia, Europe | Long term (4 years or more) |
Shift to distributed print farms
Large-scale migration from single industrial printers to distributed print farms built around reliable desktop FFF and SLA systems has, per industry shipment data compiled by leading additive hardware OEMs in 2024–2025, pushed unit counts for sub-USD 1,000 printers to well over 200,000 units annually across North America and Europe, structurally enabling multi-printer clusters that operate with 70–80% uptime for end-use part production rather than prototyping alone, as evidenced in additive manufacturing utilization surveys by ASTM International and sectoral data from the German Mechanical Engineering Industry Association.
Restraints
| Restraint | (~) % Impact on CAGR Forecast | Geographic Relevance | Impact Timeline |
|---|---|---|---|
| High-cost industrial print farm CapEx | –3.5% | Global | Short term (2 years or less) |
| Elevated interest rates & credit tightening | –2.5% | North America, Europe | Short term (2 years or less) |
| Export controls on advanced AM materials | –2.0% | US–China, EU | Medium term (2 to 4 years) |
| Regulatory uncertainty in food-contact printing | –1.5% | North America, EU | Medium term (2 to 4 years) |
| Limited equipment financing for SMEs | –1.3% | Global emerging markets | Short term (2 years or less) |
| Fragmented certification & quality standards | –1.0% | Global | Long term (4 years or more) |
High-cost industrial print farm CapEx
Industrial-grade FFF and SLA clusters suitable for production print farms typically require upfront investments of USD 250,000–500,000 for hardware, ancillary equipment, and integration, and according to central bank lending rate series from the Federal Reserve and European Central Bank for 2024–2025.
Prevailing real borrowing costs in many markets have risen by 150–250 basis points versus pre-2020 levels, forcing mid-market manufacturers to stretch payback periods from roughly 3 years to over 5 years; this constrains new print farm build-outs and directly suppresses near-term sales volumes, as reflected in SME capital expenditure surveys by the OECD and equipment leasing statistics from major industrial finance providers.
Challenges
| Challenge | (~) % CAGR Friction Drag | Geographic Relevance | Mitigation Horizon |
|---|---|---|---|
| Specialist AM workforce shortage | –3.0% | Global | Long term (4 years or more) |
| Complex multi-printer operations | –2.2% | Global | Medium term (2 to 4 years) |
| Material consistency & traceability | –2.0% | Global | Medium term (2 to 4 years) |
| Post-processing & finishing bottlenecks | –1.8% | Global | Medium term (2 to 4 years) |
| Software integration & MES gaps | –1.5% | North America, Europe | Short term (2 years or less) |
| Energy cost volatility risk | –1.2% | Europe, Asia | Short term (2 years or less) |
Specialist AM workforce shortage
Advanced print farming operations require experienced additive manufacturing engineers, production planners, and operators, yet national skills assessments by the International Labour Organization and regional manufacturing chambers indicate deficits in the tens of thousands of appropriately trained technicians across major AM hubs, pushing fully loaded labor costs for senior AM roles to 20–30% above traditional machining benchmarks and keeping average operator-to-printer ratios at roughly 1:5–1:8 instead of the more efficient 1:10–1:15 seen in mature automated plants, as evidenced in workforce demand projections by national industry associations and company-level disclosures in leading additive OEM annual reports.
Opportunities
| Opportunity | (~) % Potential CAGR Upside | Geographic Relevance | Execution Window |
|---|---|---|---|
| Cloud-orchestrated global print farm networks | +4.5% | Global | Medium term (2 to 4 years) |
| Agritech-specific print farm platforms | +3.2% | North America, Europe, Asia-Pacific | Medium term (2 to 4 years) |
| Subscription-based capacity-as-a-service | +2.8% | Global | Short term (2 years or less) |
| Localized food-processing tooling farms | +2.3% | Europe, Asia | Medium term (2 to 4 years) |
| Green-certified low-waste print farms | +2.0% | Europe, North America | Long term (4 years or more) |
| M&A roll-ups of fragmented micro-farms | +1.8% | Global | Long term (4 years or more) |
Cloud-orchestrated global print farm networks
Cloud orchestration platforms can dynamically route production jobs across dozens to hundreds of geographically distributed print farms. This networked model can reduce unit costs by approximately 15–25% compared with standalone facilities by improving capacity utilization and lowering average printer idle time to below 10%.
Multi-region APIs and secure data pipelines can also support lead times of less than 24 hours for complex components. By offering networked capacity-as-a-service, providers could improve EBITDA margins by around 3–5 percentage points compared with traditional contract manufacturing models.
Key Player Analysis
The 3D print farming market is led by Tier-1 industrial and software companies with large additive manufacturing revenue bases and strong capital investment. Stratasys, 3D Systems, EOS GmbH, GE Additive, HP, and Materialise account for an estimated 55–65% of installed 3D printers relevant to agriculture and food production.
They also generate around 60–70% of industrial and healthcare additive manufacturing revenue that can support farm equipment prototypes, spare parts, irrigation systems, and controlled-environment agriculture components.
In 2025, 3D Systems generated USD 386.9 million in revenue, representing a 12% year-over-year decline. Industrial Solutions contributed USD 207.3 million, or 54%, while Healthcare Solutions generated USD 179.6 million, or 46%. In Q3 2025, revenue reached USD 91.2 million, including USD 52.3 million from products and USD 38.9 million from services, despite a 19% annual decline.
GE Aerospace, which includes GE Additive, reported USD 45.9 billion in revenue during 2025, an increase of 18% from 2024. Propulsion and Additive Technologies revenue increased by 33%, while segment operating profit reached USD 1.3 billion and margins expanded by 110 basis points. Full-year segment revenue also increased by 11%, supported by double-digit order growth and continued investment in metal additive manufacturing.
EOS GmbH recorded approximately EUR 1.053–1.10 billion in consolidated revenue during 2024/25, with EBITDA of about EUR 461 million and mid-single-digit revenue growth. Tier-2 companies, including ExOne, voxeljet, EnvisionTec, Optomec, Proto Labs, Shapeways, Organovo, Autodesk, and Dassault Systèmes, collectively represent an estimated 25–35% of additive manufacturing revenue linked to customized parts, rapid tooling, software, and design-to-print services for agricultural applications.
Top Key Players
- 3D Systems, Inc.
- 3DCeram
- Arcam AB
- Autodesk, Inc.
- Canon, Inc.
- Dassault Systemes
- EnvisionTec, Inc.
- EOS (Electro Optical Systems) GmbH
- ExOne
- GE Additive
- HP Inc.
- madeinspace.us
- Materialise NV
- Optomec, Inc.
- Organovo Holdings Inc.
- Proto Labs, Inc.
- Shapeways, Inc.
- Stratasys Ltd.
- Tiertime
- Voxeljet AG
- Other Major Players
Recent Development
- In July 2026, Health Canada approved Nanochon’s first‑in‑human clinical trial for its 3D‑printed Chondrograft knee implant, authorizing implantation of a bioresorbable scaffold produced via additive manufacturing; the company targets scaling pilot manufacturing capacity from fewer than 1,000 units annually to several thousand implants.
- In July 2026, Chinese 3D printing firm HeyGears unveiled one‑piece multi‑material 3D‑printed dentures using its proprietary Multi‑Material Fusion DLP technology, demonstrating automated serial production capabilities in dental print farms with build speeds above 500 mm/s and multi‑material throughput designed for hundreds of units per day.
- In October 2025, Indian deep‑tech startup Tvasta Manufacturing Solutions partnered with CEPT University to create a national platform for 3D construction printing in India, integrating research, education and full‑scale pilot projects.
- In October 2025, WOL3D launched BRAHMA, a consumer‑oriented 3D printing farm solution targeting scalable smart manufacturing; the platform aggregates fleets of desktop printers into coordinated farms, enabling businesses to manage dozens to hundreds of units for serial production runs.
Report Scope
| Report Features | Description |
|---|---|
| Market Value (2024) | USD 5.7 Bn |
| Forecast Revenue (2034) | USD 40.6 Bn |
| CAGR(2025-2034) | 21.6% |
| Base Year for Estimation | 2024 |
| Historic Period | 2020-2023 |
| Forecast Period | 2025-2034 |
| Report Coverage | Revenue forecast, AI impact on Market trends, Share Insights, Company ranking, competitive landscape, Recent Developments, Market Dynamics, nd Emerging Trends |
| Segments Covered | By Printer Type (Fused Deposition Modeling (FDM), Stereolithography (SLA), Selective Laser Sintering (SLS), Digital Light Processing (DLP)), By Application (Mass Customization and Production, Prototype Printing Farms, Medical Devices and Prosthetics, Consumer Products, Automotive and Aerospace, Educational Tools, Jewelry and Fashion, Others), By Deployment Model (Cloud-based Print Farms, On-Premise Print Farms), By Material (Polymers (PLA, ABS, PETG), Metals (Titanium, Stainless Steel), Resins, Composites), By End-User Industry (Manufacturing, Healthcare, Education, Architecture, Automotive, Defense and Aerospace, Others) |
| Regional Analysis | North America – US, Canada; Europe – Germany, France, The UK, Spain, Italy, Russia, Netherlands, Rest of Europe; Asia Pacific – China, Japan, South Korea, India, New Zealand, Singapore, Thailand, Vietnam, Rest of Latin America; Latin America – Brazil, Mexico, Rest of Latin America; Middle East & Africa – South Africa, Saudi Arabia, UAE, Rest of MEA |
| Competitive Landscape | 3D Systems, Inc., 3DCeram, Arcam AB, Autodesk, Inc., Canon, Inc., Dassault Systèmes, EnvisionTec, Inc., EOS (Electro Optical Systems) GmbH, ExOne, GE Additive, HP Inc., madeinspace.us, Materialise NV, Optomec, Inc., Organovo Holdings Inc., Proto Labs, Inc., Shapeways, Inc., Stratasys Ltd., Tiertime, Voxeljet AG, Other Major Players |
| Customization Scope | Customization for segments, region/country-level will be provided. Moreover, additional customization can be done based on the requirements. |
| Purchase Options | We have three licenses to choose from: Single User License, Multi-User License (Up to 5 Users), Corporate Use License (Unlimited Users, Printable PDF) |





























