


Report Overview
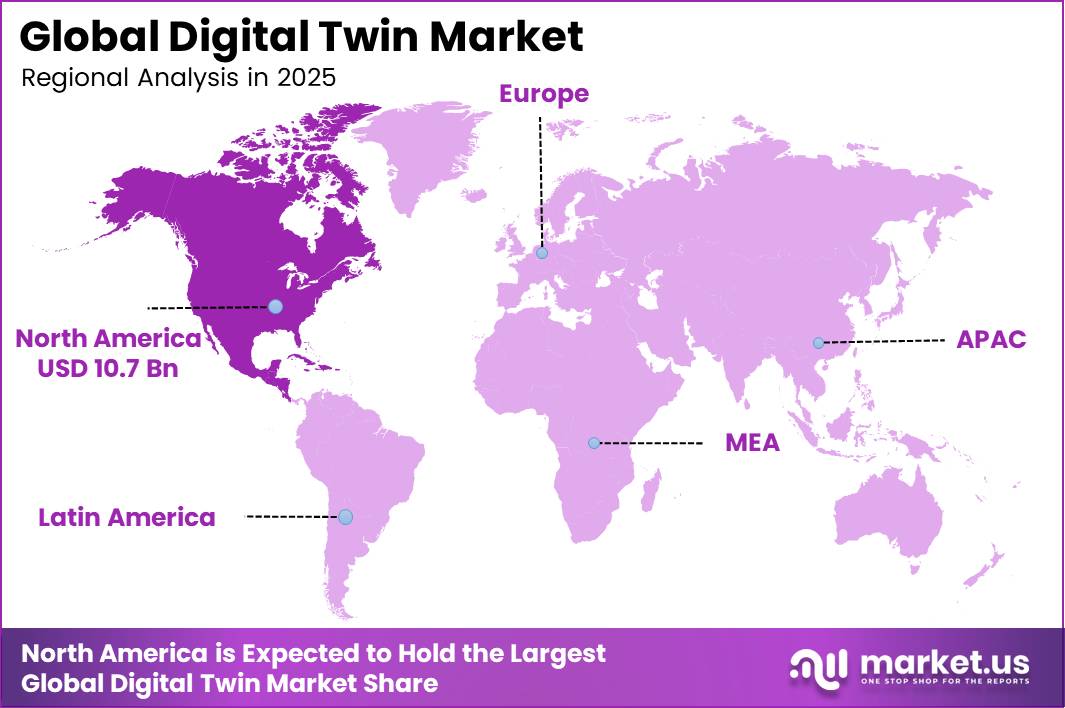
In 2025, the Global Digital Twin Market stood at USD 28.2 billion and is projected to reach USD 722.5 billion by 2035, growing at a CAGR of 38.2%. This growth ties directly to the fast expansion of connected industrial systems. North America leads the digital twin market, holding a 38.0% share and generating USD 10.7 billion in revenue in 2025.
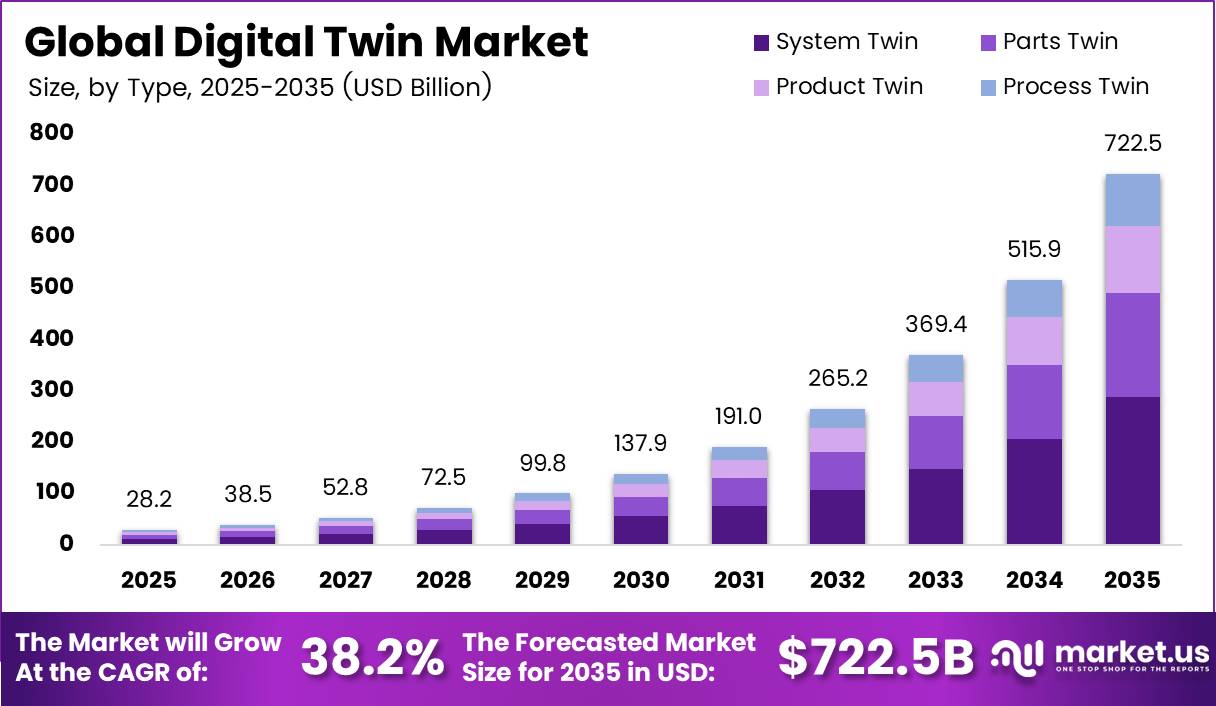
The International Telecommunication Union reports that over 11 billion IoT devices were active worldwide by 2024, supplying the real-time data streams that digital twins depend on to mirror physical assets. The World Bank reports that global manufacturing value added climbed to USD 16.64 trillion in 2024, up from USD 16.44 trillion in 2023, as factories add more sensors, robotics, and automated lines. Manufacturers use digital twins to cut downtime and shorten design cycles, which explains why the market is set to expand more than twenty-fivefold within a decade.
North America leads the digital twin market, with a technically advanced manufacturing base paired with steady industrial output. The Federal Reserve reported that manufacturing output grew at an annual rate of 4.7% in the second quarter of 2026, while capacity utilization for manufacturing held near 75.7%. Heavy investment across aerospace, automotive, and energy infrastructure keeps demand high for predictive maintenance and virtual commissioning tools, giving vendors a wide base of enterprise customers ready to adopt digital twin platforms at scale across their plants and supply chains.
Key Takeaways
- The Digital Twin Market was valued at USD 28.2 billion in 2025 and is forecast to reach USD 722.5 billion by 2035.
- The market is set to grow at a CAGR of 38.2% between 2026 and 2035.
- By type, System Twin leads with a 40.9% share, while Process Twin is the fastest-growing type.
- By deployment, On-premise leads with a 63.0% share, while Cloud is the fastest-growing deployment mode, expanding at a CAGR of 31%.
- By enterprise size, Large Enterprises lead with a 67.0% share, while Small and Medium Enterprises (SMEs) are the fastest-growing segment, expanding at a CAGR of 27%.
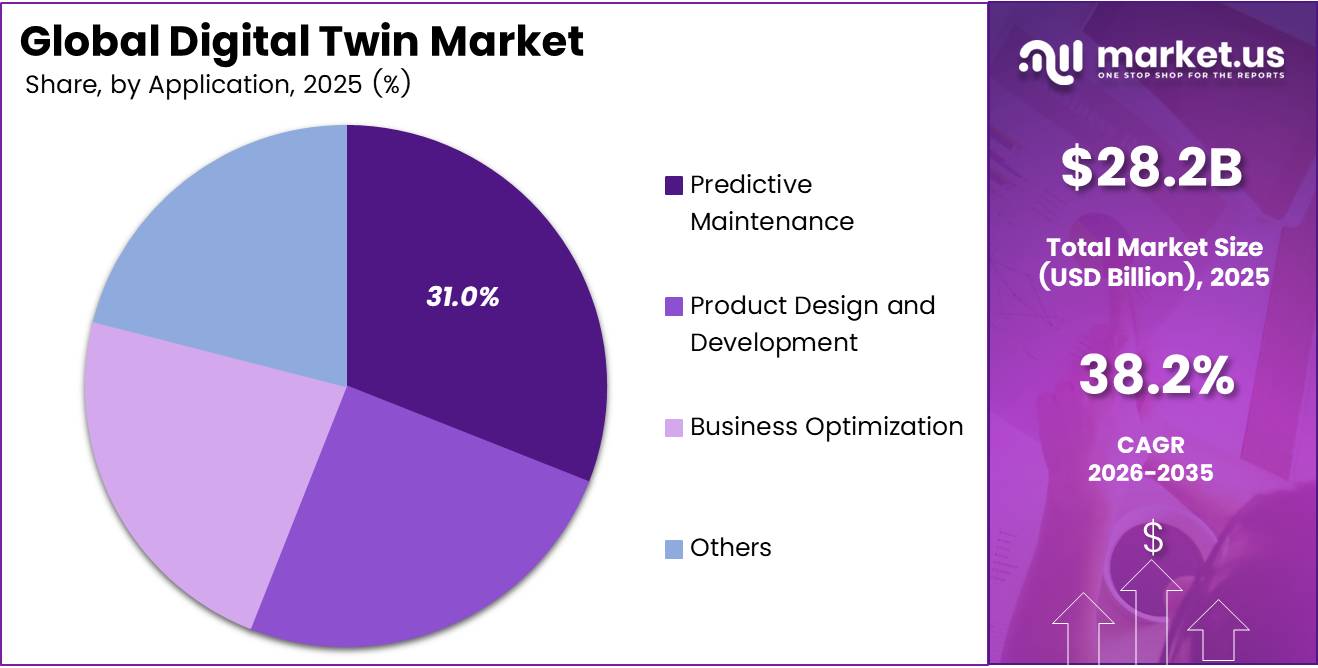
- By application, Predictive Maintenance leads with a 31.0% share, while Product Design and Development is the fastest-growing application.
- By end use, Manufacturing leads with a 36.0% share, while Oil and Gas is the fastest-growing end use, expanding at a CAGR of 28%.
- North America dominates the market, holding a 38.0% share and generating USD 10.7 billion in revenue.
- Asia Pacific is the fastest-growing region, expanding at a CAGR of 25.5%.
By Type
System Twin dominates with 40.9% due to full plant-wide asset network mirroring.
Large operators buy digital twins to watch whole systems, not single machines. A single factory, airport, or power grid ties thousands of assets together, so a twin that copies the entire network gives managers the widest payback. Aviation shows the scale well: the Federal Aviation Administration guides more than 45,000 flights and 2.9 million airline passengers every day across more than 29 million square miles of airspace.
NASA Ames built a digital twin simulator of that national airspace system so planners can test traffic flows before they change real operations. Only a system-level model can hold links of this size together. Process Twins now grow fastest because plants want to fix how work flows, not just how one machine behaves.
By Deployment
On-premise dominates with 63.0% due to strict plant data control needs.
Factories, defence sites, and utilities keep twin models inside their own walls because the data feeding them is sensitive and time-critical. Control loops must answer in milliseconds, and local servers remove network delay. Rules on where data may sit also push owners to hold models on site. Cloud adoption, though, climbs quickly, and wider business software habits show why.
Eurostat reports that 52.7% of European Union enterprises used paid cloud computing services during 2025, a rise of 7.4 percentage points over 2023 and far above the 17.8% recorded in 2014. Once firms trust the cloud for email and file storage, heavier workloads follow. Cloud platforms supply the large computing power that physics simulations need, and buyers pay only for the hours they use.
Engineers sitting in different cities can open one shared model together, which suits global design teams. Vendors now sell twins as subscriptions, so customers skip big server purchases and long install projects. Private links, encryption, and hybrid setups answer earlier safety worries. Together, these forces drive the 31% yearly growth rate for cloud delivery, while on-premise still holds the bigger installed base.
By Enterprise Size
Large Enterprises dominate with 67.0% due to heavy capital assets and in-house engineering teams.
The U.S. Small Business Administration Office of Advocacy counts 34.8 million small businesses, which make up 99.9% of all American firms and employ 59 million people, so the pool of possible buyers is enormous. Subscription pricing, ready-made templates, and low-code tools let a workshop model one line or one machine without hiring a modelling team.
Suppliers to large manufacturers also feel pressure to match their customers’ digital standards, which pulls twins down the supply chain. Government grants and factory modernisation programmes cover part of the bill. With cheap sensors and simple dashboards, a small plant can start with one asset and expand later, which explains the 27% yearly growth rate for this group.
By Application
Predictive Maintenance dominates with 31.0% due to costly unplanned equipment downtime across factories.
Machine failure costs real money, so buyers spend first on twins that predict breakdowns. Research published by the National Institute of Standards and Technology puts unplanned downtime losses in United States manufacturing at about $18.1 billion each year, and it found that plants leaning on predictive methods recorded 78.5% fewer defects than their weaker peers.
A twin that watches vibration, heat, and pressure warns teams days ahead, letting them order parts and plan repairs during a quiet shift. The U.S. Department of Energy notes that predictive programmes save roughly 8% to 12% against preventive schedules and as much as 40% against fix-it-when-it-breaks habits, which makes the business case easy to sign off.
By End Use
Manufacturing dominates with 36.0% due to the largest installed base of production machinery.
Manufacturing leads because it holds the densest concentration of machines, sensors, and repeatable processes. The National Institute of Standards and Technology records that manufacturing added $2.4 trillion to United States output in 2023, equal to 10.2% of national GDP, so even thin efficiency gains across such a base create huge value.
Plants already run control systems and quality data, which gives twin software a ready foundation. Oil and gas climbs quickest for a different reason: assets sit far away, cost enormous sums, and fail expensively. The U.S. Energy Information Administration expects Gulf offshore crude output to average 1.80 million barrels per day in 2025, up from 1.77 million in 2024, and operators guard every barrel of that flow.
A twin of a well, riser, or platform lets crews test drilling plans, watch corrosion, and cut helicopter trips to remote rigs. Ageing fields need careful pressure management, while methane and safety rules demand tighter monitoring. Falling sensor costs and satellite links make live models workable offshore. These pressures support the 28% yearly growth rate recorded across the oil and gas segment.
Key Market Segments
By Type
- System Twin
- Process Twin
- Parts Twin
- Product Twin
By Deployment
- On-premise
- Cloud
By Enterprise Size
- Large Enterprises
- Small and Medium Enterprises (SMEs)
By Application
- Predictive Maintenance
- Product Design and Development
- Business Optimization
- Others
By End Use
- Manufacturing
- Aerospace and Defense
- Aircraft Engine Design and Production
- Space-Based Monitoring
- Automotive and Transportation
- Fleet Management
- Vehicle Designing and Simulation
- Healthcare
- Medical Device Simulation
- Patient Monitoring
- Retail
- Energy and Utilities
- Wind and Gas Turbines
- Power Infrastructure
- Real Estate
- IT and Telecom
- Oil and Gas
- Others
Geopolitical Impact Analysis
Global trade tensions are directly raising costs across the digital twin supply chain, which depends on semiconductors, sensors, and industrial IoT hardware. In January 2026, the United States imposed a 25% tariff on a narrow set of advanced logic semiconductors under Section 232, adding cost pressure on the chips that power edge devices and simulation servers.
The International Energy Agency reports that prices for critical minerals used in electronics and sensors rebounded sharply in 2025 and early 2026, with neodymium prices rising 110% between January 2025 and April 2026 after China tightened export controls on heavy rare earth elements in April and October 2025. The World Trade Organization noted that global goods trade volume grew 4.9% year on year in the first half of 2025, partly driven by importers front-loading orders ahead of expected tariffs, a pattern that adds short-term demand swings for hardware makers.
Shipping delays compound the pressure. Analysis backed by the OECD found that average delays for container ships worsened from 5.1 days in November 2023 to 6.0 days in January 2024 as vessels rerouted around the Cape of Good Hope to avoid the Red Sea, adding time and cost to the delivery of sensors, servers, and networking equipment that digital twin platforms require. Combined, these tariff, mineral, and shipping pressures raise input costs for hardware vendors and push some manufacturers to diversify sourcing and localize production closer to end markets.
Regional Analysis
North America dominates the Digital Twin Market, holding a 38.0% share and generating USD 10.7 billion in revenue. The United States anchors this leadership with a large base of automotive, aerospace, and energy manufacturers that were early adopters of predictive maintenance and virtual commissioning tools.
The Federal Reserve reported that total industrial production sat at 102.6% of its 2017 average in June 2026, 1.1% above the prior year, reflecting resilient output even amid global trade friction. Canada adds further scale through its automotive parts and energy sectors, where digital twins help operators monitor pipelines, grids, and production equipment across harsh and remote environments.
Asia Pacific is the fastest-growing region in the digital twin market, expanding at a 25.5% CAGR. China remains the anchor market, with the International Monetary Fund projecting the country’s economy to grow 5.0% in 2025 and 4.5% in 2026, supporting continued factory automation spending. Japan and South Korea add strength through electronics and automotive manufacturing, while India’s factory output keeps expanding under government-backed production incentive programs.
Europe holds a substantial share of the digital twin market, led by Germany’s automotive and industrial machinery base. Eurostat reported that industrial production across the European Union rose 1.5% in 2025 compared with 2024, pointing to a steady manufacturing recovery. France and the UK contribute through aerospace and defense programs, while Italy and Spain add automotive and machinery demand.
Key Regions and Countries
North America
- US
- Canada
Europe
- Germany
- France
- The UK
- Spain
- Italy
- Rest of Europe
Asia Pacific
- China
- Japan
- South Korea
- India
- Australia
- Rest of APAC
Latin America
- Brazil
- Mexico
- Rest of Latin America
Middle East and Africa
- GCC
- South Africa
- Rest of MEA
Market Dynamics
Drivers
| Driver | (~) % CAGR | Geographic Relevance | Impact Timeline |
|---|---|---|---|
| Industrial IoT adoption & real-time asset monitoring | +4.0% | North America, Europe, East Asia | Short term (2 years or less) |
| Integration of AI/ML into physics-based simulation | +3.2% | Global tier-1 manufacturing hubs | Medium term (2 to 4 years) |
| Industry 4.0-driven smart manufacturing programs | +2.8% | Germany, Japan, South Korea, China | Medium term (2 to 4 years) |
| Predictive maintenance in energy & transport assets | +2.5% | Global utilities & transport operators | Short term (2 years or less) |
| Smart city and infrastructure digitalization initiatives | +2.1% | Middle East, Asia-Pacific, Europe | Long term (4 years or more) |
| Enterprise workflow integration of operational twins | +1.8% | Global large enterprises | Medium term (2 to 4 years) |
Industrial IoT adoption & real-time asset monitoring
More than 14 billion connected industrial and enterprise devices were deployed globally by 2025, accelerating the shift from periodic inspections to continuous asset monitoring. Factories using sensor-rich equipment with OPC UA and MQTT-based data systems have reduced unplanned downtime by 15–30%, while digital twin-enabled predictive maintenance can deliver an additional 10–20% reduction in maintenance costs compared with conventional condition monitoring.
For utilities and transport operators managing assets worth several hundred billion in combined capital expenditure, a 1–2% improvement in capacity factors or asset utilization can increase EBITDA margins by approximately 150–250 basis points. IoT platform revenues have recorded double-digit year-on-year growth since 2024, while digital twin and analytics module attachment rates increased from around 20% of IoT contracts in 2023 to approximately 35–40% in early 2026. This shift toward recurring software and subscription services is estimated to add +4.0% to the baseline digital twin CAGR.
Restraints
| Restraint | (~) % Impact on CAGR | Geographic Relevance | Impact Timeline |
|---|---|---|---|
| High upfront implementation & integration cost | -3.4% | Global, more acute in emerging markets | Short term (2 years or less) |
| Legacy IT/OT fragmentation and data silos | -2.7% | North America, Europe brownfield plants | Medium term (2 to 4 years) |
| Cybersecurity & data sovereignty constraints | -2.3% | EU, Middle East, regulated sectors | Medium term (2 to 4 years) |
| Shortage of twin modeling & domain experts | -1.9% | Global advanced manufacturing clusters | Long term (4 years or more) |
| Conservative capex cycles in heavy industry | -1.6% | Global process industries & infrastructure | Long term (4 years or more) |
| Unclear ROI frameworks for complex twins | -1.5% | Global cross-industry | Medium term (2 to 4 years) |
High upfront implementation & integration cost
The high capital requirement of full-scale digital twin deployments remains a major barrier to near-term adoption. Industrial companies typically allocate only 3–5% of annual capital expenditure to advanced analytics. Brownfield modernization projects in heavy industries often exceed USD 50–100 million, while integrating multi-physics simulation, 3D CAD, MES, IoT systems, and real-time data pipelines can consume 15–25% of the total digital transformation budget.
Legacy IT and operational technology systems can increase integration costs by 30–50% compared with greenfield facilities. Services and customization costs may equal 0.8–1.2x the initial software license or subscription value during the first 2 years, while deployment timelines commonly extend to 12–24 months. Combined with higher borrowing costs since 2022, these factors can extend payback periods beyond the preferred 3–5 years and reduce the achievable market CAGR by an estimated -3.4%.
Challenges
| Challenge | (~) % CAGR | Geographic Relevance | Mitigation Horizon |
|---|---|---|---|
| Cross-domain model interoperability | -2.8% | Global multi-plant enterprises | Long term (4 years or more) |
| Scalable data governance frameworks | -2.4% | Highly regulated sectors worldwide | Medium term (2 to 4 years) |
| Real-time compute & storage cost optimization | -2.2% | Global cloud-reliant users | Medium term (2 to 4 years) |
| Change management in operations culture | -2.0% | Global legacy industrial workforces | Long term (4 years or more) |
| Standardization of KPIs and validation methods | -1.7% | Cross-industry | Medium term (2 to 4 years) |
| Resilience to macro shocks & supply disruption | -1.5% | Global supply-chain-dependent adopters | Long term (4 years or more) |
Cross-domain model interoperability
Digital twin deployment is constrained by limited interoperability across CAD, PLM, MES, simulation, analytics, and control systems. Fewer than 30% of large manufacturers report seamless bidirectional data exchange between these platforms. Bespoke connectors can extend project timelines by 10–20%, while validation of multi-domain models in automotive and aerospace may require 20–30% more engineering hours than single-domain simulations. Cross-domain model mismatches can also generate rework rates of 5–10% during early deployments.
Advanced digital twin workloads involving high-frequency simulations and streaming analytics can cost 2–3x more per compute unit than standard enterprise applications. As a result, enterprises may require architecture transformation programs lasting 4+ years to standardize data models, rationalize tools, and establish vendor-neutral interfaces. This interoperability gap is estimated to create a -2.8% drag on the maximum achievable CAGR by slowing deployments, limiting cross-site model reuse, and reducing operational benefits.
Opportunities
| Opportunity | (~) % CAGR | Geographic Relevance | Execution Window |
|---|---|---|---|
| Outcome-based service models using twins | +3.6% | Global OEMs & asset operators | Medium term (2 to 4 years) |
| Cross-vertical platformization of twin stacks | +3.0% | Global cloud & software ecosystems | Long term (4 years or more) |
| Regulatory-grade twins for compliance & ESG reporting | +2.7% | EU, North America, advanced Asia | Medium term (2 to 4 years) |
| Integration of personal and enterprise twins | +2.4% | Global digital-native enterprises | Long term (4 years or more) |
| M&A-led consolidation of niche twin vendors | +2.1% | Global, concentrated in US & Europe | Medium term (2 to 4 years) |
| Dynamic pricing and risk models in infrastructure | +1.9% | Global infrastructure and utilities | Long term (4 years or more) |
Outcome-based service models using twins
Digital twins create a major opportunity for OEMs and operators to shift from product-based sales toward outcome-based service contracts linked to availability, efficiency, and emissions performance. Turbines, compressors, and rolling stock can experience availability variations of 3–5 percentage points, while digital twin-enabled contracts can guarantee uptime of 97–99% and support premium performance-based fees. Tightening emissions standards are also increasing demand for verified asset-level efficiency gains or emissions reductions of 5–10%.
Industrial OEM service businesses typically achieve operating margins that are 300–500 basis points higher than equipment sales. Digital twin-based performance guarantees could increase margins by a further 2–4 percentage points through fewer unplanned interventions and improved resource planning. Over the next 2–4 years, converting twin solutions from software add-ons into recurring outcome-based contracts could generate long-term service revenue and add approximately +3.6% to the market CAGR above the existing baseline.
Key Players Analysis
Siemens leads the tier one group of market leaders, posting Group revenue of €78.9 billion and net income of €10.4 billion in fiscal 2025, with its Smart Infrastructure division generating €18.5 billion in revenue at an 18.9% margin in fiscal 2024 while building out its Xcelerator digital twin platform.
Dassault Systèmes reported full-year 2025 revenue of €6.24 billion, up 4% at constant currency, with 3DEXPERIENCE revenue climbing 10% and cloud revenue up 8%. PTC closed fiscal 2025 with revenue of $2.739 billion, up 19% year over year, before narrowing its portfolio through the sale of its Kepware and ThingWorx units.
IBM grew Software segment revenue to $29,962 million in 2025, up 10.6%, with its Automation and Data categories posting double-digit growth that includes Maximo-based digital twin tools. Among tier two challengers, Synopsys reshaped the simulation software landscape after completing its acquisition of ANSYS, combining electronic design automation with multiphysics simulation to expand its addressable market to $31 billion.
Rockwell Automation is committing more than $2 billion over five years toward new plants, talent, and digital infrastructure in the United States, including a greenfield factory exceeding one million square feet in Wisconsin. GE Vernova is directing $11 billion in combined capital expenditure and research and development from 2025 through 2028, including a $200 million facility in Hai Phong, Vietnam, announced in March 2026 to expand electrification manufacturing capacity.
Top Key Players in the Market
- General Electric Company
- IBM Corporation
- Siemens AG
- Dassault Systèmes SE
- PTC Inc.
- ABB
- Amazon Web Services, Inc.
- ANSYS, Inc.
- Autodesk Inc.
- AVEVA Group Limited
- Bentley Systems, Incorporated
- Hexagon AB
- Microsoft Corporation
- Robert Bosch GmbH
- Rockwell Automation, Inc.
- SAP SE
- Hitachi Ltd.
- Oracle Corporation
- Schneider Electric
- Accenture plc
- Emerson
- Honeywell
- Altair
- River Logic
- ANDRITZ
Recent Developments
- In January 2026, Siemens announced Digital Twin Composer, a 3D digital twin authoring platform scheduled for general availability in mid-2026. The solution combines Siemens digital twin technology, NVIDIA Omniverse simulations, and real-time engineering data to support automotive, aerospace, and electronics plants with production footprints exceeding 100,000 m² and thousands of assets per site. The platform is part of Siemens Digital Industries, which generated approximately USD 20.3 billion in FY 2025 revenue from software and automation.
- In March 2026, PTC sold its ThingWorx IIoT platform and Kepware connectivity business to TPG for USD 523 million in cash, with total potential consideration of up to USD 725 million. The businesses support digital twin deployments connecting tens of thousands of sensors and controllers per large customer.
Report Scope
| Report Features | Description |
|---|---|
| Market Value (2025) | USD 28.2 Billion |
| Forecast Revenue (2035) | USD 722.5 Billion |
| CAGR (2026-2035) | 38.2% |
| Base Year for Estimation | 2025 |
| Historic Period | 2020-2024 |
| Forecast Period | 2026-2035 |
| Report Coverage | Revenue Forecast, Market Dynamics, Competitive Landscape, Recent Developments |
| Segments Covered | By Type (System Twin, Process Twin, Parts Twin, Product Twin); By Deployment (On-premise, Cloud); By Enterprise Size (Large Enterprises, Small and Medium Enterprises (SMEs)); By Application (Predictive Maintenance, Product Design and Development, Business Optimization, Others); By End Use (Manufacturing, Aerospace and Defense, Automotive and Transportation, Healthcare, Retail, Energy and Utilities, Real Estate, IT and Telecom, Oil and Gas, Others) |
| Regional Analysis | North America – US, Canada; Europe – Germany, France, The UK, Spain, Italy, Rest of Europe; Asia Pacific – China, Japan, South Korea, India, Australia, Singapore, Rest of APAC; Latin America – Brazil, Mexico, Rest of Latin America; Middle East & Africa – GCC, South Africa, Rest of MEA |
| Competitive Landscape | General Electric Company, IBM Corporation, Siemens AG, Dassault Systèmes SE, PTC Inc., ABB, Amazon Web Services Inc., ANSYS Inc., Autodesk Inc., AVEVA Group Limited, Bentley Systems Incorporated, Hexagon AB, Microsoft Corporation, Robert Bosch GmbH, Rockwell Automation Inc., SAP SE, Hitachi Ltd., Oracle Corporation, Schneider Electric, Accenture plc, Emerson, Honeywell, Altair, River Logic, ANDRITZ |
| Customization Scope | Customization for segments, region/country-level will be provided. Moreover, additional customization can be done based on the requirements. |
| Purchase Options | We have three licenses to opt for: Single User License, Multi-User License (Up to 5 Users), Corporate Use License (Unlimited Users and Printable PDF) |





























