


Report Overview
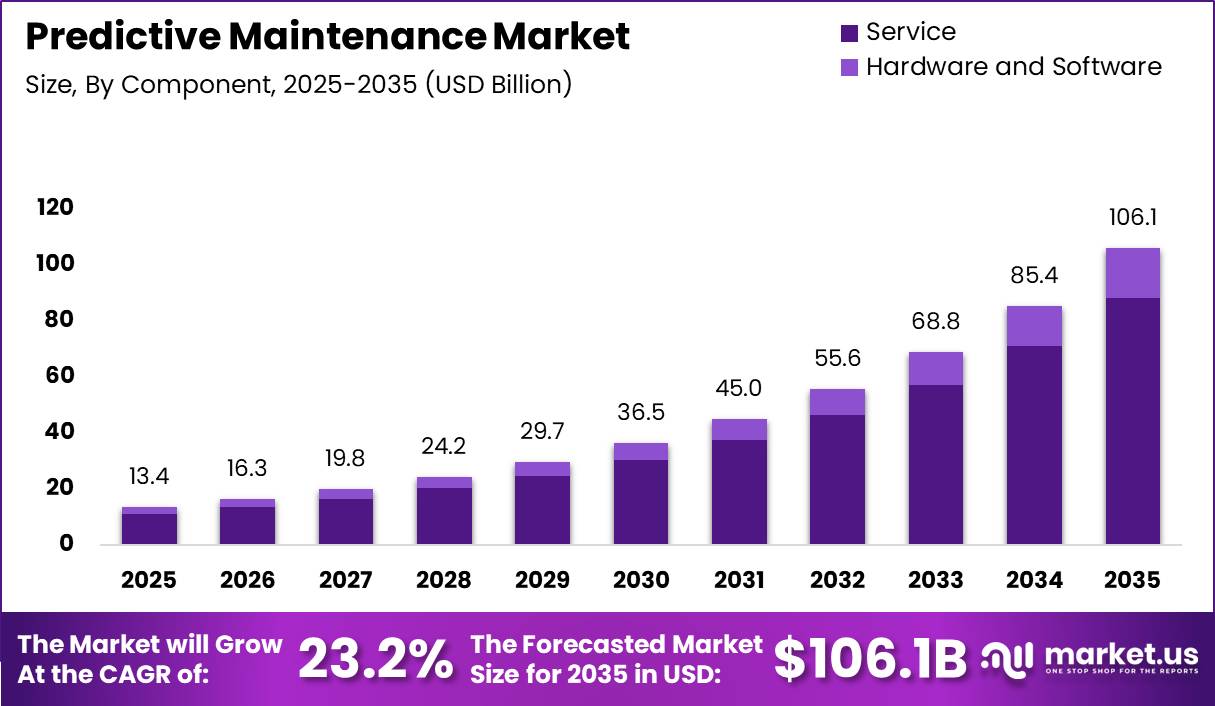
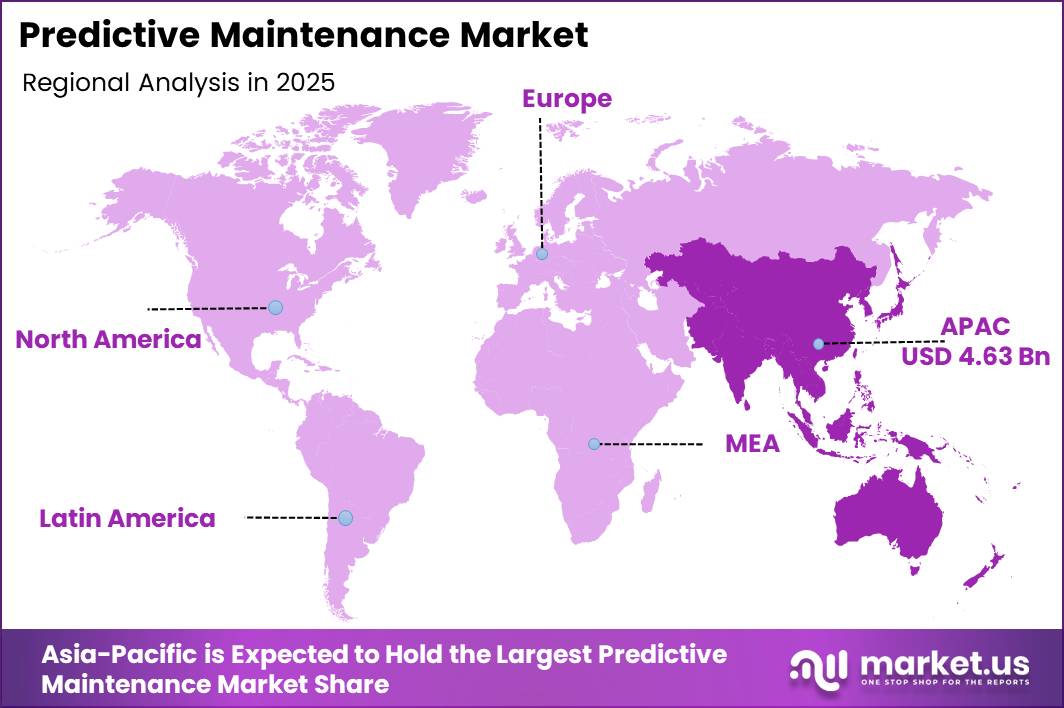
In 2025, the Global Predictive Maintenance Market was valued at USD 13.4 billion. The market is projected to grow at a CAGR of 23.2% during 2026–2035, reaching approximately USD 106.1 billion by 2035. Asia-Pacific dominated the global market in 2025, accounting for more than 34.67% of the total market share and generating approximately USD 4.64 billion in revenue.
The growth of asset-heavy industries, particularly in Asia-Pacific, is creating strong demand for solutions that help companies monitor equipment performance, prevent failures, and reduce maintenance costs. According to the World Bank, manufacturing contributes around 16–17% of global GDP, while East Asia and Pacific economies generate more than USD 4 trillion in manufacturing value added, supported by major industrial economies such as China, Japan, South Korea, and ASEAN countries.
UNIDO data indicates that manufacturing production monitoring covers approximately 98.6% of global manufacturing value added across more than 135 countries, reflecting widespread industrial expansion and automation. As companies invest in Industry 4.0 technologies, industrial IoT, sensors, and advanced analytics, predictive maintenance is becoming an essential tool for improving operational efficiency and reducing unplanned downtime.
Key Takeaway
- The Predictive Maintenance Market was valued at USD 13.4 billion in 2025 and is projected to reach USD 106.1 billion by 2035.
- The market is expected to grow at a CAGR of 23.2% between 2026 and 2035.
- Hardware and Software accounted for 83.2% of the market in 2025, driven by sensors, connectivity, and analytics software.
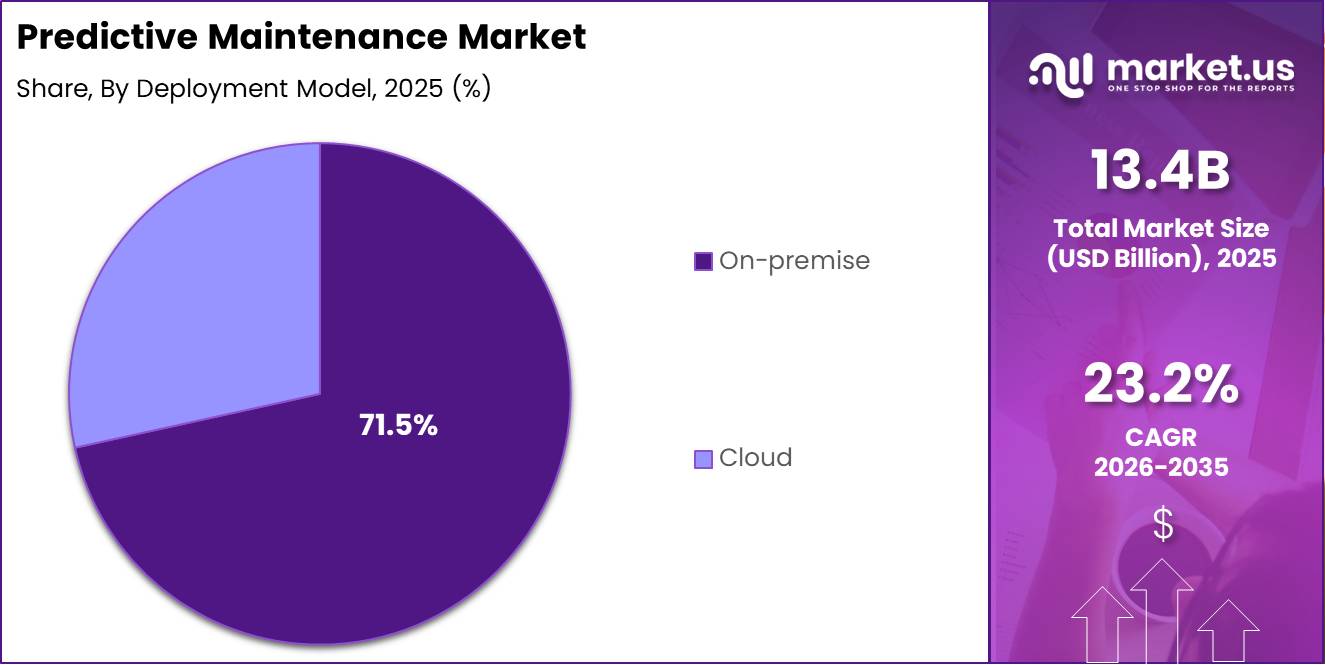
- On-premise deployment led with around 71.56% share, while cloud deployment is the fastest-growing model.
- Large enterprises held around 78.56% of the market, while SMEs are the fastest-growing segment.
- Manufacturing held around 23.67% of the market, while energy and utilities is the fastest-growing end-user segment.
- Asia-Pacific led the market in 2025 with a 34.67% share, worth approximately USD 4.64 billion.
By Component
In 2025, the Hardware and Software segment accounted for 83.2% of the predictive maintenance market, supported by the essential role of sensors, monitoring devices, connectivity systems, data platforms, and analytical software. These technologies form the basic structure of every predictive maintenance system, as they collect equipment data, detect operating changes, and identify possible failures before breakdowns occur.
The International Federation of Robotics reported that around 4.28 million industrial robots were operating worldwide in 2023, while 541,302 new robots were installed during the year. This growing installed base is increasing the need for continuous monitoring of vibration, temperature, pressure, and machine performance.
NIST also found that manufacturers using predictive maintenance experienced 18.5% less unplanned downtime compared with those relying mainly on preventive maintenance, highlighting the financial value of advanced monitoring software. The U.S. Bureau of Labor Statistics projects around 54,200 annual openings for industrial machinery maintenance workers through 2034, further indicating the rising need for skilled maintenance and technical support services.
By Deployment Model
The On-premise deployment model leads the predictive maintenance market with around 71.56% share, mainly because large industrial and infrastructure companies prefer to keep critical operational data within their own facilities. Industries such as chemicals, metals, utilities, transport hubs, and heavy manufacturing manage sensitive equipment information, maintenance records, and AI models that are closely linked to safety and uninterrupted operations.
Cloud deployment is the fastest-growing model as businesses increasingly adopt scalable digital infrastructure. OECD data indicate that cloud adoption among large companies has exceeded 90% in several developed economies. Cloud-based predictive maintenance platforms can store terabytes of sensor data, analyse information from thousands of machines, and support centralized monitoring across multiple plants or fleets.
By Enterprise Size
Large enterprises hold around 78.56% of the predictive maintenance market because they operate the largest and most complex equipment networks and have sufficient budgets to invest in advanced monitoring technologies. In manufacturing, large companies often account for more than half of total employment and an even higher share of industrial output. These organizations manage thousands of production lines, refineries, power plants, warehouses, and transport facilities where unexpected equipment failure can cause major financial losses.
Small and medium-sized enterprises are the fastest-growing segment because they represent about 70% of total global employment. As cloud platforms, wireless sensors, and device-level analytics become more affordable, these companies can adopt predictive maintenance with lower upfront investment and limited internal IT infrastructure, supporting faster market expansion.
By End User
Manufacturing holds around 23.67% of the predictive maintenance market because it operates a large concentration of complex industrial machinery that requires continuous monitoring. According to UNIDO, manufacturing contributes nearly 80% of total global industrial value added, while worldwide manufacturing output increased by about 2.9% in 2024.
Energy and utilities represent the fastest-growing end-user segment as power producers and grid operators increasingly use digital monitoring and advanced analytics. Turbines, transformers, generators, and photovoltaic inverters require continuous performance checks to maintain a stable electricity supply. Predictive maintenance enables early fault detection, supports timely inspections, and reduces unexpected outages, making it increasingly important for reliable and low-carbon energy infrastructure.
Key Market Segments
By Component
- Hardware and Software
- Service
- Integration and Deployment
- Support & Maintenance
- Training & Consulting
By Deployment Model
- Cloud
- On-premise
By Enterprise Size
- Small & Medium Enterprises
- Large Enterprises
By End User
- Aerospace & Defense
- Automotive & Transportation
- Energy & Utilities
- Healthcare
- IT & Telecommunications
- Manufacturing
- Oil & Gas
- Others
Geopolitical Impact Analysis
Geopolitical tensions are increasing costs and delivery risks across the predictive maintenance market, especially for industrial sensors, edge gateways, semiconductors, and analytics hardware that depend on global supply chains. Since 2025, tariff measures have imposed effective duty levels of around 25% to 60% on selected electronic components and industrial equipment in major trade routes.
WTO data also show average applied tariffs of about 7.0% on processor-class integrated circuits and 3.0% on memory chips in key exporting markets such as China. These duties can raise the landed cost of sensor modules and data-acquisition systems by mid-teen to low-20% levels, reducing supplier margins or increasing prices for predictive maintenance solutions.
Energy costs are adding further pressure. According to the IEA, wholesale electricity prices in India, the EU, the UK, and the US remained about 20% above pre-COVID levels in 2024, despite falling around 20% year over year.
This keeps semiconductor production, server manufacturing, cloud computing, and data-center operations more expensive than during 2015–2019. Logistics disruptions are also delaying projects. UNCTAD-linked shipping analysis indicates that rerouting around the Red Sea and other high-risk corridors has added around 10–15 days to some Asia–Europe and Asia–US routes compared with 2022 levels, while on-time delivery performance has fallen by high single-digit percentage points.
Regional Analysis
Asia-Pacific leads the global predictive maintenance market with approximately 34.67% share, representing nearly USD 4.65 billion in 2025. The region is also expected to record the fastest growth due to expanding industrial automation across manufacturing, automotive, electronics, chemicals, and energy and utility sectors.
China, India, Japan, South Korea, and Southeast Asian countries are investing heavily in smart factories, connected machinery, industrial sensors, and AI-based monitoring systems. Government programs supporting Industry 4.0, digital manufacturing, and infrastructure modernization are further encouraging companies to adopt predictive maintenance solutions.
North America and Europe remain important markets because they have mature technology ecosystems and large installed equipment bases across aerospace, oil and gas, defence, utilities, and advanced manufacturing. However, growth in these regions is relatively steady, as many companies are upgrading existing systems rather than developing entirely new facilities.
Asia-Pacific continues to add new production plants, power-generation capacity, transport infrastructure, and industrial equipment. This creates strong demand for predictive maintenance platforms connected with manufacturing execution systems, enterprise resource planning software, cloud platforms, and edge devices.
Key Regions and Countries
North America
- US
- Canada
Europe
- Germany
- France
- The UK
- Spain
- Italy
- Rest of Europe
Asia Pacific
- China
- Japan
- South Korea
- India
- Australia
- Rest of APAC
Latin America
- Brazil
- Mexico
- Rest of Latin America
Middle East & Africa
- GCC
- South Africa
- Rest of MEA
Market Dynamics
Drivers
| Driver | (~) % Impact on CAGR | Geographic Relevance | Impact Timeline |
|---|---|---|---|
| IIoT Sensor Proliferation & Industry 4.0 Mandates | +4.5% | Global — led by North America, Germany, China, Japan | Short term (≤ 2 years) |
| AI & Machine Learning Model Maturation | +3.8% | Global — highest velocity in North America & Western Europe | Short term (≤ 2 years) |
| Unplanned Downtime Cost Pressure Across Heavy Asset Industries | +3.2% | Global — especially energy, utilities, manufacturing, aviation | Short term (≤ 2 years) |
| Government Industry 4.0 Incentive Programs & Manufacturing Policy | +2.1% | EU, India, South Korea, USA, China | Medium term (2–4 years) |
| Cloud Cost Democratization & Edge Computing Adoption | +2.0% | Global — accelerating in Asia-Pacific & Latin America | Short term (≤ 2 years) |
| Post-Pandemic Supply Chain Resilience Investment Cycle | +1.6% | Global — strongest in automotive, electronics, pharma supply chains | Medium term (2–4 years) |
IIoT Sensor Proliferation & Industry 4.0 Mandates
The mass deployment of Industrial Internet of Things (IIoT) sensors tracking vibration, temperature, pressure, and acoustic emission at the asset level forms the primary data substrate without which no predictive analytics layer can function, making it the single most foundational driver in the market today. Between 2023 and 2025, the connected industrial device base expanded at a pace exceeding 12% annually across manufacturing and energy verticals, with IIoT deployments increasingly standardized around OPC-UA communication protocols that enable cross-vendor interoperability.
National manufacturing competitiveness programs, including Germany’s Industrie 4.0 initiative, China’s “Made in China 2025” follow-on directives, and India’s Production Linked Incentive (PLI) scheme covering capital goods, have collectively channeled multi-billion-dollar incentives toward digitizing factory floors, directly subsidizing the sensor and edge-gateway infrastructure on which predictive maintenance platforms run.
The business model consequence is structural: OEMs are shifting from one-time hardware sales toward subscription-based remote monitoring contracts, with platform-per-asset licensing models adding recurring revenue streams that achieve gross margins in the 60–75% range versus 35–45% on traditional product sales.
For end-users, the calculus is equally compelling: unplanned industrial downtime is estimated to cost asset-heavy sectors upward of 1 trillion USD annually globally, and documented deployments across automotive and discrete manufacturing lines consistently report 25–30% efficiency gains alongside unplanned downtime reductions of 30–50%, compressing ROI payback windows to as short as 12–18 months for high-utilization assets.
Restraints
| Restraint | (~) % Impact on CAGR | Geographic Relevance | Impact Timeline |
|---|---|---|---|
| High Upfront Capital Expenditure Barrier for SMEs | -3.5% | Global — most acute in Southeast Asia, South Asia, Latin America, Africa | Short term (≤ 2 years) |
| Elevated Interest Rate Environment Constraining Industrial CapEx Cycles | -2.2% | Global — sharpest in North America & Europe post-2022 rate tightening cycle | Short term (≤ 2 years) |
| Cybersecurity & OT Data Sovereignty Regulatory Barriers | -1.8% | EU (NIS2 Directive), USA (NIST CSF 2.0), Germany, France, India | Medium term (2–4 years) |
| Fragmented Industrial Data Standards & Interoperability Gaps | -1.5% | Global — most disruptive in multi-vendor brownfield facilities | Medium term (2–4 years) |
| Absence of Proven ROI Benchmarks in Mid-Market & Emerging Verticals | -1.0% | Global — concentrated in healthcare, food & beverage, textiles | Short term (≤ 2 years) |
High Upfront Capital Expenditure Barrier for SMEs
A typical predictive maintenance deployment encompassing IoT sensor hardware, edge gateway devices, data transmission infrastructure, analytics software licensing, CMMS/ERP integration, and initial workforce training requires an upfront investment ranging from USD 150,000 to well over USD 1 million for a mid-sized manufacturing facility, a threshold that directly excludes the vast majority of small and medium enterprises (SMEs) that constitute over 90% of industrial establishments by count in markets such as India, Vietnam, Brazil, and Mexico.
Industry surveys consistently identify high initial cost as the primary adoption barrier for 34% of organizations evaluating predictive maintenance, and the problem is compounded in emerging economies where equipment financing markets are thin, industrial loan penetration is low, and technology vendors have yet to build out implementation partner ecosystems capable of delivering cost-effective rollouts.
Challenges
| Challenge | (~) % CAGR | Geographic Relevance | Mitigation Horizon |
|---|---|---|---|
| OT-IT Integration Complexity | -2.8% | Global — most severe in brownfield manufacturing, oil & gas, utilities | Long term (≥ 4 years) |
| Skilled Technician & Data Scientist Talent Deficit | -2.3% | Global — critical shortfall in North America, EU, Australia | Long term (≥ 4 years) |
| Sensor & Edge Hardware Supply Chain Volatility | -1.6% | Global — semiconductor-dependent; Taiwan, South Korea, China exposure | Medium term (2–4 years) |
| Predictive Model Accuracy & False-Positive Rates | -1.4% | Global — acute in variable-load and process industries | Medium term (2–4 years) |
| Change Management & Workforce Resistance | -1.1% | Global — amplified in unionized industrial environments (EU, North America) | Medium term (2–4 years) |
| Data Quality, Volume & Governance Gaps | -0.9% | Global — most severe in SME & legacy-asset-heavy operations | Medium term (2–4 years) |
OT-IT Integration Complexity
The convergence of Operational Technology (OT) encompassing PLCs, SCADA systems, DCS networks, and industrial control hardware often installed decades ago with modern Information Technology (IT) infrastructure is the deepest structural friction point in the market, because it is not merely a technical integration challenge but a security, cultural, and organizational transformation that must be managed simultaneously across functions that historically have never collaborated.
Brownfield facilities, which represent the overwhelming majority of the installed global industrial base, house OT assets with operational lifespans of 20–40 years, running proprietary communication protocols (Modbus, PROFIBUS, DNP3) that are fundamentally incompatible with modern cloud analytics stacks without middleware translation layers, retrofitted smart sensors, or edge gateway deployments that themselves add hardware cost and latency.
In practical deployment terms, integration timelines for complex process-industry environments routinely stretch to 18–36 months per site, absorbing 40–60% of total project budgets before a single predictive model generates an actionable alert a dynamic that directly suppresses deployment velocity, depresses vendor revenue recognition timelines, and forces large enterprises to undertake multi-year phased rollouts rather than fleet-wide simultaneous deployments.
Opportunities
| Opportunity | (~) % CAGR Upside | Geographic Relevance | Execution Window |
|---|---|---|---|
| Predictive Maintenance-as-a-Service (PdMaaS) for SME Segment | +3.6% | Global — highest white space in South & Southeast Asia, Latin America, Africa | Short term (≤ 2 years) |
| Digital Twin Integration for Asset Lifecycle Simulation | +2.9% | Global — primary adoption wave in North America, Germany, Japan | Medium term (2–4 years) |
| Healthcare & Pharma Equipment Monitoring Vertical Expansion | +2.1% | North America, EU, India, Japan | Medium term (2–4 years) |
| Renewable Energy Asset Monitoring (Wind, Solar, Battery Storage) | +2.0% | Global — led by EU, China, USA, India energy transition mandates | Medium term (2–4 years) |
| Generative AI-Enabled Non-Technical User Deployment | +1.7% | Global — fastest conversion potential in mid-market manufacturing | Short term (≤ 2 years) |
| M&A Roll-Up of Niche Vertical PdM Software Providers | +1.2% | North America, EU — private equity & strategic acquirer activity | Long term (≥ 4 years) |
Predictive Maintenance-as-a-Service (PdMaaS) for SME Segment
The PdMaaS model delivering sensor hardware, connectivity, analytics, and reporting through an all-inclusive monthly subscription rather than a capital expenditure directly dissolves the primary restraint (upfront cost) identified above without cannibalizing enterprise revenue streams, making it genuinely untapped white space rather than a repackaging of existing deployment activity.
Today, the overwhelming majority of deployed predictive maintenance contracts are structured as large-scale enterprise CapEx projects, meaning the SME segment which accounts for the majority of industrial establishment count across every major economy remains virtually unaddressed by any scaled commercial offering; penetration rates for predictive maintenance tools among manufacturers with fewer than 250 employees are estimated at below 8% globally, compared to over 40% among facilities with more than 1,000 employees.
The unit economics of the PdMaaS model are structurally attractive for vendors: subscription contracts generate normalized annual recurring revenue (ARR) per monitored asset in the range of USD 1,200–4,500 per asset per year depending on sensor density and analytics tier, against hardware and cloud infrastructure costs that compress below USD 400 per asset per year at scale, implying platform-level contribution margins above 65% at portfolio maturity.
Key Players Analysis
Tier-1 companies such as IBM, Microsoft, Siemens, GE, SAP, Schneider Electric, Honeywell, ABB, and Rockwell Automation lead the predictive maintenance market through their strong industrial software portfolios, cloud infrastructure, and large installed customer bases. Together, these companies are estimated to generate nearly USD 6–7 billion in annual predictive maintenance-related revenue, equivalent to around 40–45% of the global market in 2025.
IBM reported approximately USD 63.0 billion in total revenue, supported by more than USD 18–19 billion from software and consulting activities linked to hybrid cloud and AI. Its Maximo Application Suite supports asset monitoring and maintenance planning across large industrial facilities. Microsoft generated about USD 236.6 billion in FY2025 revenue, while Intelligent Cloud revenue exceeded USD 110 billion. Azure, IoT, and analytics services provide the digital foundation for predictive maintenance solutions offered by industrial partners.
Tier-2 participants, including PTC, Bosch.IO, and Uptake Technologies, compete through specialized software, industry-focused AI models, and strategic partnerships. PTC generated approximately USD 2 billion in 2025, supported by products such as ThingWorx. Rockwell Automation reported nearly USD 9 billion in FY2025 revenue, with Software & Control contributing around 40% of sales.
Overall, Tier-1 vendors dominate integrated platforms and infrastructure, while Tier-2 companies strengthen competition through faster deployment, focused applications, and industry-specific predictive analytics.
Top Key Players in the Market
- IBM Corporation
- General Electric (GE)
- SAP SE
- Microsoft Corporation
- PTC Inc.
- Schneider Electric SE
- Siemens AG
- Honeywell International Inc.
- ABB Ltd.
- Bosch.IO
- Rockwell Automation Inc.
- Uptake Technologies Inc.
Recent Developments
- In March 2026, Microsoft and Siemens expanded their partnership by integrating Azure Industrial IoT with Siemens Industrial Copilot. The combined solution supports AI-based predictive maintenance across more than 1 million connected industrial assets, backed by Siemens’ annual Digital Industries R&D spending of over EUR 2.5 billion.
- In May 2026, ABB expanded its Ability Condition Monitoring platform by establishing a new digital operations centre in Europe. The approximately 10,000-square-metre facility can accommodate more than 500 data engineers and analysts and is designed to monitor several hundred thousand motors, drives, and rotating equipment units worldwide.
Report Scope
| Report Features | Description |
|---|---|
| Market Value (2025) | USD 13.4 Billion |
| Forecast Revenue (2035) | USD 106.1 Billion |
| CAGR (2026-2035) | 23.2% |
| Base Year for Estimation | 2025 |
| Historic Period | 2020-2024 |
| Forecast Period | 2026-2035 |
| Report Coverage | Revenue Forecast, Market Dynamics, Competitive Landscape, Recent Developments |
| Segments Covered | By Component (Hardware and Software, Service [Integration and Deployment, Support & Maintenance, Training & Consulting]); By Deployment Model (Cloud, On-premise); By Enterprise Size (Small & Medium Enterprises, Large Enterprises); By End User (Aerospace & Defense, Automotive & Transportation, Energy & Utilities, Healthcare, IT & Telecommunications, Manufacturing, Oil & Gas, Others) |
| Regional Analysis | North America – US, Canada; Europe – Germany, France, The UK, Spain, Italy, Rest of Europe; Asia Pacific – China, Japan, South Korea, India, Australia, Singapore, Rest of APAC; Latin America – Brazil, Mexico, Rest of Latin America; Middle East & Africa – GCC, South Africa, Rest of MEA |
| Competitive Landscape | IBM Corporation, General Electric (GE), SAP SE, Microsoft Corporation, PTC Inc., Schneider Electric SE, Siemens AG, Honeywell International Inc., ABB Ltd., Bosch.IO, Rockwell Automation Inc., Uptake Technologies Inc. |
| Customization Scope | Customization for segments and region/country-level will be provided. Moreover, additional customization can be done based on the requirements. |
| Purchase Options | We have three licenses to opt for: Single User License, Multi-User License (Up to 5 Users), Corporate Use License (Unlimited Users and Printable PDF) |





























