


Report Overview
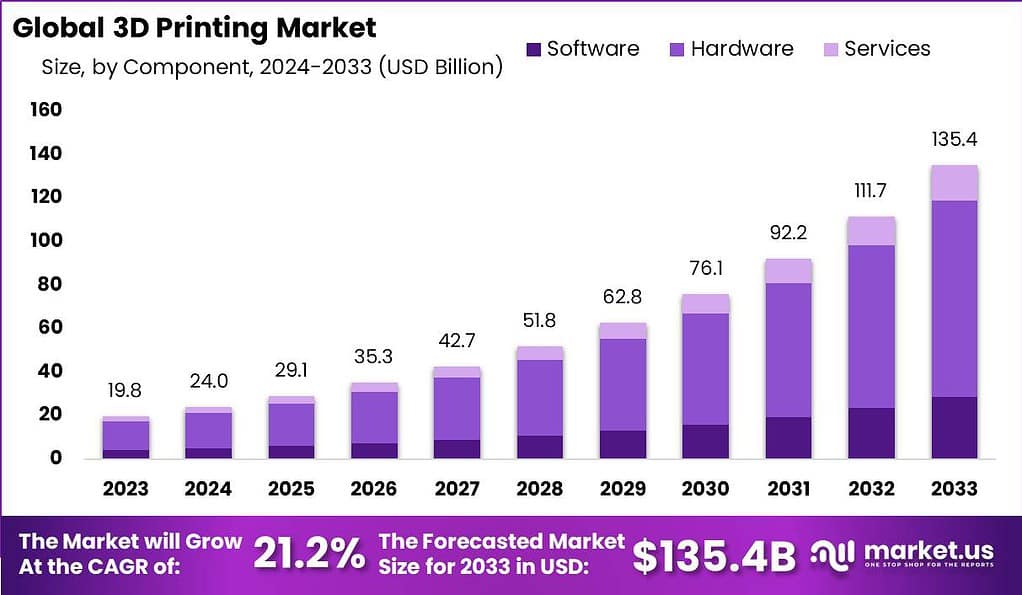
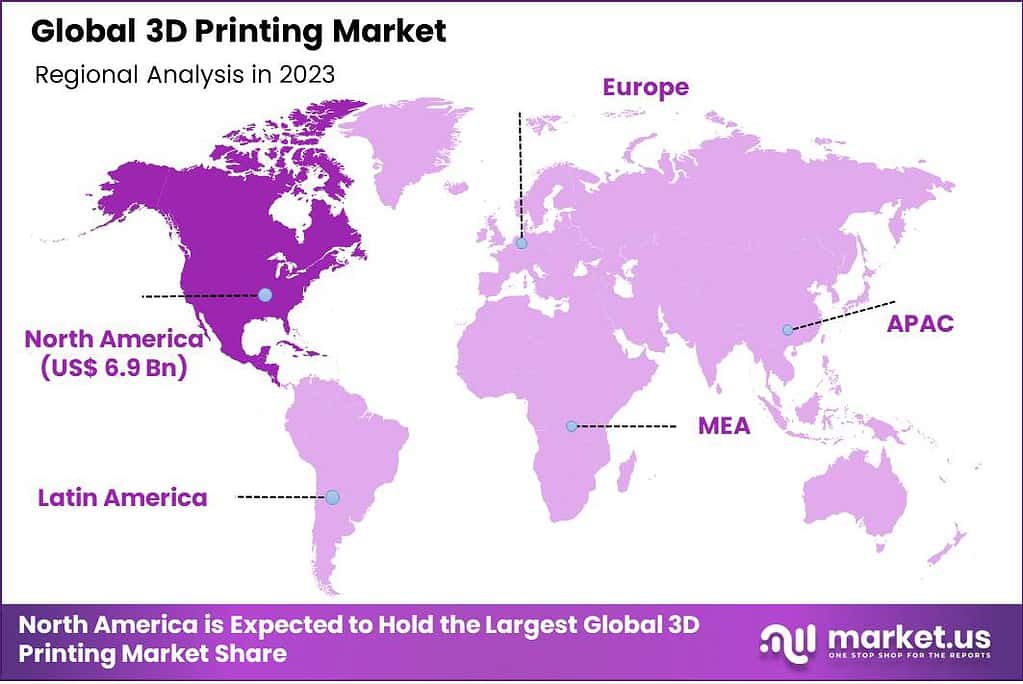
In 2023, the Global 3D Printing Market was valued at USD 19.8 billion. The market is projected to grow at a CAGR of 21.2% during 2024–2033, reaching approximately USD 135.4 billion by 2033. North America dominated the global market in 2023, accounting for more than 35.0% of the total market share and generating approximately USD 6.9 billion in revenue.
The 3D printing industry is poised for significant growth, with expected annual savings for the construction sector projected to reach $20 billion by 2025. Germany, the largest consumer of 3D printing technology in Europe, holds a substantial 37% share of the market. Notably, 47% of schools and universities worldwide have integrated 3D printers into their educational programs. The cost of modern 3D printers ranges widely from $200 to $10,000, depending on the quality and specific requirements.
In terms of market size, the United States leads with a market value of $3.1 billion, representing 22% of the global market. Meanwhile, Europe is home to 52% of all 3D printing businesses. The UK stands out as a significant player, with an estimated market size of £468 million, making it the second-largest market in Europe and the fifth-largest globally.
The global 3D printing market is expected to grow at an annual rate of 20.8%, potentially reaching a value of $62.76 billion. In the UK, the market is anticipated to reach £685 million by 2026, growing at a CAGR of around 10%.
A substantial 61% of 3D printer users have expressed a desire to increase their investment in the technology, with only 36% intending to maintain their current level of investment. On average, customers spend over £8,000 annually on 3D printing, while 23% report spending close to £80,000. These statistics underscore the robust growth trajectory and increasing adoption of 3D printing technology across various sectors.
Key Takeaways
- The Global 3D Printing Market size is projected to reach USD 135.4 Billion by 2033, up from USD 19.8 Billion in 2023, reflecting a CAGR of 21.2% during the forecast period from 2024 to 2033.
- In 2023, the Hardware segment of the 3D printing market held a dominant position, capturing more than a 67% share.
- The Industrial 3D Printer segment also maintained a leading market position in 2023, securing over a 75% share.
- The Stereolithography (SLA) segment dominated within the 3D printing industry in 2023, capturing more than an 11% share.
- In 2023, the Prototyping segment held a significant market position within the 3D printing industry, capturing over a 54% share.
- The Automotive segment within Industrial 3D Printing commanded a dominant market position in 2023, with a share exceeding 61%.
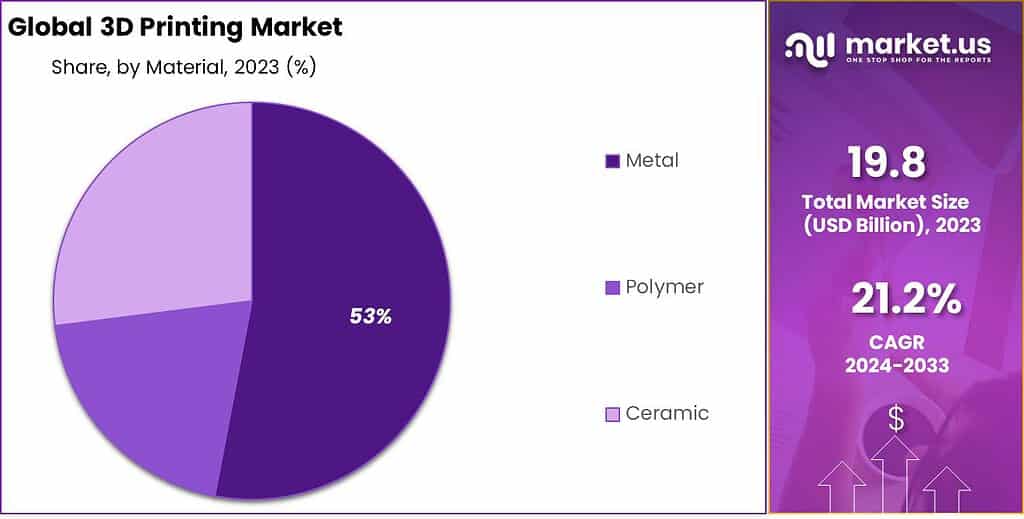
- The Metal segment led the 3D printing market in 2023, capturing more than a 53% share.
- In 2023, North America held a dominant position in the 3D printing industry, capturing over a 35% share with revenues amounting to USD 6.9 billion.
By Component
Hardware dominates with 67.0% due to high-value industrial printer installations.
Hardware leads the 3D printing market because companies invest heavily in industrial-grade printers and production systems to support in-house additive manufacturing. Large firms in automotive and aerospace deploy fleets of high-end machines that each cost from 50,000 to over 500,000 dollars, so hardware spending quickly outweighs software and services.
In India alone, government targets to raise manufacturing to 25% of GDP by FY 2025–26 and reach a 5% global additive share push factories to add new metal and polymer printers rather than only expand design software or consulting services. As more plants move from single prototype machines to lines with 10–20 printers, annual hardware unit additions rise steadily.
Services grow fastest because operators need training, workflow integration, and maintenance to keep complex hardware running at high utilization, often above 70% uptime. Consulting and on-demand printing bureaus also scale as smaller firms outsource jobs instead of buying their own systems. This mix of capital-intensive hardware adoption and growing reliance on expert support lets hardware stay the revenue anchor while service contracts expand at double-digit growth rates.
By Printer Type
Industrial 3D Printer dominates with 75% due to continuous use in factory production lines.
Industrial 3D printers hold the largest share because manufacturers use them for round-the-clock production of high-value parts. A single industrial machine can print hundreds of aerospace brackets or medical components per month, and large plants commonly run more than 20 units, so output capacity scales far beyond desktop devices.
Metal additive manufacturing alone is forecast to reach 7.60 billion dollars in global revenue in 2026, with industrial selective laser melting technology taking over 31.3% of that market, which shows how strongly factory-grade equipment drives spending. Desktop printers, often costing under 5,000 dollars, grow fastest because their low price suits design studios, schools, and small labs that add printers in batches of 5–10 units.
By Technology
Stereolithography dominates with 11% due to precise resin curing for fine-detail components.
Stereolithography leads among listed technologies because many sectors need smooth surfaces and tight tolerances that UV-cured resins deliver. In photopolymer-based 3D printing, light sources such as lasers or LCD projectors cure layers with high accuracy, so stereolithography supports complex geometries for dental models, hearing-aid shells, and detailed casings.
Engineering plastics used in these systems handle functional gears, hinges, and covers that can face real mechanical loads. As firms move beyond concept models, they print small production runs of 100–1,000 units for medical and consumer devices using stereolithography to avoid tooling costs. Fused deposition modeling grows fastest because extrusion-based printing of thermoplastics remains the most common additive form.
By Application
Prototyping dominates with 54% due to rapid iteration needs in product development cycles.
Prototyping stands as the main application because most companies start additive programs to shorten design cycles and test shapes quickly. Design teams can print several physical prototypes in a day, compare ergonomics or fit, and adjust CAD models before investing in molds or machining.
Global additive manufacturing markets are projected to grow by nearly 24% between 2023 and 2025, and much of this expansion comes from firms that increase prototype volumes in early-stage projects rather than directly shifting full production runs.
Aerospace users already place printed brackets and ducts into aircraft assemblies, while healthcare providers adopt patient-specific surgical guides and implants. As more industries target small batch sizes of 50–500 units with complex designs, they use 3D printing for final parts rather than only testing shapes, which lifts functional part revenue growth at a higher rate than basic prototyping.
By Vertical
Automotive dominates with 61% due to widespread use in tooling and low-volume custom parts.
Automotive leads the vertical mix because carmakers and suppliers run large fleets of printers to support tooling, jigs, and short-run components. In metal additive manufacturing, aerospace applications take about 35.5% of market share, yet automotive plants often install more polymer and hybrid systems for fixtures and design models, which keeps overall automotive revenue ahead of other verticals.
Global trade analysis shows strong adoption of 3D printing in aerospace, where printed parts help reduce weight and support complex internal structures not possible with older methods. As airframe makers qualify more materials and designs, they scale from single prototypes to series of 100–300 brackets or ducts per program.
By Material
Metal dominates with 53% due to demand for high-strength parts in industrial and aerospace use.
Metal materials lead because industrial users need strong, heat-resistant parts that can replace cast or machined components. In the metal additive market, revenues are set to reach 19.13 billion dollars by 2033, with a 14.1% compound annual growth rate from 2026, which shows deep investment in metal powders and alloys.
Aerospace segments alone hold around 35.5% of this market, as they print brackets, engine components, and structural fittings that must handle extreme loads. Metal powders such as titanium and nickel-based alloys support lightweight yet strong parts, so manufacturers accept their higher cost per kilogram.
Polymers are estimated to account for 82% of the materials market in some industry datasets, while more than 80% of surveyed companies report using polymers for 3D printing tasks, showing how quickly polymer adoption has spread into mainstream operations.
Key Market Segmentation
By Component
- Software
- Hardware
- Services
By Printer Type
- Industrial 3D Printer
- Desktop 3D Printer
By Technology
- Selective Laser Sintering
- Stereolithography
- Fuse Deposition Modeling
- Direct Metal Laser Sintering
- Inkjet Printing
- Polyjet Printing
- Electron Beam Melting
- Laminated Object Manufacturing
- Digital Light Processing
- Laser Metal Deposition
- Others
By Application
- Functional Parts
- Tooling
- Prototyping
By Vertical
- Industrial 3D Printing
- Automotive
- Aerospace & Defense
- Healthcare
- Consumer Electronics
- Industrial
- Power & Energy
- Others
- Desktop 3D Printing
- Educational Purpose
- Fashion & Jewelry
- Objects
- Dental
- Food
- Others
By Material
- Metal
- Polymer
- Ceramic
Regional Analysis
In 2023, North America held a dominant market position in the 3D printing industry, capturing more than a 35% share with revenues amounting to USD 6.9 billion. This leadership can be attributed to several key factors. Primarily, the region boasts a robust technological infrastructure, which is crucial for the advancement and adoption of 3D printing technologies.
Major tech hubs such as Silicon Valley and Boston have become centers of innovation, not only providing the necessary technological prowess but also driving significant R&D activities that contribute to the evolution of 3D printing techniques and materials. Furthermore, North America is home to some of the largest players in the 3D printing industry, including companies that specialize in hardware, software, and specialized materials.
These companies benefit from the supportive venture capital environment, which facilitates continuous innovation and expansion into new applications. Industries such as aerospace, automotive, and healthcare in North America are rapidly adopting 3D printing technologies to revolutionize manufacturing processes, enhance customization, and reduce time-to-market, reinforcing the region’s leading position in the global market.
Key Regions and Countries
- North America
- US
- Canada
- Europe
- Germany
- France
- The UK
- Spain
- Italy
- Russia
- Netherlands
- Rest of Europe
- Asia Pacific
- China
- Japan
- South Korea
- India
- Australia
- Singapore
- Thailand
- Vietnam
- Rest of APAC
- Latin America
- Brazil
- Mexico
- Rest of Latin America
- Middle East & Africa
- South Africa
- Saudi Arabia
- UAE
- Rest of MEA
Market Dynamics
Drivers
| Driver | (~) % CAGR | Geographic Relevance | Impact Timeline |
|---|---|---|---|
| Shift from prototyping to serial production in regulated industries | +3.0% | North America, Europe, East Asia | Medium term (2 to 4 years) |
| Broader material ecosystem (metals, composites, medical-grade polymers) | +2.3% | Global | Medium term (2 to 4 years) |
| Industry 4.0 integration & digital manufacturing workflows | +2.0% | Global industrial hubs | Short term (2 years or less) |
| Government-backed additive manufacturing roadmaps | +1.8% | U.S., EU, India, China | Medium term (2 to 4 years) |
| Cost-down of desktop & mid-range printers | +1.5% | Global | Short term (2 years or less) |
| On-demand spare parts & tooling in industrial supply chains | +1.2% | Global manufacturing & logistics nodes | Medium term (2 to 4 years) |
Shift from prototyping to serial production in regulated industries
The shift of 3D printing from prototyping to serial production is the largest market driver, especially in aerospace, medical devices, and industrial machinery. Part volumes are increasing from tens to several thousand units per platform, while aerospace programs have adopted dozens of flight-qualified components since 2024. Additive manufacturing can reduce unit costs by 20–30% and shorten lead times from 8–12 weeks to approximately 2–4 weeks.
Patient-specific implants and surgical guides recorded strong double-digit annual growth during 2024–2025, with some orthopedic and dental companies producing more than 30% of selected product lines through 3D printing. Production-related services can generate gross margins in the mid-30% to low-40% range, compared with the mid-20% for traditional machining. This transition through 2026 could add approximately 3.0 percentage points to the baseline market CAGR.
Restraints
| Restraint | (~) % CAGR | Geographic Relevance | Impact Timeline |
|---|---|---|---|
| High cost of industrial-grade hardware & financing constraints | –2.8% | Global, more acute in emerging markets | Short term (2 years or less) |
| Export controls & trade restrictions on advanced AM materials | –2.2% | U.S.–China, EU, select Asian economies | Medium term (2 to 4 years) |
| Limited regulatory harmonization for safety-critical parts | –1.9% | Global | Medium term (2 to 4 years) |
| Access to qualified metal powders & bio-compatible materials | –1.6% | Global with stronger impact in India, ASEAN, Latin America | Short term (2 years or less) |
| High energy costs for production-scale AM operations | –1.4% | Europe, parts of Asia | Short term (2 years or less) |
| IP risk perception around digital part files | –1.1% | Global | Medium term (2 to 4 years) |
High cost of industrial-grade hardware & financing constraints
High acquisition costs for industrial-grade 3D printers and tighter financing conditions remain major restraints, particularly for small and mid-sized manufacturers. Metal powder-bed fusion systems are often priced in the mid- to high hundreds of thousands of USD per unit, while benchmark interest rates in many emerging markets remained in the mid- to high single digits during 2024–2025.
Companies with fewer than 250 employees frequently identify limited access to capital as a top-three adoption barrier. Conventional CNC and molding upgrades may offer payback periods of under 3 years, compared with 5–7 years for additive manufacturing systems. Higher depreciation and financing charges can increase operating cost ratios by 3–5 percentage points, delaying projects beyond 2026 and reducing the market’s potential CAGR by an estimated 2.8 percentage points.
Challenges
| Challenge | (~) % CAGR | Geographic Relevance | Mitigation Horizon |
|---|---|---|---|
| Skilled AM workforce gap | –2.5% | Global, especially India, ASEAN, Eastern Europe | Long term (4 years or more) |
| Process qualification & standardized quality frameworks | –2.0% | Global | Long term (4 years or more) |
| Post-processing & workflow integration complexity | –1.8% | Global industrial users | Medium term (2 to 4 years) |
| Material recyclability & sustainability performance | –1.6% | Europe, North America | Long term (4 years or more) |
| Production speed vs. mass manufacturing economics | –1.5% | Global | Medium term (2 to 4 years) |
| Design for AM adoption in legacy engineering teams | –1.3% | Global | Long term (4 years or more) |
Skilled AM workforce gap
The shortage of skilled engineers, technicians, and operators remains a major challenge for additive manufacturing. India is expected to face a deficit of several hundred thousand advanced manufacturing professionals by 2027, while similar skill gaps have been identified across Europe. Advanced manufacturing roles also carry wage premiums of 15–30%, which can reduce EBITDA margins by up to 2 percentage points for mid-sized companies.
More than 40% of companies report that limited design-for-additive-manufacturing and process-engineering expertise prevents wider production adoption. Training programs and university partnerships often require multi-year investment and several percent of annual payroll budgets. As a result, the mitigation period may extend beyond 4 years, creating an estimated 2.5 percentage-point drag on the market’s potential CAGR.
Opportunities
| Opportunity | (~) % CAGR | Geographic Relevance | Execution Window |
|---|---|---|---|
| Distributed digital manufacturing networks & on-demand print platforms | +2.7% | Global | Medium term (2 to 4 years) |
| Bioprinting & advanced medical applications | +2.4% | North America, Europe, Asia-Pacific | Long term (4 years or more) |
| Large-format construction & infrastructure printing | +2.1% | Middle East, Asia, Europe | Long term (4 years or more) |
| Subscription-based design libraries and software-led monetization | +1.9% | Global | Medium term (2 to 4 years) |
| Localized 3D printing in emerging manufacturing hubs | +1.7% | India, ASEAN, Latin America, Africa | Medium term (2 to 4 years) |
| Sustainable closed-loop material ecosystems | +1.5% | Europe, North America | Long term (4 years or more) |
Distributed digital manufacturing networks & on-demand print platforms
Distributed digital manufacturing networks and on-demand printing platforms offer a largely untapped opportunity by replacing hardware ownership with asset-light access models. These networks can reduce logistics costs by 20–40% for specialized spare parts and shorten delivery times from several weeks to a few days by producing components closer to the point of use.
Software-based services such as design validation, automated quoting, and production management can generate gross margins in the high 50% to low 60% range, compared with around the mid-30% for hardware sales. Although adoption remained limited through 2026, stronger investment and policy support over the next 2–4 years could add approximately 2.7 percentage points to the baseline CAGR by improving access for SMEs and lowering inventory and production costs.
Key Players Analysis
Tier-1 leadership in the 3D printing market rests with Stratasys, 3D Systems, Materialise and GE Additive, based on scale, diversified revenue and sustained investment. Stratasys reported 2025 revenue of USD 551.1 million, with USD 380.3 million from products and USD 170.8 million from services.
Manufacturing applications contribute 37.5% of revenue, up from just over 25% in 2020, reflecting the shift from prototyping toward production-grade polymer solutions. 3D Systems generated USD 386.9 million in 2025, including USD 179.6 million from Healthcare Solutions and USD 207.3 million from Industrial Solutions, despite a 12% year-over-year decline caused by weaker customer capital expenditure.
Materialise reported EUR 267.6 million in revenue in 2025, with Medical revenue growing 15.4%, while Manufacturing revenue declined 13.2% to EUR 92.5 million. GE Additive benefited from GE Aerospace’s 21% adjusted revenue growth and 32% order increase in 2025, while additive-driven DPT orders rose 19% and revenue increased 11%, supporting USD 1.3 billion in operating profit.
Tier-2 challengers, including Autodesk, EnvisionTEC and Made In Space, operate in specialized areas of the 3D printing market. Autodesk supports millions of CAD and simulation users, indirectly driving printer demand across the Stratasys, 3D Systems and Materialise ecosystems.
Made In Space, now part of Redwire, focuses on in-orbit manufacturing supported by multi-million-dollar NASA and commercial contracts. Tier-1 companies are estimated to control 45–55% of the addressable 3D printing systems and services market. Stratasys holds approximately 12–15%, while 3D Systems and Materialise together account for around 15–20%.
Top Key Players in the 3D Printing Market
- Stratasys Ltd
- Materialise
- EnvisionTec Inc
- 3D Systems Inc
- GE Additive
- Autodesk Inc
- Made In Space
- Canon Inc
- Voxeljet AG
- Other Key Players
Recent Developments
- In 2025, Arc Impact acquired Desktop Metal’s core additive manufacturing assets, including Adaptive3D and EnvisionTEC, in a multi-asset transaction that consolidated key polymer and binder jet 3D printing technologies under a single investor platform and folded the ExOne and voxeljet binder jet operations into one holding structure to streamline industrial capacity.
- In 2025, Voxeljet and ExOne were merged into a unified industrial binder jet organization under common ownership, creating a combined metal and sand 3D printing portfolio addressing a total additive manufacturing market estimated at 16 billion USD in 2025, up 10.2 percent year on year.
- In 2025, Materialise consolidated its i.materialise and Materialise OnSite 3D printing service platforms into a single integrated service environment, rationalizing capacity and order flow for industrial and professional customers while maintaining access to multi-technology fleets covering polymer and metal additive manufacturing.
Report Scope
| Report Features | Description |
|---|---|
| Market Value (2023) | US$ 19.8 Bn |
| Forecast Revenue (2033) | US$ 135.4 Bn |
| CAGR (2024-2033) | 21.2% |
| Base Year for Estimation | 2023 |
| Historic Period | 2018-2022 |
| Forecast Period | 2024-2033 |
| Report Coverage | Revenue Forecast, Market Dynamics, COVID-19 Impact, Competitive Landscape, Recent Developments |
| Segments Covered | By Component (Software, Hardware, Services), By Printer Type (Industrial 3D Printer, Desktop 3D Printer), By Technology (Selective Laser Sintering, Stereolithography, Fuse Deposition Modeling, Direct Metal Laser Sintering, Inkjet Printing, Polyjet Printing, Electron Beam Melting, Laminated Object Manufacturing, Digital Light Processing, Laser Metal Deposition, Others), By Application (Functional Parts, Tooling, Prototyping), By Vertical(Industrial 3D Printing [Automotive, Aerospace & Defense, Healthcare, Consumer Electronics, Industrial, Power & Energy, Others], Desktop 3D Printing [Educational Purpose, Fashion & Jewelry, Objects, Dental, Food, Others]), By Material (Metal, Polymer, Ceramic) |
| Regional Analysis | North America – The US, Canada, & Mexico; Western Europe – Germany, France, The UK, Spain, Italy, Portugal, Ireland, Austria, Switzerland, Benelux, Nordic, & Rest of Western Europe; Eastern Europe – Russia, Poland, The Czech Republic, Greece, & Rest of Eastern Europe; APAC – China, Japan, South Korea, India, Australia & New Zealand, Indonesia, Malaysia, Philippines, Singapore, Thailand, Vietnam, & Rest of APAC; Latin America – Brazil, Colombia, Chile, Argentina, Costa Rica, & Rest of Latin America; The Middle East & Africa – Algeria, Egypt, Israel, Kuwait, Nigeria, Saudi Arabia, South Africa, Turkey, United Arab Emirates, & Rest of MEA. |
| Competitive Landscape | Stratasys Ltd, Materialise, EnvisionTec Inc, 3D Systems Inc, GE Additive, Autodesk Inc, Made In Space, Canon Inc, Voxeljet AG, Other Key Players |
| Customization Scope | Customization for segments, region/country-level will be provided. Moreover, additional customization can be done based on the requirements. |
| Purchase Options | We have three licenses to opt for: Single User License, Multi-User License (Up to 5 Users), and Corporate Use License (Unlimited Users and Printable PDF) |





































