


Report Overview
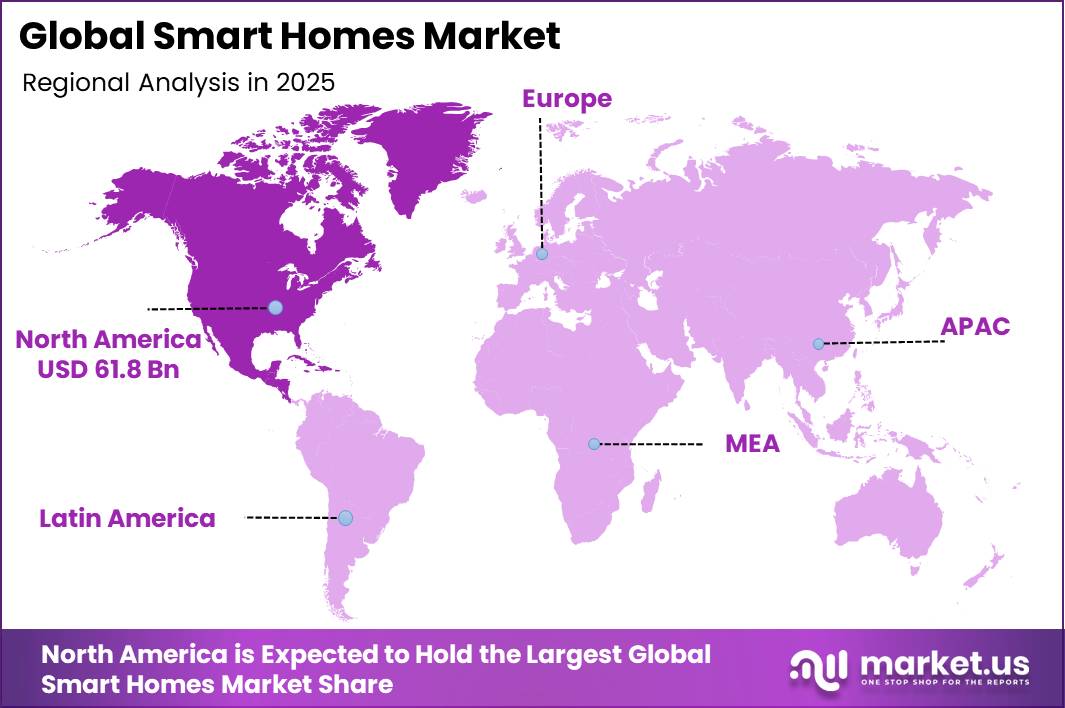
In 2025, the Global Smart Homes Market was valued at approximately USD 174.7 billion and is projected to expand at a CAGR of 19.1% from 2026 to 2035, reaching nearly USD 1,009.1 billion by 2035. North America dominated the market in 2025, contributing around 35.4% of global revenue, equivalent to approximately USD 61.8 billion.
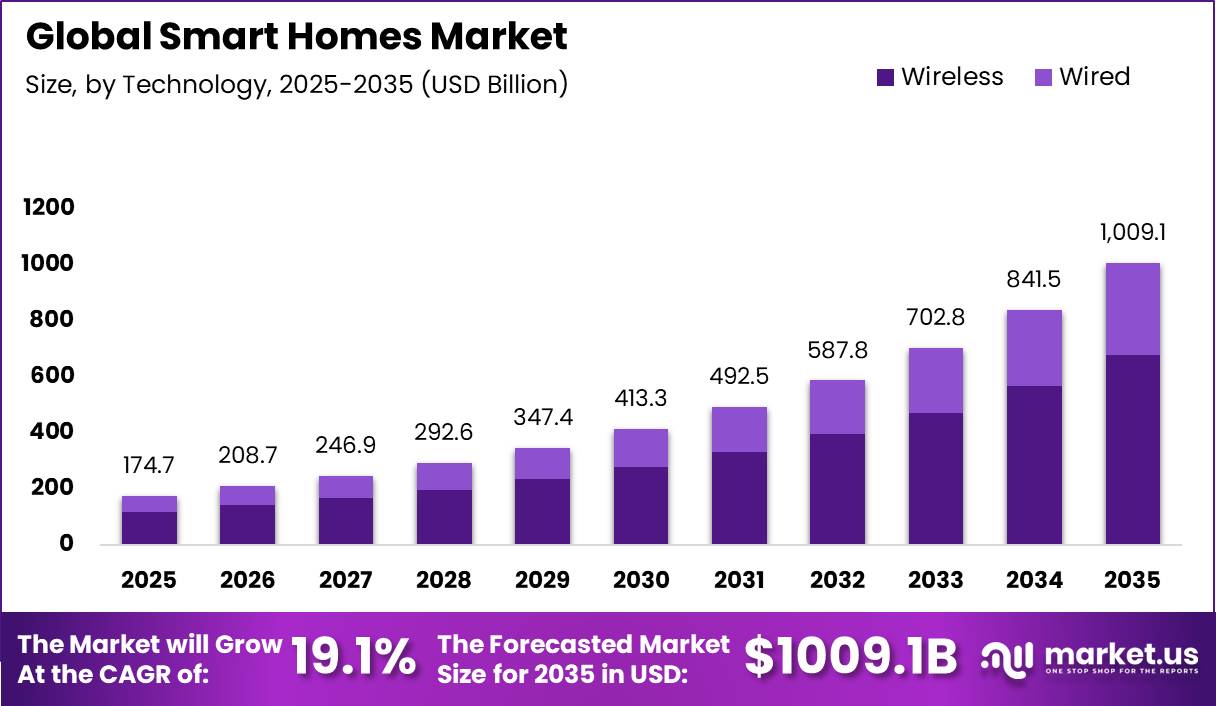
The market growth is driven by increasing adoption of connected home technologies, rising residential construction, growing demand for home security solutions, and the need for energy-efficient systems. The rapid growth of internet connectivity is creating a strong foundation for smart home adoption.
According to the International Telecommunication Union (ITU), 5.5 billion people were using the internet in 2024, representing 68% of the global population, enabling wider access to cloud-based and app-controlled smart devices. Additionally, IDC reported global smart home device shipments of about 892.3 million units in 2024, with shipments expected to exceed 931 million units in 2025, reflecting continued demand for smart sensors, connected appliances, and home automation platforms.
Strong residential construction activity is further supporting market expansion, as new and renovated homes increasingly integrate smart lighting, thermostats, and security systems. Moreover, energy-saving benefits are accelerating adoption, with the International Energy Agency (IEA) highlighting that digital solutions such as smart thermostats and lighting systems can reduce building energy consumption by up to 10% globally, with higher savings possible in individual homes.
Key Takeaway
- The Smart Homes Market was valued at USD 174.70 billion in 2025 and is projected to reach USD 1,009.10 billion by 2035.
- The market is expected to grow at a strong CAGR of 19.1% during 2026 to 2035.
- The Wireless segment dominated by technology, accounting for 67.3% share, supported by easy installation and connected device adoption.
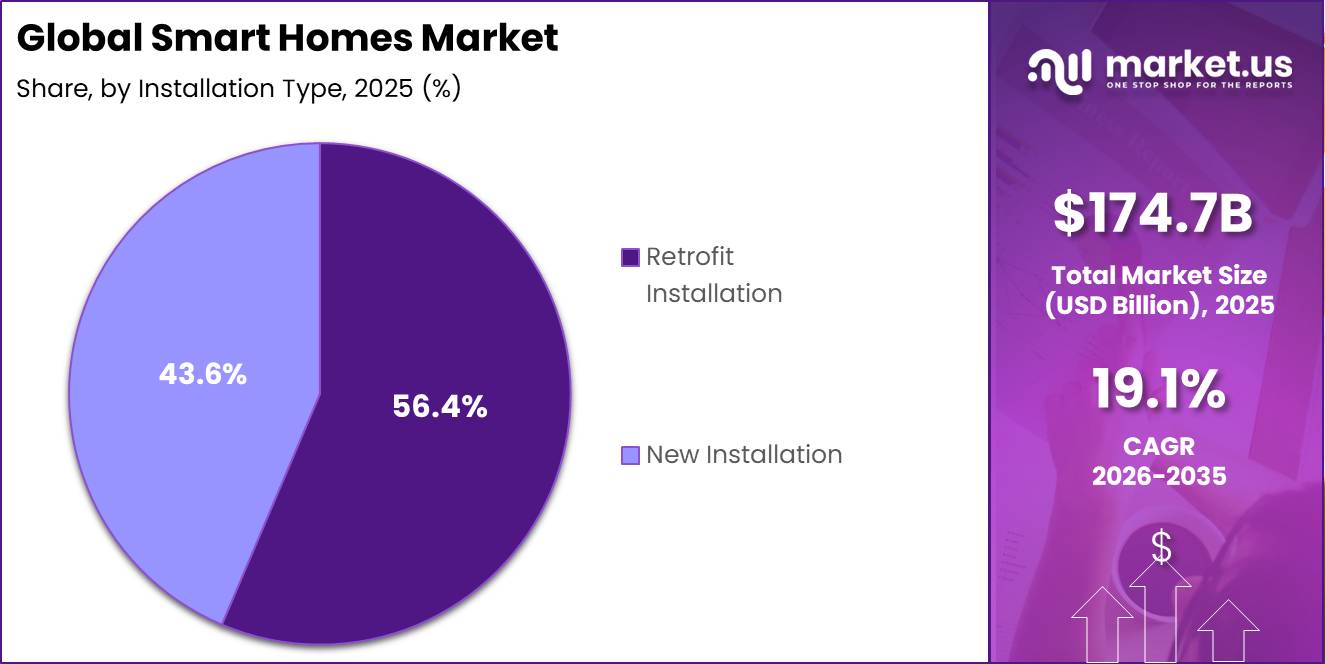
- Retrofit Installation led the installation type segment with 56.4% share, driven by upgrades in existing homes.
- Security & Access Controls dominated the product segment with 26.8% share in 2025, supported by rising use of smart locks, cameras, and monitoring systems.
- Individual Homeowners led the end-user segment with 72.3% share in 2025, due to growing demand for automation, security, and energy efficiency.
- North America dominated the global market with 35.4% share and a value of USD 61.80 billion in 2025.
By Technology
Wireless technologies hold the leading position in smart home connectivity, accounting for 67.3% of the market share, due to their flexibility, cost efficiency, and compatibility with existing residential infrastructure. Unlike wired systems that require extensive cabling and structural modifications, wireless solutions enable faster installation and easier integration of smart devices, making them highly suitable for both new construction and home renovation projects.
The widespread availability of high-speed internet connectivity is further supporting wireless smart home adoption. In OECD countries, fibre connections account for around 42% of fixed broadband subscriptions, while 5G represents approximately 28% of mobile broadband subscriptions, providing reliable connectivity for connected home ecosystems. This strong digital infrastructure allows seamless operation of smart lighting, security cameras, thermostats, voice assistants, and connected appliances without the need for complex wiring.
By Installation Type
Retrofit installation commands the largest share of smart home projects, accounting for 56.4% of the market share, as it targets the massive existing residential building stock that significantly exceeds annual new construction activity worldwide. In developed economies, new buildings add only around 1–1.5% to the total building stock each year, meaning more than 98% of residential floor space is already built and requires upgrading rather than replacement.
OECD housing data further indicates that annual housing completions generally represent only 1–3% of existing dwellings, highlighting the critical role of retrofit solutions in driving smart home adoption. The increasing focus on energy efficiency and carbon reduction is strengthening demand for retrofit-based smart home systems.
Buildings account for approximately 30% of global final energy demand and contribute more than one-third of energy-related CO₂ emissions, making them a major focus area for efficiency improvements. According to the International Energy Agency (IEA) net-zero pathway, around 20% of existing building stock must be renovated to “zero-carbon-ready” levels by 2030, requiring large-scale deployment of smart controls, sensors, and connected devices.
By Product Type
Security and access controls command the largest share of smart home spending, accounting for 26.85% of the market share, as these solutions address one of the most important household concerns: property security and protection against intrusion. Although burglary rates have declined in some developed markets, security risks remain significant.
The United States recorded approximately 780,000 burglaries in 2024, with more than half occurring at residential properties. Similarly, South Africa reported around 1.5 million housebreaking incidents affecting 5.7% of households in 2024/25, highlighting the continued need for advanced home security solutions.
Growing concerns about property protection are encouraging homeowners to prioritize security devices such as smart locks, video doorbells, surveillance cameras, and access-control systems over other smart home categories focused on convenience or entertainment.
By End User
Individual homeowners form the dominant end-user segment in the smart home market, accounting for 72.3% of the market share, as they represent the largest portion of occupied housing stock and make most long-term residential technology investment decisions.
In the European Union (EU), 68% of people lived in owner-occupied homes in 2024, while homeownership rates in many OECD economies exceed 70–80%, creating a large customer base that directly benefits from energy savings, improved comfort, enhanced security, and increased property value through smart home solutions.
Key Market Segments
By Technology
- Wired
- Wireless
By Installation Type
- New Installation
- Retrofit Installation
By Product
- Security & Access Controls
- Remote Monitoring Software & Services
- Security Cameras
- Smart Locks
- Video Door Phones
- Others
- Lighting Control
- Dimmers
- Occupancy Sensors
- Relays & Switches
- Smart Lights
- Others
- Entertainment Devices
- Smart Displays/TV
- Sound bars and Speakers
- Streaming Devices
- HVAC
- Sensors
- Smart Thermostats
- Smart Vents
- Others
- Smart Kitchen Appliances
- Cooktops
- Dish Washers
- Microwave/Ovens
- Refrigerators
- Home Appliances
- Smart Vacuum Cleaners
- Smart Washing Machines
- Smart Water Heaters
- Smart Furniture
- Home Healthcare
- Others
By End User
- Individual Homeowners
- Rental Housing Owners & Operators
- Residential Builders & Developers
Market Dynamics
Challenge
Interoperability fragmentation remains a major challenge for the smart home market because mixed communication protocols, uneven Matter adoption, legacy hubs, and inconsistent firmware compatibility continue to create integration issues across lighting, HVAC, security, and connected appliances.
In 2026, these interoperability challenges are estimated to reduce market growth by approximately 1.4 percentage points, as failed device pairing, automation conflicts, and app fragmentation increase product returns and raise support costs by an estimated 8–12% per connected household compared with standardized ecosystems.
The issue is most evident in North America, Europe, and advanced APAC markets, where consumers increasingly expect seamless multi-brand connectivity. Addressing this challenge will require broader adoption of standardized device certification, unified reference architectures, and software-driven orchestration platforms that reduce setup complexity from 6–8 user steps to 2–3, with meaningful ecosystem alignment expected over the next 2–4 years.
| Challenge | (~) % CAGR | Geographic Relevance | Mitigation Horizon |
|---|---|---|---|
| Interoperability fragmentation | -1.4% | North America, EU, APAC metros | Medium term |
| Semiconductor input volatility | -1.1% | APAC supply hubs, North America, EU | Short term |
| Cloud dependency latency | -0.8% | North America, EU, urban APAC | Medium term |
| Cybersecurity trust burden | -1.0% | North America, EU, GCC premium markets | Long term |
| Installation and support gaps | -0.9% | North America, LATAM, tier-2 APAC cities | Medium term |
| Energy-grid integration complexity | -0.7% | EU, North America, Australia, Japan | Long term |
Opportunity
Emerging-market mid-tier smart housing is a significant growth opportunity because most current smart home forecasts remain concentrated on affluent households in North America, Europe, and developed Asian cities, while mass-market residential developments in India, ASEAN, Latin America, and the Middle East remain underpenetrated.
If developers, utilities, and financial institutions introduce standardized smart-ready home packages priced at approximately 2–4% of construction cost (around USD 1,000–3,000 per apartment), and 20–30% of new mid-tier homes adopt these packages between 2028 and 2035, the market could generate an additional USD 40–60 billion in annual equipment and platform revenue by the mid-2030s.
Growth will depend on affordability-focused models such as mortgage- or rent-linked financing, utility-backed repayment plans, and developer-bundled subscriptions that reduce upfront costs while addressing local needs such as energy reliability, security, and community management. As these models mature, they could contribute approximately 2.0 percentage points of additional global smart home CAGR from 2028 onward, particularly across India, ASEAN, and Latin America.
| Opportunity | (~) % Potential
CAGR |
Geographic Relevance | Execution Window |
|---|---|---|---|
| Grid-interactive energy & VPP monetization | +2.5% | North America, EU, APAC urban | Medium term (2–4 years) |
| Integrated home health & aging-in-place platforms | +2.2% | North America, EU, Japan, China | Medium term (2–4 years) |
| AI-native orchestration & subscription bundles | +1.8% | North America core, EU, APAC tier-1 | Short term (≤ 2 years) |
| Emerging-market mid-tier smart housing | +2.0% | India, ASEAN, LatAm, Middle East | Long term (≥ 4 years) |
| Security-insurance risk-sharing models | +1.5% | North America, EU, developed APAC | Medium term (2–4 years) |
| B2B2C new-build & retrofit platforms | +1.7% | Global, especially China, EU, India | Long term (≥ 4 years) |
Driver
Energy-efficiency mandates and building retrofit programs are among the strongest structural drivers of the smart home market in 2026, as governments increasingly promote electrification, lower energy consumption, and higher building performance standards. These policies are accelerating demand for connected energy management technologies in both new construction and existing buildings.
Regulatory measures are driving adoption of smart thermostats, occupancy sensors, lighting controls, HVAC automation, and whole-home energy management systems because these solutions deliver measurable energy savings. Typical smart control systems can reduce lighting energy consumption by 7–27%, with many devices offering 1–3-year payback periods, making investment decisions more attractive for homeowners and commercial building operators.
| Driver | (~) % Impact on CAGR | Geographic Relevance | Impact Timeline |
|---|---|---|---|
| Energy-efficiency mandates and building retrofit cycles | +2.4% | EU core, North America, APAC metros | Medium term (2-4 years) |
| Interoperability standardization via Matter and Thread | +1.9% | North America core, EU, APAC consumer hubs | Short term (≤ 2 years) |
| AI, edge processing, and local automation upgrades | +2.2% | North America core, China, EU premium segments | Medium term (2-4 years) |
| Security, privacy, and cybersecurity demand | +1.6% | North America, EU, developed APAC | Short term (≤ 2 years) |
| Utility savings and HVAC/load optimization economics | +1.8% | North America, EU, GCC, urban APAC | Short term (≤ 2 years) |
| Connected-device penetration and smart city spillover | +1.5% | APAC corridors, MENA urban nodes, South America spill-over | Long term (≥ 4 years) |
Restraint
Interoperability fragmentation remains a key challenge for the smart home market because, despite the progress of Matter and Thread, multiple communication protocols and vendor-specific extensions continue to create compatibility issues across connected devices.
These differences increase integration complexity, extending device integration cycles by 15–30%, raising field incompatibility and return rates by 10–20% in mixed-brand ecosystems, and adding 0.5–2% to bill-of-material costs along with 1–4% to development budgets through additional certification and firmware work.
The resulting fragmentation increases customer acquisition costs for platform providers, requires installers to deploy extra middleware or gateway hardware, and slows ecosystem expansion. Overall, these challenges are estimated to reduce smart home market growth by approximately 1.2 percentage points until universal interoperability standards achieve broader adoption.
| Restraint | (~) % Impact on CAGR | Geographic Relevance | Impact Timeline |
|---|---|---|---|
| Semiconductor/component shortages | -3.0% | Global (APAC supply nodes, North America demand) | Short to Medium term (≤2 → 4 yrs) |
| Rising cyber/privacy regulation compliance | -1.8% | EU core, UK, California, India (metro pilots) | Medium term (2–4 yrs) |
| Interoperability fragmentation (protocol drift) | -1.2% | North America core, EU, APAC corridors | Short to Medium term (≤2 → 3 yrs) |
| Inflation & hardware cost escalation | -1.5% | Global (EMEA, NA, APAC price-sensitive corridors) | Short term (≤2 yrs) |
| Channel & installer labor shortage | -1.0% | North America core, Western Europe | Short to Medium term (≤2 → 3 yrs) |
| Consumer trust/adoption lag due to privacy incidents | -0.8% | North America, EU, urban APAC | Medium to Long term (2–4+ yrs) |
Geopolitical Impact Analysis
Geopolitical tensions are creating high cost and supply chain challenges for the smart homes market by disrupting the availability and movement of key components such as semiconductors, printed circuit boards (PCBs), communication modules, and finished smart devices. These disruptions are increasing manufacturing costs, extending delivery timelines, and creating pressure on original equipment manufacturers (OEMs) to redesign products, source alternative components, and diversify production networks.
According to UNCTAD, more than 80% of global trade by volume is transported by sea, and continued volatility in container shipping costs could increase global consumer prices by approximately 0.6% by 2025 if elevated freight rates continue. Disruptions at major trade routes, including the Suez and Panama Canals, are adding uncertainty for smart home companies dependent on China–Europe and China–US supply chains for Wi-Fi modules, sensors, and device components.
The global semiconductor shortage during 2020–2023 further highlighted supply chain vulnerabilities, extending lead times for critical integrated circuits to around 15 weeks, the highest level since 2017, and impacting more than 169 electronics-intensive industries. As a result, smart home manufacturers increased inventory levels of microcontrollers and connectivity chipsets, increasing working capital requirements and delaying product launches.
Regional Analysis
North America Dominates the Smart Homes Market with Strong Technological Adoption
North America leads the global smart homes market, accounting for 35.4% of the market share with an estimated market value of USD 61.8 billion. The region’s dominance is supported by high consumer awareness, strong digital infrastructure, and early adoption of connected home technologies across the United States and Canada.
Widespread penetration of Internet of Things (IoT) ecosystems, along with growing demand for smart security systems, voice-controlled devices, connected appliances, and energy management solutions, continues to drive market expansion.
Asia Pacific represents the fastest-growing region in the smart homes market, driven by rapid urban development, rising disposable incomes, expanding middle-class populations, and increasing technology adoption. Government-led smart city initiatives, improvements in digital connectivity, and growing demand for automated residential solutions are accelerating market growth across the region.
Key Regions and Countries
North America
- US
- Canada
Europe
- Germany
- France
- The UK
- Spain
- Italy
- Rest of Europe
Asia Pacific
- China
- Japan
- South Korea
- India
- Australia
- Rest of APAC
Latin America
- Brazil
- Mexico
- Rest of Latin America
Middle East & Africa
- GCC
- South Africa
- Rest of MEA
Key Players Analysis
The global smart homes market is moderately concentrated, with a Tier-1 cluster controlling an estimated 35–45% of connected home devices and platform revenue. Leading companies maintain strong positions through integrated IoT ecosystems, cloud platforms, smart appliances, security solutions, and connected home automation technologies. These companies benefit from large corporate revenue bases, enabling continuous investment in artificial intelligence (AI), connectivity, and smart device innovation.
Amazon reported approximately USD 717 billion in revenue in 2025 and USD 77.6 billion in net profit, supporting its smart home ecosystem through connected devices, voice assistants, security solutions, and subscription-based services.
Alphabet Inc. generated around USD 402.8 billion in revenue and USD 132.2 billion in net income in 2025, while allocating nearly USD 185 billion toward AI and data infrastructure, strengthening its connected home and intelligent automation capabilities.
Samsung Electronics reported KRW 14.1 trillion (approximately USD 10–11 billion) in quarterly revenue from Visual Display and Digital Appliances in Q2 2025 and is targeting 70% AI-enabled appliance revenue contribution within one year, compared with 10% previously, highlighting its focus on SmartThings-connected appliances. Haier Smart Home strengthens its market position through integrated smart appliance ecosystems and is estimated to hold around 12–18% of the global smart home appliance market share.
Top Key Players in the Market
- Xiaomi
- Vivint, LLC
- Snap One, LLC
- Signify Holdings
- Siemens
- Schneider Electric
- Samsung
- Robert Bosch Smart Home GmbH
- LG Electronics
- Johnson Controls International plc
- Honeywell International, Inc.
- Fantasia Trading LLC
- Crestron Electronics, Inc.
- Apple, Inc.
- Alphabet, Inc.
- ABB
Recent Developments
- In February 2025, Google LLC expanded Matter integration across Google Home to support new industrial-grade sensors from partners including Siemens AG, enabling cross-over smart-home control between residential and light-industrial environments.
- In April 2025, Samsung Electronics Co. Ltd. launched its Connected Living 2025 initiative, committing that all new home products from televisions to refrigerators will be interoperable under a unified smart-home ecosystem, covering a portfolio that contributed to a market opportunity of USD 426.09 billion in home automation-related devices and services.
Report Scope
| Report Features | Description |
|---|---|
| Market Value (2025) | USD 174.7 Billion |
| Forecast Revenue (2035) | USD 1,009.1 Billion |
| CAGR (2026-2035) | 19.1% |
| Base Year for Estimation | 2025 |
| Historic Period | 2020-2024 |
| Forecast Period | 2026-2035 |
| Report Coverage | Revenue Forecast, Market Dynamics, Competitive Landscape, Recent Developments |
| Segments Covered | By Technology (Wired and Wireless), By Installation Type (New Installation and Retrofit Installation), By Product (Security & Access Controls, Lighting Control, Entertainment Devices, HVAC, Smart Kitchen Appliances, Home Appliances, Smart Furniture, Home Healthcare, and Others), By End User (Individual Homeowners, Rental Housing Owners & Operators, and Residential Builders & Developers) |
| Regional Analysis | North America – US, Canada; Europe – Germany, France, The UK, Spain, Italy, Rest of Europe; Asia Pacific – China, Japan, South Korea, India, Australia, Singapore, Rest of APAC; Latin America – Brazil, Mexico, Rest of Latin America; Middle East & Africa – GCC, South Africa, Rest of MEA |
| Competitive Landscape | Xiaomi, Vivint, LLC, Snap One, LLC, Signify Holdings, Siemens, Schneider Electric, Samsung, Robert Bosch Smart Home GmbH, LG Electronics, Johnson Controls International plc, Honeywell International, Inc., Fantasia Trading LLC, Crestron Electronics, Inc., Apple, Inc., Alphabet, Inc., ABB |
| Customization Scope | Customization for segments and region/country levels will be provided. Moreover, customization can be tailored to the requirements. |
| Purchase Options | We have three licenses to opt for: Single User License, Multi-User License (Up to 5 Users), Corporate Use License (Unlimited Users and Printable PDF) |





























