


Report Overview
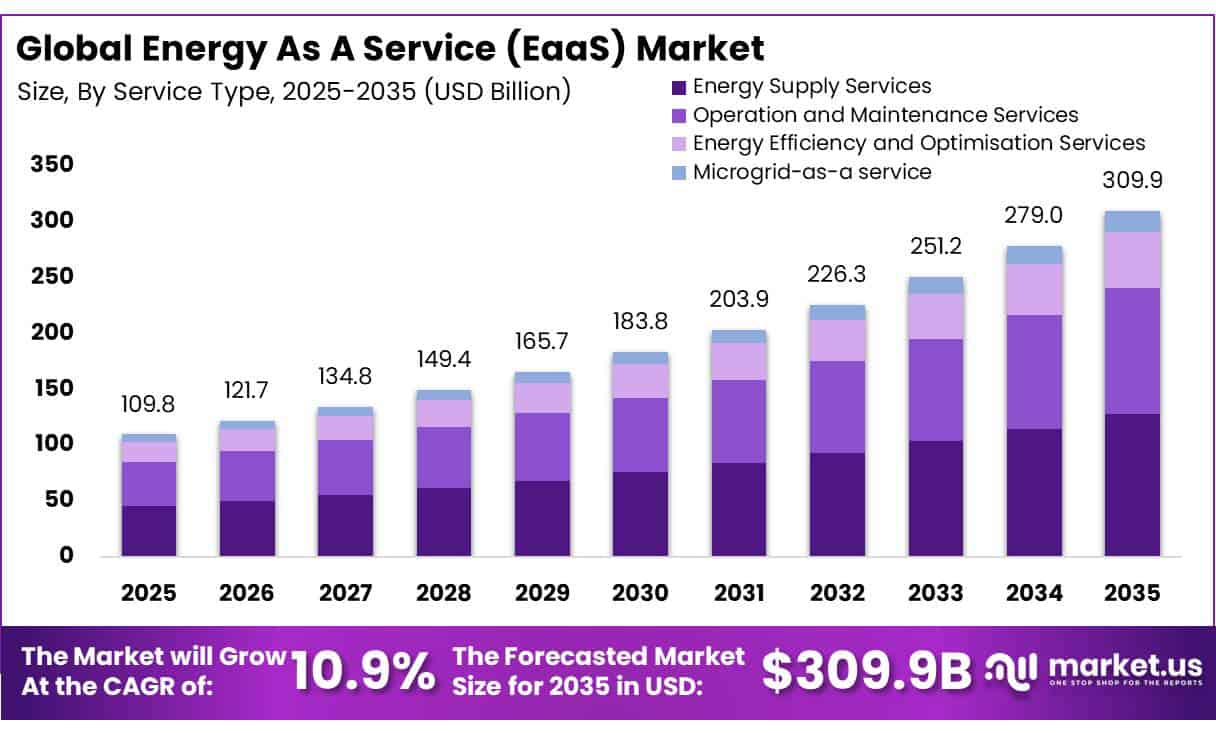
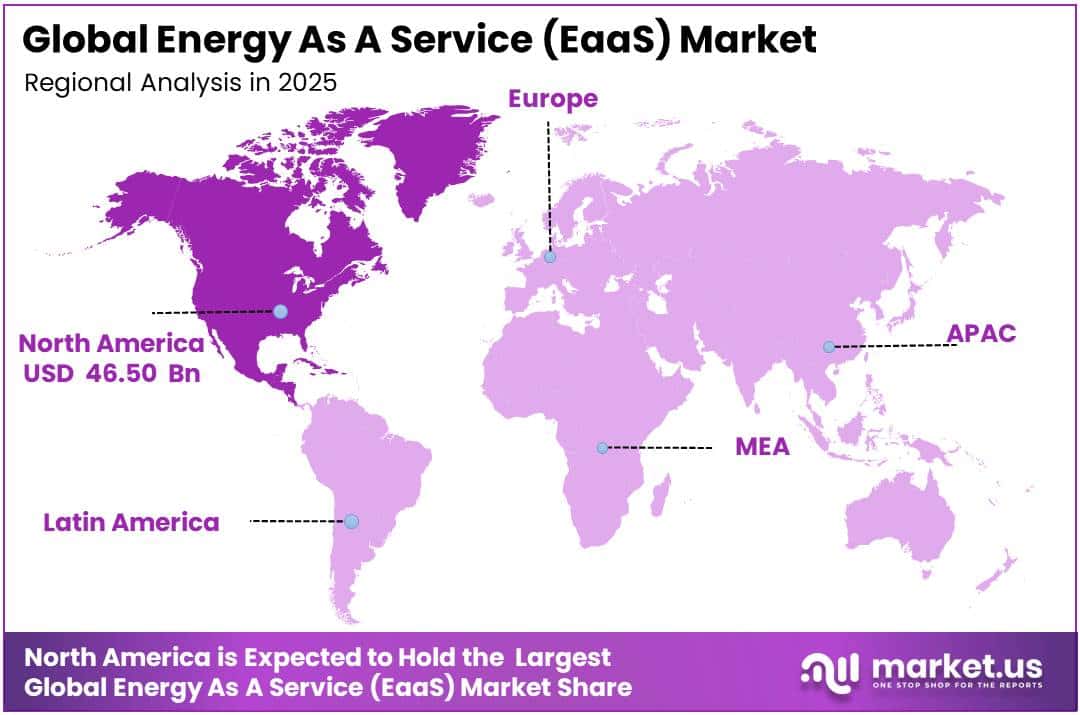
In 2025, the Energy As A Service (EaaS) Market was valued at USD 109.8 Billion, and between 2026 and 2035, this market is estimated to register a CAGR of 10.9%, reaching about USD 309.9 Billion by 2035. North America held a dominant market position, capturing more than a 42.34% share, holding USD 46.50 Billion in revenue.
Energy as a Service (EaaS), a delivery model in which specialized providers design, finance, install, and operate energy efficiency and generation assets for a recurring fee rather than upfront capital, sits closely alongside the global Energy Service Company (ESCO) market, which supplies primary verifiable data for this segment.
Global investment in ESCO projects grew by 10% in 2024, reaching a record USD 42 billion, with the sector’s average annual growth reaching 5% over the past five years, more than double the rate recorded since 2020, signaling accelerating industrial adoption of performance-based energy service models worldwide.
- ESCO projects achieved average reported energy savings of around 25% relative to baseline consumption in 2024, with established markets such as Europe, the United States, and South Korea reporting average savings between 20% and 30%, reinforcing confidence in guaranteed-savings contracting structures.
Regional trends reveal expanding opportunity beyond established hubs. China’s project values rose from about USD 5.9 billion in the early 2010s to over USD 22 billion in 2024, supported by successive Five-Year Plans. In Poland, more than 130 energy cooperatives adopted ESCO business models in 2025, double the previous year, while in Italy, where 900 companies are certified as ESCOs, average market revenues increased by over 78% in the past three years.
The European Commission’s 2025 Action Plan for Affordable Energy includes an objective to double the size of energy efficiency services in Europe, while China’s renewed emphasis on energy performance contracting under its Carbon Peaking and Carbon Neutrality Plans provides a clear pathway for further expansion.
Separately, the International Energy Agency (IEA) notes that investments in more efficient buildings, transportation, and industry would need to triple from USD 660 billion to about USD 1.9 trillion in 2030 to align with the Net Zero Emissions (NZE) Scenario.
Key Takeaways
- The Global Energy as a Service (EaaS) Market was valued at USD 109.8 billion in 2025.
- The global market is projected to grow at a CAGR of 10.9% and is estimated to reach USD 309.9 billion by 2035.
- On the basis of service type, Energy Supply Services dominated the market, constituting 41.23% of the total market share.
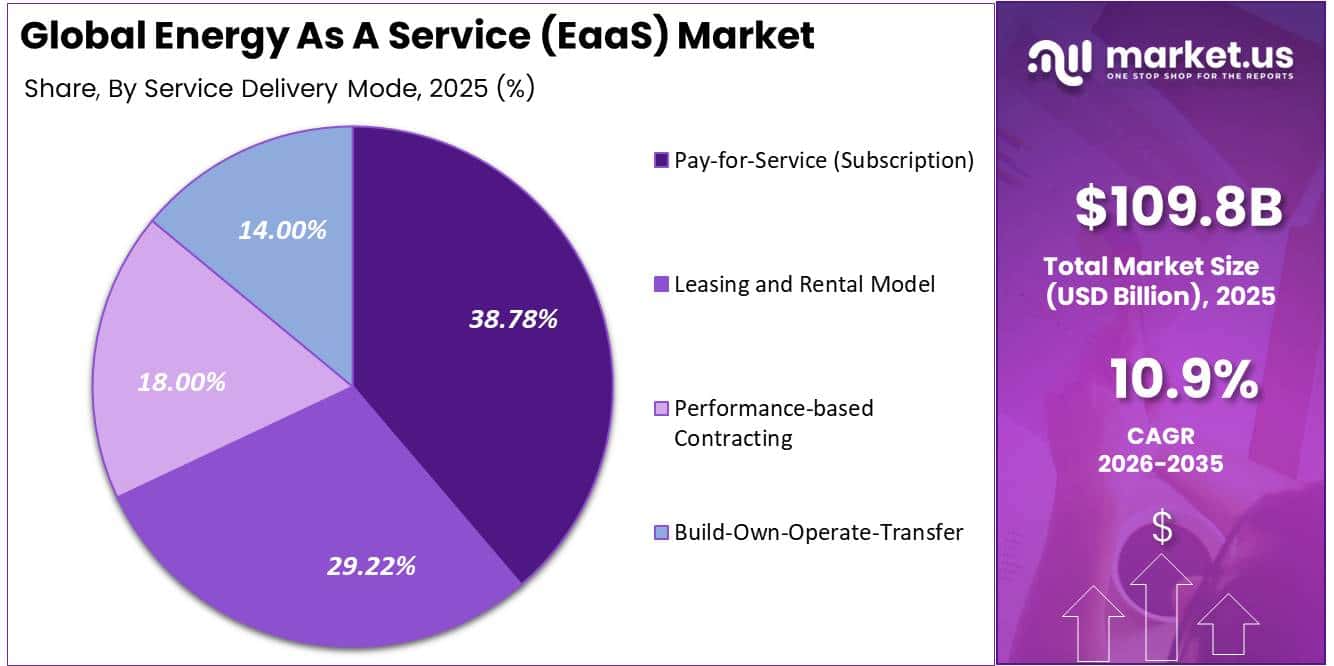
- Based on the service delivery mode, Pay-for-Service (Subscription) dominated the market, accounting for 38.78% of the total market share.
- Based on the end user, Commercial dominated the market, accounting for 67.89% of the total market share.
- In 2025, North America was the most dominant region in the energy as a service (EaaS) market, accounting for 42.34% of the global market.
Service Type
Energy Supply Services dominates with 41.23% share as organizations prioritize reliable energy delivery and predictable operating costs.
In 2025, Energy Supply Services held a dominant market position, capturing more than a 41.23% share. The segment maintained its leading position as organizations increasingly preferred long-term energy supply agreements that ensured stable electricity availability while reducing the burden of managing energy procurement internally. Businesses across commercial buildings, industrial facilities, healthcare centers, and public infrastructure continued to rely on integrated energy supply solutions to improve energy security and simplify operations.
Operation and Maintenance Services is projected to be the fastest-growing segment during the forecast period. Growth is being supported by the increasing number of distributed energy assets, renewable power systems, battery storage installations, and smart building infrastructure that require continuous monitoring and professional maintenance.
Asset owners are placing greater emphasis on improving equipment performance, reducing unplanned downtime, and extending system life through preventive and predictive maintenance programs. The expansion of digital monitoring platforms, remote diagnostics, and data-driven maintenance strategies is also creating new opportunities for service providers.
By Service Delivery Mode
Pay-for-Service (Subscription) dominates with 38.78% share as flexible payment models improve affordability and energy management.
In 2025, Pay-for-Service (Subscription) held a dominant market position, capturing more than a 38.78% share. The segment led the market as organizations increasingly preferred subscription-based energy solutions that reduced upfront capital investment while providing access to reliable energy services through predictable recurring payments. This model enabled commercial, industrial, and institutional users to adopt advanced energy technologies without significant ownership costs, making budgeting and financial planning easier.
The growing focus on energy efficiency, digital monitoring, and performance-based energy management further supported the adoption of subscription services. Utilities and energy service providers also expanded flexible service offerings to help customers improve operational efficiency while meeting sustainability goals. As a result, the subscription model remained the preferred service delivery approach for organizations seeking convenience, cost control, and long-term energy performance.
Leasing and Rental Model is projected to be the fastest-growing segment during the forecast period. The segment is expanding as businesses seek greater flexibility in deploying energy equipment without making large capital investments. Leasing arrangements allow customers to access renewable energy systems, battery storage, smart meters, and other energy assets while avoiding ownership responsibilities and reducing financial risk.
By End User
Commercial sector dominates with 67.89% share as businesses continue investing in efficient and reliable energy services.
In 2025, Commercial held a dominant market position, capturing more than a 67.89% share. The segment maintained its leadership as offices, retail centers, hospitals, educational institutions, hotels, and other commercial facilities increasingly adopted Energy as a Service solution to improve energy efficiency and reduce operating costs.
The integration of smart energy management systems, distributed energy resources, and renewable power solutions also supported wider adoption across commercial properties. This approach enabled organizations to focus on their core operations while benefiting from optimized energy performance, making the commercial sector the largest end user in the market.
Industrial is projected to be the fastest-growing segment during the forecast period. Growth is being driven by rising energy demand across manufacturing plants, processing facilities, warehouses, and other industrial operations that require dependable and cost-efficient power solutions. Industries are increasingly adopting Energy as a Service models to improve operational efficiency, reduce energy-related expenses, and support decarbonization initiatives without making substantial upfront investments.
Key Market Segments
By Service Type
- Energy Supply Services
- Energy Efficiency and Optimisation Services
- Operation and Maintenance Services
- Microgrid-as-a service
By Service Delivery Mode
- Pay-for-Service (Subscription)
- Performance-based Contracting
- Build-Own-Operate-Transfer
- Leasing and Rental Model
By End User
- Commercial
- Industrial
Driver Analysis
Hyperscaler-Led Corporate PPA Procurement
Global corporate clean power purchase agreements totaled 55.9 GW in 2025, a 10 percent pullback from the record 62.1 GW signed in 2024, yet hyperscalers alone continued to dominate deal flow, with Meta and Amazon jointly contracting 20.4 GW including 4.7 GW of nuclear capacity. In North America specifically, the “Big Four” hyperscalers accounted for 76 percent of PPA volume in Q4 2025, a share that climbed to 90 percent by early 2026, confirming that data center operators have effectively become the price-setting buyer class for utility-scale renewable contracts.
This concentration is restructuring EaaS provider business models away from fragmented commercial-and-industrial retail contracts toward large-format, 10-15 year offtake structures bundled with on-site generation, storage, and reliability guarantees, shifting provider revenue recognition from transactional supply margins to long-duration annuity-style contracts.
Europe added 12.6 GW of new PPA-contracted capacity in 2025 across a record 276 long-term deals, even as EMEA volumes fell 13 percent year-over-year to 17 GW, signaling that deal count is rising even as average deal size compresses, a trend that favors EaaS aggregators capable of pooling smaller corporate buyers into portfolio-scale contracts.
Drivers Impact Analysis
| Driver | (~) % Impact on CAGR Forecast | Geographic Relevance | Impact Timeline |
|---|---|---|---|
| Hyperscaler-led corporate PPA and clean power procurement demand | +2.9% | North America core, EU spill-over, APAC (India, South Korea) | Medium term (2-4 years) |
| US federal tax credit rollback (OBBBA) reshaping financing structures | -1.5% | North America core (US) | Short term (≤2 years) |
| EU grid congestion, connection reform and flexibility mandates | +2.2% | EU core (Germany, France, Netherlands), UK spill-over | Medium term (2-4 years) |
| Distributed energy resources and microgrid capex-free adoption models | +2.5% | North America, EU, APAC corridors | Short to medium term |
| Data center and AI load growth driving reliability-as-a-service contracts | +2.7% | North America core, APAC (India, Southeast Asia), Middle East | Short term (≤2 years) |
| Corporate net-zero standard revisions tightening Scope 1-3 accountability | +1.6% | Global, EU/North America compliance-led | Long term (≥4 years) |
Restraint Analysis
Grid Interconnection Queue Backlogs
US interconnection queues have swollen to an estimated 2,000-2,600 GW of stalled capacity across ISOs and RTOs, with MISO alone holding over 170 GW awaiting study and PJM carrying more than 60 GW still under review heading into 2026, while the median time from application to commercial operation has stretched toward five years and select data-center-linked projects face delays cited at up to 12 years by hyperscale developers; in Europe, the average interconnection queue delay reached 38 months as of August 2026 against 24 months in 2022, with over 450 GW of renewable capacity stranded and roughly 12 percent of potential wind and solar output at curtailment risk, meaning EaaS providers structuring behind-the-meter generation to bypass queues still face grid-tie approval delays of 24-40 months for any grid-interactive component, directly stretching contract payback periods by an estimated 2-3 years and forcing providers to underwrite larger battery buffers, adding roughly 8-15 percent to upfront capital stacks to de-risk projects against interconnection timeline slippage.
Restraint Impact Analysis
| Restraint | (~) % Impact on CAGR | Geographic Relevance | Impact Timeline |
|---|---|---|---|
| Transformer and switchgear supply shortages delaying deployment | -2.6% | North America core, EU, APAC | Medium term (2-4 years) |
| Grid interconnection queue backlogs stalling on-site generation | -2.1% | North America core, EU spill-over | Medium to long term |
| Elevated interest rates raising cost of long-duration EaaS financing | -1.8% | Global, North America and EU core | Short to medium term |
| US federal incentive rollback undermining project bankability | -1.4% | North America core (US) | Short term (≤2 years) |
| Long-term contract complexity and counterparty credit risk | -1.1% | Global, emerging APAC and LATAM acute | Medium term (2-4 years) |
| Fragmented regulatory and utility tariff structures across regions | -0.9% | EU core, APAC corridors | Long term (≥4 years) |
Opportunity Analysis
SMB Micro-EaaS Monetization
Today’s EaaS commercial motion is architected almost entirely around large-format enterprise and hyperscaler contracts worth millions of dollars, leaving an estimated 60-70 percent of the small-and-medium-business energy spend pool commercial buildings under 50,000 square feet, multi-site retail chains, and light-industrial operators effectively unaddressed because current customer-acquisition costs of 50,000-150,000 dollars per enterprise deal make sub-500,000-dollar SMB contracts commercially unviable under legacy sales models; this is a genuine white space rather than an extension of existing drivers because it requires an entirely new go-to-market architecture built on standardized, self-service subscription tiers priced at 500-3,000 dollars per month with automated remote onboarding, which could compress customer acquisition costs by 60-75 percent and unlock a segment currently representing under 8 percent of total EaaS provider revenue despite comprising a majority of addressable commercial energy accounts, with early movers plausibly capturing 15-20 percent gross margin expansion once onboarding is templatized across a fleet of thousands of small accounts rather than dozens of large ones.
Opportunity Impact Analysis
| Opportunity | (~) % Potential CAGR Upside | Geographic Relevance | Execution Window |
|---|---|---|---|
| SMB micro-EaaS monetization via bundled subscription tiers | +2.4% | North America, EU secondary cities, APAC emerging | Medium term (2-4 years) |
| Virtual power plant aggregation as a new revenue vector | +3.1% | North America core, EU, Australia | Short to medium term |
| Fleet electrification depot-charging-as-a-service white space | +2.7% | North America, EU core, APAC urban centers | Short term (≤2 years) |
| M&A roll-up of fragmented regional EaaS and O&M providers | +1.9% | North America, EU, LATAM secondary markets | Medium term (2-4 years) |
| Data-monetization layer via energy analytics and carbon-reporting SaaS | +1.5% | Global, EU compliance-led, North America | Long term (≥4 years) |
| Emerging-market off-grid and mini-grid EaaS expansion | +2.0% | APAC (India, Southeast Asia), Africa, LATAM | Long term (≥4 years) |
Challenges Analysis
Skilled Electrician and Line-Worker Talent Deficit
The structural vulnerability stems from a demographic mismatch between retiring tradespeople and new-entrant flow, with the US Department of Energy’s 2025 report finding 89 percent of transmission, distribution, and storage construction employers reporting hiring difficulty and only an estimated 15 percent of data-center electrician applicants meeting minimum qualification thresholds; the IEA’s 2026 survey of 700 energy companies found more than half reporting critical bottlenecks, and Goldman Sachs projects US transmission-and-distribution apprenticeships must rise from 45,000 in 2024 to 65,000 annually just to match demand, with an additional 207,000 transmission workers and 300,000 manufacturing and construction roles needed by 2030 to add 300 GW of capacity a gap the IEA estimates requires a 40 percent rise in new qualified entrants and 2.6 billion dollars in annual global training investment to close by 2030; for EaaS providers this translates into installation and commissioning delays of an estimated 4-10 weeks per project beyond original schedules and labor cost inflation of 12-20 percent on skilled trades line items, forcing providers to build in-house apprenticeship pipelines, deploy remote commissioning and AI-assisted diagnostics to offset headcount gaps, and increasingly subcontract cross-regionally to arbitrage localized labor shortages.
Challenges Impact Analysis
| Challenge | (~) % CAGR Friction Drag | Geographic Relevance | Mitigation Horizon |
|---|---|---|---|
| Skilled electrician and line-worker talent deficit | -1.7% | North America core, EU, APAC | Long term (≥4 years) |
| OT/IT cybersecurity exposure across distributed assets | -1.3% | North America core, EU regulatory hubs | Medium term (2-4 years) |
| Battery and storage raw-material price volatility | -1.1% | Global, APAC manufacturing corridors | Medium term (2-4 years) |
| Interoperability friction across legacy and smart assets | -0.8% | EU, North America, APAC logistics corridors | Medium term (2-4 years) |
| Third-party vendor and firmware supply chain risk | -0.9% | Global, North America critical-infra hubs | Long term (≥4 years) |
| Contract standardization and performance-verification gaps | -0.6% | Global, emerging APAC and LATAM acute | Medium term (2-4 years) |
Geopolitical Impact Analysis
Ongoing Geopolitical Conflicts Are Accelerating Demand for Flexible Energy Service Models.
The ongoing conflicts in the Middle East and the continued Russia-Ukraine war are reshaping the Energy as a Service (EaaS) market by increasing concerns over fuel supply, electricity reliability, and energy security. Higher fuel price volatility and disruptions in global shipping have encouraged businesses to reduce dependence on conventional energy sources and adopt service-based energy solutions that include on-site generation, battery storage, and renewable energy systems.
- According to the International Energy Agency (IEA), around 20 million barrels per day of crude oil and oil products moved through the Strait of Hormuz in 2025, representing about 25% of global seaborne oil trade, while nearly 20% of global LNG exports also relied on this route. These figures highlight the growing importance of uninterrupted energy supply and stronger energy resilience
As a result, businesses are increasingly adopting localized and digitally managed energy systems to reduce dependence on unstable fuel markets and improve operational continuity. Organizations are also investing in energy efficiency and long-term service agreements to better manage operating costs during uncertain geopolitical conditions.
Governments are strengthening energy security strategies by supporting distributed energy resources, smart grids, and renewable energy integration. As global geopolitical tensions continue, Energy as a Service is expected to play a larger role in helping commercial and industrial users secure stable energy access while reducing exposure to supply chain disruptions and fuel price volatility.
Regional Analysis
Energy As A Service (EaaS) Market – Regional Segmental Analysis: North America.
North America represents the dominant regional market for Energy as a Service, accounting for 42.34% of global share, valued at USD 46.50 billion, reflecting the region’s mature Energy Service Company (ESCO) infrastructure and long-standing performance contracting policy support.
- The United States anchors this dominance through the U.S. Department of Energy’s (DOE) Federal Energy Management Program (FEMP), under which 455 DOE Indefinite-Delivery, Indefinite-Quantity (IDIQ) Energy Savings Performance Contract (ESPC) projects have been awarded since 1998, representing nearly USD 8.9 billion invested in federal energy efficiency and renewable energy improvements and resulting in approximately USD 19.3 billion in cumulative energy cost savings and approximately 633 trillion British Thermal Units (Btu) in life cycle energy savings.
Fiscal year 2020 alone recorded ESPC project investment of nearly USD 842 million, the third consecutive record year in DOE ESPC program history at that time. Performance realization data further substantiates outcomes, with fiscal year 2021 ESPC projects reporting 110.0% of guaranteed cost savings achieved against contractor guarantees of 92.6% of estimated savings.
Key Regions and Countries Covered
- North America
- The US
- Canada
- Europe
- Germany
- France
- The UK
- Spain
- Italy
- Russia & CIS
- Rest of Europe
- APAC
- China
- Japan
- South Korea
- India
- ASEAN
- Rest of APAC
- Latin America
- Brazil
- Mexico
- Rest of Latin America
- Middle East & Africa
- GCC
- South Africa
- Rest of MEA
Key Players Analysis
Energy as a Service (EaaS) providers compete by expanding integrated energy solutions that combine energy supply, efficiency services, digital monitoring, distributed generation, battery storage, and long-term performance-based contracts. Companies focus on helping commercial, industrial, and institutional customers reduce upfront capital spending while improving energy reliability and operational efficiency.
A major competitive strategy is the use of smart energy management platforms, artificial intelligence, Internet of Things (IoT) technologies, and real-time analytics to optimize energy consumption and lower operating costs. Providers also strengthen their market position by offering customized service agreements, renewable energy integration, microgrid development, and electric vehicle charging infrastructure.
Leading companies such as Schneider Electric SE, Engie SA, Honeywell International Inc., Veolia Environnement SA, Electricité de France (EDF) SA, Johnson Controls International plc, Bernhard, Enel SpA, Sparkfund, Siemens AG, ABB Ltd., and Centrica Business Solutions are expanding their capabilities through strategic partnerships, digital innovation, and investments in clean energy technologies.
Many providers are increasing the deployment of decentralized energy systems, advanced building automation, and predictive maintenance services to meet evolving customer requirements. They are also strengthening collaborations with utilities, technology firms, equipment manufacturers, and infrastructure developers to deliver complete energy solutions under a single service model.
The Major Players in The Industry
- Schneider Electric SE
- Engie SA
- Honeywell International Inc.
- Veolia Environnement SA
- Electricité de France (EDF) SA
- Johnson Controls International plc
- Bernhard
- Enel SpA
- Sparkfund
- Siemens AG
- ABB Ltd.
- Centrica Business Solutions
- Other Key Players
Key Development
- In June 2025, Engie SA entered a framework agreement with Airbus to decarbonize 22 industrial sites across France, Germany, and Spain, following a competitive tender signed at the Paris Air Show. Under the agreement, Engie will design, build, and operate on-site infrastructure including heat pumps, biomass boilers, and photovoltaic systems, targeting a 20% cut in Airbus’s energy consumption and an 85% reduction in Scope 1 and 2 greenhouse gas emissions at selected sites by 2030 versus 2015 levels, while expanding Engie’s industrial decarbonization portfolio from 160 to 250 sites by 2030.
- In February 2026, Centrica Business Solutions began delivering 14 megawatts (MW) of solar photovoltaic and electric vehicle (EV) charging infrastructure across 16 schools in the Los Angeles Unified School District (LAUSD), including 10 years of operations and maintenance, supporting the district’s target of scaling districtwide clean-energy capacity to more than 400 MW as part of its transition to 100% clean, renewable energy by 2040.
- In March 2026, Veolia Environnement SA advanced the multi-energy transformation of its Karviná heating plant in the Czech Republic, targeting a full coal exit by 2029 while continuing to serve approximately 50,000 households. The project’s second phase will decommission the plant’s remaining four coal-fired boilers and is expected to cut annual carbon dioxide (CO2) emissions by 200,000 tonnes, equivalent to removing approximately 47,000 passenger cars from the road for one year.
- In April 2026, Johnson Controls International plc released its 2026 Sustainability Report, disclosing that its energy efficiency and decarbonization technologies helped customers cut more than USD 9.5 billion in energy and operating costs across thousands of projects worldwide, while avoiding emissions equivalent to nearly 6 million United States (U.S.) homes.
Report Scope
| Report Features | Description |
|---|---|
| Market Value (2025) | US$109.8 Bn |
| Forecast Revenue (2035) | US$309.9 Bn |
| CAGR (2026 2035) | 10.9% |
| Base Year for Estimation | 2025 |
| Historic Period | 2020-2024 |
| Forecast Period | 2026-2035 |
| Report Coverage | Revenue Forecast, Market Dynamics, Competitive Landscape, Recent Developments |
| Segments Covered | By Service Type (Energy Supply Services, Energy Efficiency and Optimisation Services, Operation and Maintenance Services, Microgrid-as-a-Service), By Service Delivery Mode (Pay-for-Service (Subscription), Performance-based Contracting, Build-Own-Operate-Transfer, Leasing and Rental Model), By End User (Commercial, Industrial) |
| Regional Analysis | North America The US & Canada; Europe Germany, France, The UK, Spain, Italy, Russia & CIS, Rest of Europe; APAC China, Japan, South Korea, India, ASEAN & Rest of APAC; Latin America Brazil, Mexico & Rest of Latin America; Middle East & Africa GCC, South Africa, & Rest of MEA |
| Competitive Landscape | Schneider Electric SE, Engie SA, Honeywell International Inc., Veolia Environnement SA, Electricité de France (EDF) SA, Johnson Controls International plc, Bernhard, Enel SpA, Sparkfund, Siemens AG, ABB Ltd., Centrica Business Solutions, and other key players. |
| Customization Scope | Customization for segments, region/country level will be provided. Moreover, additional customization can be done based on the requirements. |
| Purchase Options | We have three licenses to opt for: Single User License, Multi User License (Up to 5 Users), Corporate Use License (Unlimited Users and Printable PDF) |





































