


Report Overview
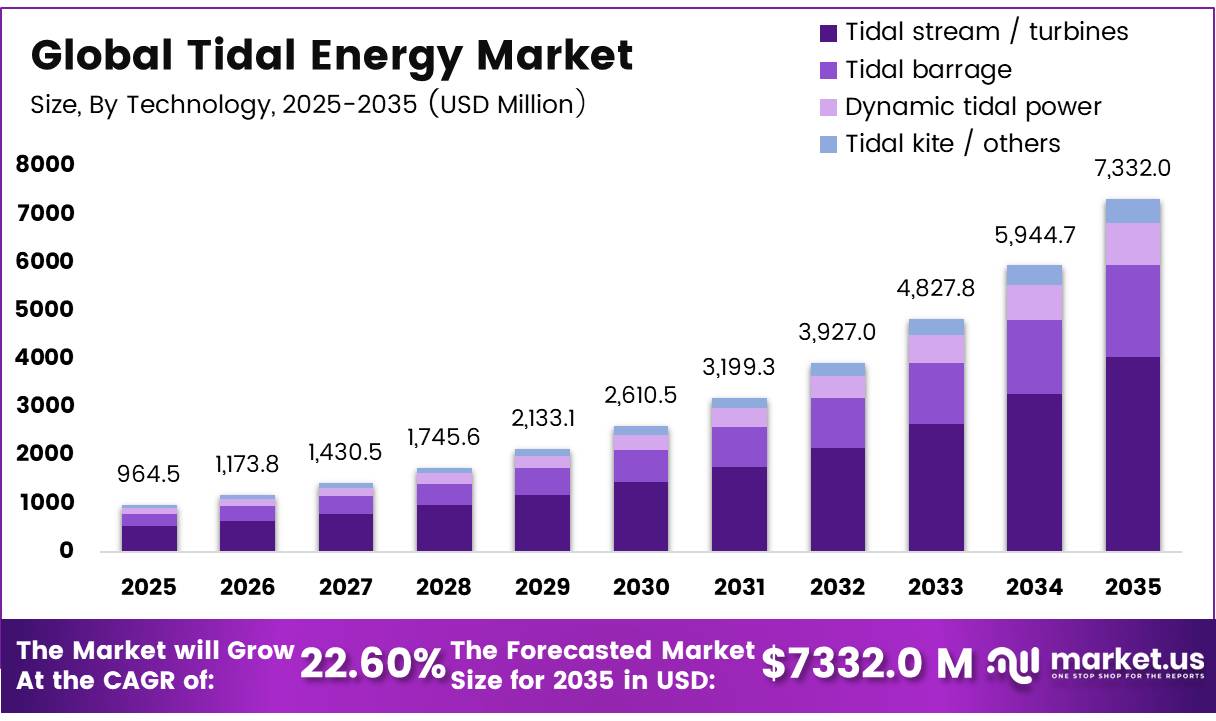
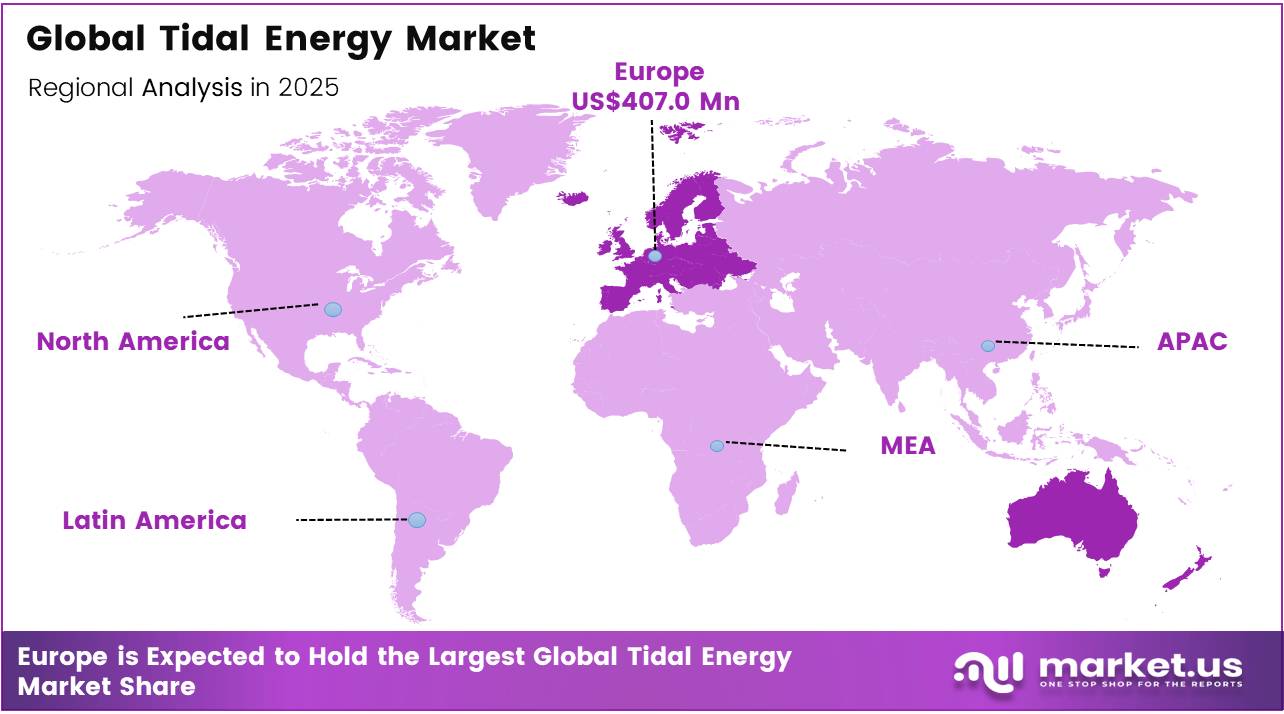
In 2025, the Global Tidal Energy Market was valued at USD 964.5 million, and between 2026 and 2035, this market is estimated to register a CAGR of 22.60%, reaching about USD 7,332.0 million by 2035. In 2025, Europe held a dominant market position, capturing more than a 42.2% share, holding USD 407.0 million revenue.
Tidal energy is developing as a specialised renewable industry that converts predictable marine currents into electricity through seabed-mounted and floating turbines. Its dependable generation profile can support grids containing variable wind and solar resources.
IRENA recorded 494 MW of global ocean-energy capacity at the end of 2024. In Europe, tidal projects had generated 106 GWh cumulatively, while 152 MW across 11 pre-commercial farms formed the publicly supported pipeline.The industrial scenario is moving from demonstration machines toward repeatable multi-turbine arrays, supported by improved blades, foundations, subsea cables and remote monitoring.
- The United Kingdom’s fifth Contracts for Difference round awarded 53.04 MW of tidal-stream capacity at £198/MWh. Its sixth round secured another 28 MW at £172/MWh, demonstrating falling support prices and stronger government commitment to commercial-scale deployment.
Key Takeaways
- The global Tidal Energy market was valued at US$964.5 million in 2025.
- The global Tidal Energy market is projected to grow at a CAGR of 22.60% and is estimated to reach US$7,332.0 million by 2035.
- On the basis of By Technology, the Tidal stream / turbines dominated the market, constituting 55.1% of the total market share.
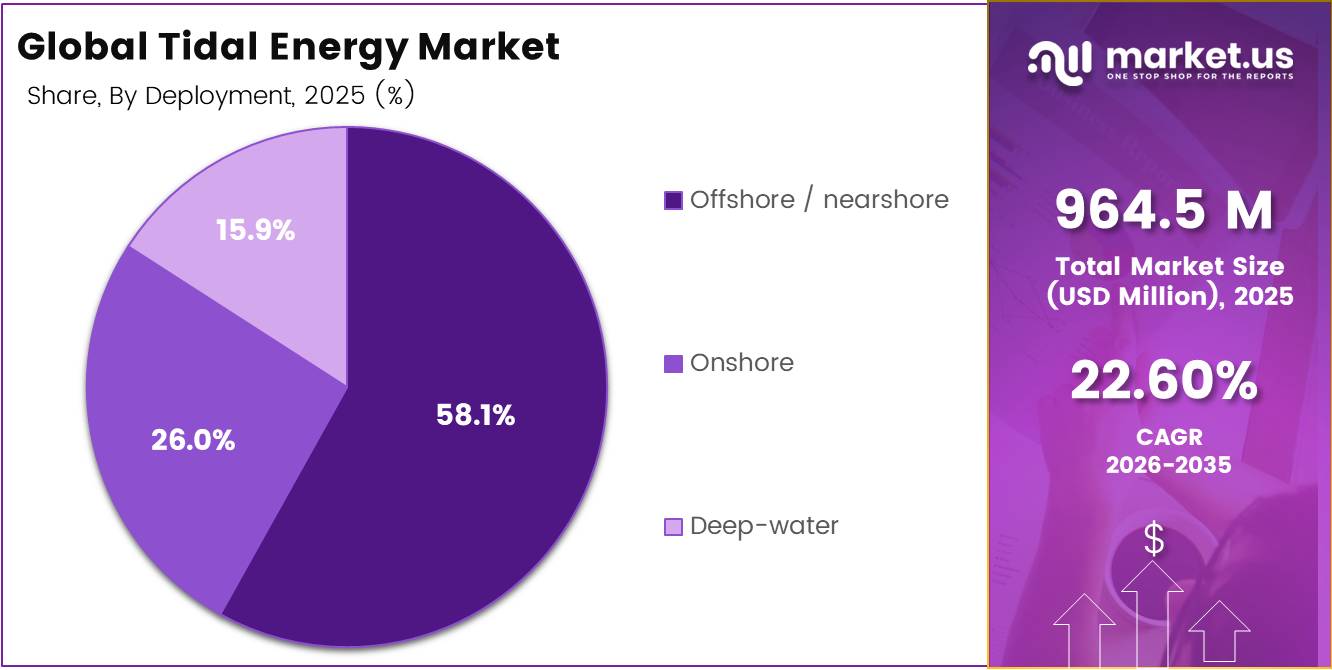
- Based on the By Deployment, the Offshore / nearshore dominated the Tidal Energy market, with a substantial market share of around 58.1%.
- Based on the Component, Turbines led the market, comprising 76.2% of the total market.
- Among the Application, the Grid power generation held a major share in the Tidal Energy market, 82.3% of the market share.
- In 2025, the Europe was the most dominant region in the Tidal Energy market, accounting for 42.2% of the total global consumption.
Future growth will depend on cost reduction, standardised manufacturing, simpler permitting and reliable offshore maintenance. The U.S. Department of Energy introduced a $45 million tidal and current-energy programme, including up to $35 million for demonstration-site development and $10 million for community-led planning. The programme targets a 1–5 MW pilot installation, creating opportunities for turbine manufacturers, marine contractors, coastal infrastructure providers and grid-integration specialists.
By Technology Analysis
Tidal stream / turbines represents dominant Segment in the Market.
Tidal stream and turbine technology held the leading position, accounting for 55.1% of the market. Its advantage comes from modular turbines that can be installed in phases and positioned in strong coastal currents without building a dam. The U.S. Department of Energy estimates that tidal resources contain 440 TWh of theoretical annual energy and 220 TWh of technically recoverable generation. This recoverable resource could power approximately 21 million homes and represents 5.4% of U.S. electricity generation, supporting future demand for turbines, foundations, cables and monitoring equipment.
Dynamic tidal power is the fastest-growing technology, supported by its potential to capture tidal-phase differences along extended coastal structures. Although commercial deployment remains limited, the underlying resource opportunity is considerable. The UK Government estimates its theoretical tidal-range resource at 25–30 GW, sufficient to meet around 12% of electricity demand. The Severn Estuary represents 8–12 GW of this potential, while the east coast offers another 5–6 GW, creating opportunities for engineering studies and demonstration projects.
By Deployment Analysis
Offshore and nearshore a significant type.
Offshore and nearshore deployment held the leading position, accounting for 58.1% of the tidal energy market. These locations provide stronger and more consistent currents while allowing turbines to be fixed to the seabed or suspended from anchored floating structures. The UK Government’s latest renewable auction secured 20.9 MW from 4 tidal projects. Its 2025 energy policy also expects tidal developments exceeding 100 MW to enter planning by the late 2020s, supporting larger arrays, subsea cables and offshore maintenance activity.
Deep-water deployment is the fastest-growing segment as floating systems and improved mooring technologies open sites farther from shore. The U.S. Department of Energy reported that Alaska’s Railbelt grid could support 200 MW of tidal energy today and 300 MW after planned upgrades. Tidal generation could reduce grid emissions by 37% and supply up to 20% of future electricity demand, highlighting the long-term potential for deeper offshore installations.
By Component Analysis
Turbines Are the Most Widely Used component.
Turbines held the dominant position, accounting for 76.2% of the tidal energy market. Their central role in capturing current energy keeps demand focused on stronger blades, reliable rotors and lower-maintenance designs. In November 2025, the U.S. Department of Energy approved continued testing of a full-scale 160 kW tidal turbine through moored trials and design refinement. In April 2026, DOE also approved laboratory and open-water testing of composite blades at the Atlantic Marine Energy Center, supporting improved durability and operating performance.
Control systems are the fastest-growing component as larger arrays require real-time monitoring, automated adjustment and early fault detection. During 2025, DOE’s marine-energy testing programme added 16 facilities and approved 39 projects receiving more than USD 6.3 million in support. These testing resources help developers assess sensors, power controls, grid integration and device behaviour before full offshore deployment, reducing technical risk and improving coordination between multiple turbines.
By Technology Analysis
Wet Tidal Energy Held a Major Share of the Tidal Energy Market.
Grid power generation held the dominant position, accounting for 82.3% of the tidal energy market. Grid-connected projects remain the industry’s main commercial route because predictable tidal cycles can strengthen electricity planning and complement variable wind and solar generation. In March 2026, the U.S. Department of Energy reported that domestic marine-energy resources were equivalent to approximately 57% of current national power generation. The department also negotiated 51 new water-power research awards and received USD 220 million for hydropower and marine-energy research, supporting grid integration, testing and commercial deployment.
Desalination is the fastest-growing application as coastal regions seek reliable electricity and alternative freshwater supplies. In January 2025, the U.S. Bureau of Reclamation awarded USD 223 million to 18 recycling and desalination projects across 8 states. The supported projects are expected to deliver 305,936 acre-feet of water annually, indicating strong public investment in energy-efficient water treatment and creating future opportunities for tidal-powered desalination systems
Key Market Segments
By Technology
- Tidal stream / turbines
- Tidal barrage
- Dynamic tidal power
- Tidal kite / others
By Deployment
- Offshore / nearshore
- Onshore
- Deep‑water
By Component
- Turbines
- Generators
- Control systems
- Support structures
By Application
- Grid power generation
- Off‑grid power
- Desalination
- Environmental / research
Driver Analysis
Sovereign Price Guarantees De-Risking Offtake Economics
The single largest near-term catalyst for the tidal stream segment is the reappearance and expansion of ring-fenced revenue support mechanisms, most visibly the UK’s Contracts for Difference (CfD) framework. Allocation Round 7 concluded in February 2026 with four dedicated tidal stream projects securing contracts totaling roughly 20.9 MW, pushing cumulative CfD-backed tidal capacity in the UK past the 75 MW mark when combined with prior AR4-AR6 tranches.
Strike prices in these rounds have historically cleared near £178-190 per MWh, a level roughly three to four times the clearing price of mature offshore wind, which signals that policymakers are willing to underwrite a premium to keep the technology commercially alive during its cost-descent phase.
This guaranteed-price mechanism converts an asset class that was previously reliant on grant capital into one with a bankable 15-year revenue floor, materially lowering the cost of project debt and enabling developers to move from single-turbine demonstrators toward multi-unit array financing.
Drivers Impact Analysis
| Driver | (~) % Impact on CAGR | Geographic Relevance | Impact Timeline |
|---|---|---|---|
| Sovereign CfD-style price guarantees de-risking offtake economics | +3.2% | UK core, EU spill-over, emerging South Korea/Canada corridors | Short term (≤ 2 years) |
| Grid-scale array consolidation from demonstration to commercial-class MW clusters | +2.6% | North Atlantic (Scotland, Bay of Fundy), APAC (South Korea, China) | Medium term (2-4 years) |
| Levelized cost compression via turbine standardization and O&M digitization | +2.1% | Global, concentrated in EU and North America manufacturing bases | Medium term (2-4 years) |
| Blended public-private capital stacks and innovation funding rounds | +1.7% | EU, Canada federal-provincial programs, UK innovation pots | Short term (≤ 2 years) |
| Marine spatial planning and adaptive environmental permitting reform | +1.4% | North America core, EU coastal states, APAC pilot zones | Long term (≥4 years) |
| Energy security diversification amid offshore wind cost inflation | +1.1% | Global, with EU and East Asia as primary adopters | Long term (≥4 years) |
Restraint Analysis
High Upfront CapEx and Unproven Cost-Per-MW Economics
Tidal stream projects continue to carry a capital intensity per installed megawatt that analysts estimate runs three to five times higher than a comparably sited offshore wind turbine, rooted in bespoke foundation engineering, low-volume turbine production runs, and the absence of a standardized balance-of-plant supply chain; this cost base is compounded by annual operations and maintenance expenditure benchmarked near USD 1.5 million to 2.5 million per 10 MW of capacity, a figure that erodes project-level IRR well below the 8-10% threshold typically required to clear institutional infrastructure-fund hurdle rates.
Strike prices cleared in the UK’s most recent Contracts for Difference rounds have settled in the £178-190 per MWh band, roughly three to four times the clearing price secured by mature offshore wind in the same auction pot, illustrating that developers still require a substantial subsidy premium simply to reach financial close.
Because CapEx burn is front-loaded into turbine fabrication, marine survey, and foundation installation phases before any revenue is recognized, sponsors are exposed to 24-36 month cash-negative construction windows with limited refinancing flexibility, which delays follow-on array expansion decisions and keeps deployment volumes structurally below what falling strike prices alone would suggest; this single factor is judged to be the most significant drag on near-term CAGR because it directly gates how many projects can reach positive final investment decision in any given funding cycle.
Restraint Impact Analysis
| Restraint | (~) % Impact on CAGR | Geographic Relevance | Impact Timeline |
|---|---|---|---|
| High upfront CapEx and unproven cost-per-MW economics | -3.4% | Global core, acute in UK, Canada, South Korea | Short term (≤2 years) |
| Subsea cable and specialist vessel supply bottleneck | -2.5% | EU core, North Atlantic corridors, APAC spill-over | Medium term (2-4 years) |
| Blade/drivetrain failure risk from biofouling and cavitation | -2.0% | North Atlantic (UK, Canada), APAC pilot sites | Medium term (2-4 years) |
| Fragmented, slow-moving marine consenting regimes | -1.6% | EU, South Asia (India), select APAC jurisdictions | Long term (≥4 years) |
| Grid interconnection and curtailment constraints in remote coastal zones | -1.3% | UK Highlands/Islands, Bay of Fundy, APAC island grids | Medium term (2-4 years) |
| Crowding-out by cheaper offshore wind and battery storage CapEx | -1.1% | Global, most acute in EU and North America | Long term (≥4 years) |
Opportunity Analysis
Tidal-to-Hydrogen Co-Location as a New Monetization Layer
Unlike the existing driver of grid-connected CfD offtake, which monetizes tidal output purely as exported electrons, the emerging opportunity lies in pairing turbines directly with electrolyzer stacks to create a second, storable revenue stream that is not capped by grid interconnection capacity, a model validated by Orkney’s world-first tidal-to-hydrogen integration completed in December 2025, which combined tidal generation with battery buffering and on-site electrolysis.
This is a genuine white space rather than a baseline driver because global low-emissions hydrogen investment only expanded past roughly 200 committed projects in 2025, and marine renewable-to-hydrogen pathways remain a near-empty sub-segment of that pipeline, meaning first movers can capture green hydrogen premiums of an estimated USD 1.50-2.50 per kg above grey hydrogen benchmarks without competing for scarce grid queue slots.
For a 10 MW tidal array, redirecting even 30-40% of otherwise curtailed or grid-constrained output into electrolysis could plausibly add 15-20% incremental revenue against a pure-export baseline, effectively monetizing capacity that would otherwise sit idle during low-demand tidal peaks. Because this requires new CapEx for electrolyzer integration and hydrogen offtake logistics rather than simply operating existing turbine fleets, it represents a distinct strategic pivot, not an extension of current baseline economics, and the execution window is medium-term given electrolyzer cost curves and hydrogen offtake infrastructure are still maturing in parallel.
Opportunity Impact Analysis
| Opportunity | (~) % Potential CAGR | Geographic Relevance | Execution Window |
|---|---|---|---|
| Tidal-to-hydrogen co-location as a new monetization layer | +2.8% | UK (Orkney), EU coastal hubs, APAC pilot corridors | Medium term (2-4 years) |
| Diesel-displacement microgrid roll-up in remote island/coastal communities | +2.3% | Canada (Atlantic/Arctic), Pacific Islands, Indonesia/Philippines archipelagos | Short term (≤2 years) |
| Offshore aquaculture and desalination co-powering vertical | +1.9% | EU (Iberia/Nordics), APAC coastal aquaculture belts, Middle East desalination corridors | Long term (≥4 years) |
| Turbine-as-a-Service and O&M subscription monetization model | +1.6% | Global core, first-mover in UK/Canada fleets | Short term (≤2 years) |
| M&A roll-up and IP consolidation among sub-scale turbine OEMs | +1.4% | EU, North America core; APAC entry via licensing | Medium term (2-4 years) |
| Ancillary grid-services monetization (frequency response, capacity firming) | +1.2% | UK, EU, APAC island grids with high renewable penetration | Long term (≥4 years) |
Challenges Analysis
Marine Engineering Talent Deficit
The structural vulnerability here is a labor market where marine renewable energy competes for the same narrow pool of subsea, electrical, and controls engineers sought by offshore wind, oil and gas decommissioning, and defense sectors, with UK sector census data showing 81% of renewable businesses currently unable to fill critical technical roles and an estimated 200,000 additional green-economy workers needed by 2030 just to meet broader clean-energy demand.
For tidal specifically, the talent gap is sharper because it demands a narrower cross-disciplinary skillset spanning subsea cable jointing, ROV operation, and marine biology-informed environmental compliance, a combination for which formal degree pipelines remain scarce, meaning developers frequently pay a 15-25% wage premium over comparable onshore renewable roles just to retain qualified marine technicians and project engineers.
Sustained resolution requires multi-year investment in dedicated marine-energy apprenticeship pipelines and cross-training programs pulling talent from adjacent oil and gas and offshore wind workforces, a structural fix that will take a long-term horizon given university and vocational curriculum development cycles typically run 3-5 years before producing employable graduates.
Challenges Impact Analysis
| Challenge | (~) % CAGR Friction | Geographic Relevance | Mitigation Horizon |
|---|---|---|---|
| Marine engineering talent deficit | -1.8% | UK core, EU, Canada Atlantic corridor | Long term (≥4 years) |
| Lack of harmonized certification standards | -1.5% | Global, most acute EU/UK cross-border projects | Medium term (2-4 years) |
| Rare earth magnet and generator supply exposure | -1.3% | Global, sourcing risk concentrated via China | Medium term (2-4 years) |
| Component over-engineering and design non-convergence | -1.1% | Global OEM base, UK/EU/APAC manufacturers | Long term (≥4 years) |
| Fragmented O&M vessel and technician logistics | -0.9% | North Atlantic remote sites, APAC island grids | Medium term (2-4 years) |
| Currency, tariff, and cross-border component cost volatility | -0.7% | EU-UK trade corridor, APAC-Western supply links | Short term (≤2 years) |
Geopolitical Impact Analysis
Critical-Mineral Rivalry Reshaping Tidal Energy Supply Chains.
Tidal energy is becoming more exposed to geopolitical competition because turbines, generators, subsea cables and control equipment rely on specialised metals and magnetic materials. In February 2026, the U.S. Geological Survey reported that China remained a major source for 14 of the 33 critical minerals on which the United States was most import-dependent. U.S. mineral production reached USD 112 billion, rising 5.6%, while mineral-reliant industries represented USD 4.09 trillion. This concentration may increase procurement risk, extend lead times and push tidal developers toward local suppliers.
Governments are responding through reshoring and supply diversification. The European Union targets 10% domestic extraction, 40% processing and 25% recycling of strategic raw materials, while limiting reliance on any single external country to 65% by 2030. In June 2026, the U.S. Department of Energy announced USD 134 million for two rare-earth recovery projects and USD 72 million for domestic critical-mineral and high-performance magnet research. These measures can strengthen generator, electronics and maintenance supply chains for future tidal arrays.
Regional Analysis
Asia Pacific Held the Largest Share of the Global Tidal Energy Market.
Europe held the leading position, accounting for 42.2% of the tidal energy market. Its dominance reflects long-standing barrage infrastructure, mature marine engineering and established support for demonstration projects. The European Commission reported 214 MW of EU ocean-energy capacity, including 212 MW from France’s La Rance tidal barrage. Emerging operational technologies contributed another 2.2 MW, of which tidal-stream systems represented 1.5 MW. This operating base continues to support turbine manufacturing, grid integration and specialised offshore services.
Asia Pacific is the fastest-growing region as governments reduce the cost and regulatory burden of testing tidal technologies in real offshore conditions. From 14 November 2025, the Australian Government reduced research and demonstration licence application fees to AUD 20,000 for two years. It also waived annual levies for licences issued on or before 30 June 2027. As tidal systems are explicitly eligible, this policy can encourage more sea trials, lower early-stage development costs and help emerging technologies progress toward larger commercial projects.
Key Regions and Countries Covered
- North America
- The US
- Canada
- Europe
- Germany
- France
- The UK
- Spain
- Italy
- Russia & CIS
- Rest of Europe
- APAC
- China
- Japan
- South Korea
- India
- ASEAN
- Rest of APAC
- Latin America
- Brazil
- Mexico
- Rest of Latin America
- Middle East & Africa
- GCC
- South Africa
- Rest of MEA
Key Players Analysis
Tidal Energy companies focus on improving turbine reliability, project scalability, and marine supply chain coordination to maintain competitiveness. A key priority is continuous engineering innovation, including the development of larger rotors, corrosion-resistant materials, advanced blade profiles, and efficient power take-off systems that improve output, durability, and operating stability in harsh ocean conditions. Developers also invest in modular array designs, as they support phased installation, easier maintenance, and lower construction risk compared with large civil structures.
Closer integration with vessel operators, subsea cable suppliers, port authorities, and grid companies helps reduce installation delays and improve lifecycle cost control. Strategic deployment near high-velocity coastal channels enables better use of predictable tidal resources while supporting local manufacturing and marine-service activity. Additionally, companies emphasize digital monitoring, remote diagnostics, environmental assessment, and standardized components to improve performance across multiple sites, while securing long-term power contracts and government-backed demonstration support to strengthen project bankability and reinforce their position in emerging renewable energy markets.
The Major Players In The Industry
- Andritz AG
- Nova Innovation Ltd
- Orbital Marine Power Ltd
- SIMEC Atlantis Energy Ltd
- MAKO Turbines Pty Ltd
- Sustainable Marine Energy Ltd
- Minesto AB
- Verdant Power Inc
- Voith Hydro GmbH & Co. KG
- Sabella SA
- Ocean Renewable Power Company LLC (ORPC)
- Aquamarine Power Ltd
- Carnegie Wave Energy
- CorPower Ocean AB
- Eco Wave Power
- Others
Key Development
- In November 2025, Orbital Marine Power Ltd and Eauclaire Tidal secured 12.5 MW in Nova Scotia through two 15-year power-purchase contracts. The award supports six O2-X turbines at the FORCE site, expanding Orbital’s pipeline.
- In June 2025, Minesto AB reported that its Dragon 12 tidal kite achieved a 25% power-performance increase after receiving a 10-metre-longer tether. The result strengthened validation of the company’s commercial-scale deployment assumptions in the Faroe Islands.
Report Scope
| Report Features | Description |
|---|---|
| Market Value (2025) | USD 964.5 Bn |
| Forecast Revenue (2035) | USD 7,332.0 Bn |
| CAGR (2026-2035) | 22.6% |
| Base Year for Estimation | 2025 |
| Historic Period | 2020-2024 |
| Forecast Period | 2026-2035 |
| Report Coverage | Revenue Forecast, Market Dynamics, Competitive Landscape, Recent Developments |
| Segments Covered | By Technology (Tidal stream / turbines, Tidal barrage, Dynamic tidal power and Tidal kite / others), By Deployment (Offshore / nearshore, Onshore and Deep‑water), By Component (Turbines, Generators, Control systems and Support structures), By Application (Grid power generation, Off‑grid power, Desalination and Environmental / research), By Technology (Dry Tidal Energy and Wet Tidal Energy), By End Use (Automotive, Consumer electronics, Industrial, and Others) |
| Regional Analysis | North America – The US & Canada; Europe – Germany, France, The UK, Spain, Italy, Russia & CIS, Rest of Europe; APAC– China, Japan, South Korea, India, ASEAN & Rest of APAC; Latin America– Brazil, Mexico & Rest of Latin America; Middle East & Africa– GCC, South Africa, & Rest of MEA |
| Competitive Landscape | Andritz AG, Nova Innovation Ltd, Orbital Marine Power Ltd, SIMEC Atlantis Energy Ltd , MAKO Turbines Pty Ltd, Sustainable Marine Energy Ltd, Minesto AB, Verdant Power Inc, Voith Hydro GmbH & Co. KG, Sabella SA, Ocean Renewable Power Company LLC (ORPC), Aquamarine Power Ltd, Carnegie Wave Energy, CorPower Ocean AB, Eco Wave Power, Others. |
| Customization Scope | Customization for segments, region/country-level will be provided. Moreover, additional customization can be done based on the requirements. |
| Purchase Options | We have three licenses to opt for: Single User License, Multi-User License (Up to 5 Users), Corporate Use License (Unlimited Users and Printable PDF) |





































