


Report Overview
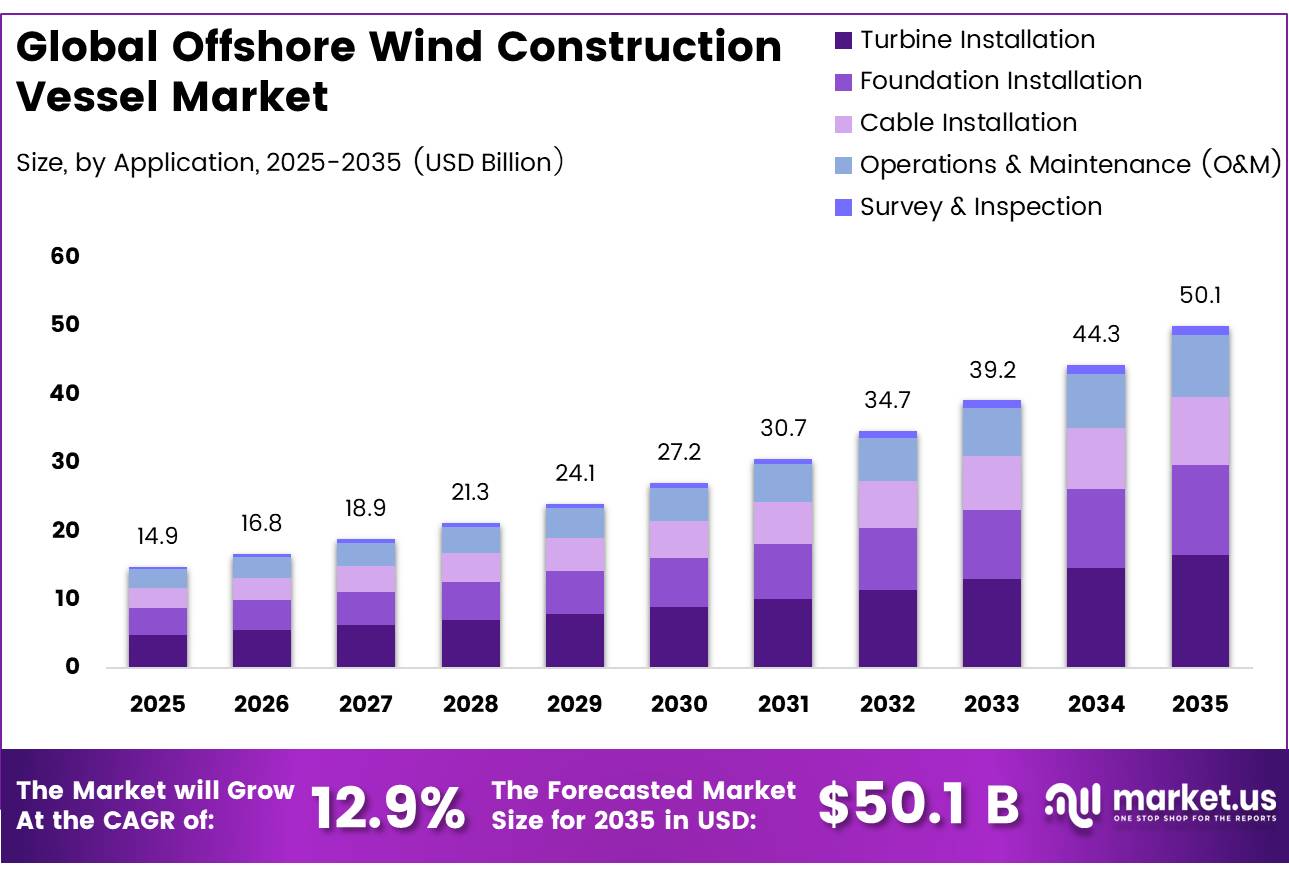
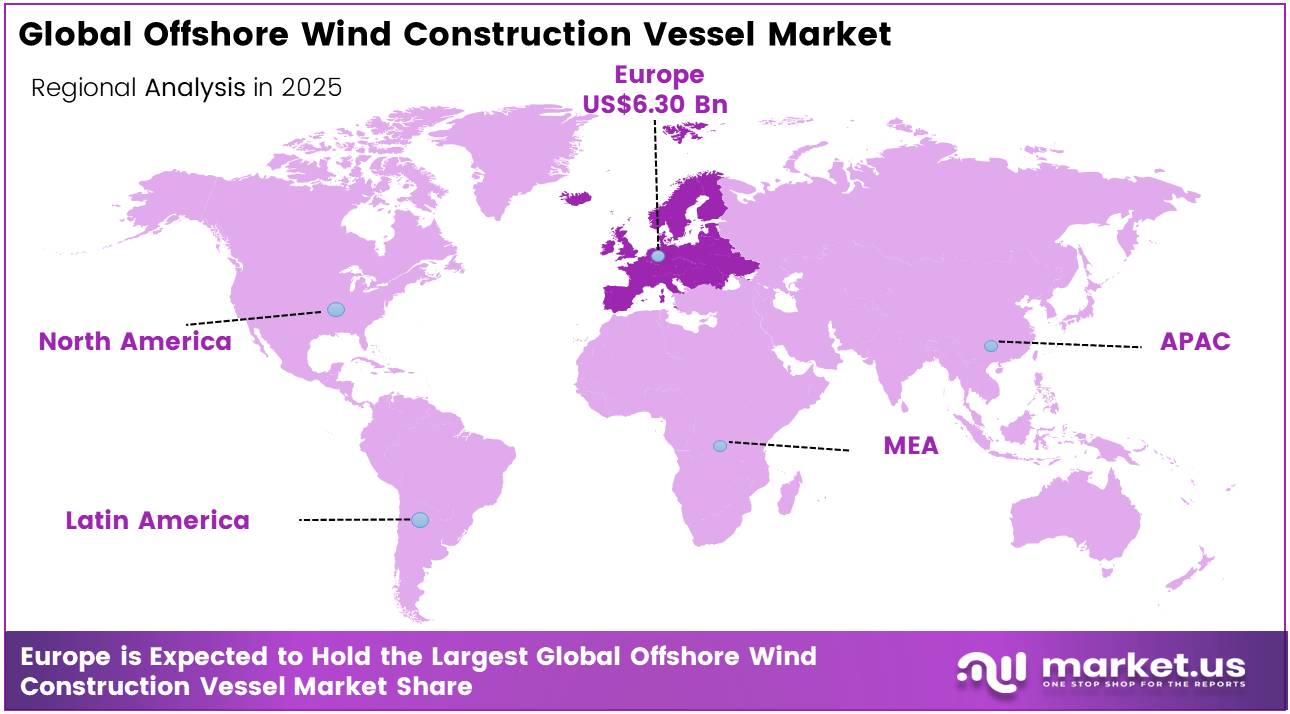
In 2025, the Global Offshore Wind Construction Vessel Market was valued at USD 14.9 billion. The market is projected to grow at a CAGR of 12.9% during 2026 to 2035, reaching approximately USD 50.1 billion by 2035. In 2025, Europe dominated the global market, accounting for more than 42.3% of the total share and generating approximately USD 6.3 billion in revenue.
The offshore wind vessel market is primarily driven by the rapid, global expansion of offshore wind energy projects, as every gigawatt of new capacity translates directly into long-term demand for specialized fleet services, including wind turbine installation vessels (WTIVs), cable-laying vessels, and service operation vessels (SOVs).
- According to the International Renewable Energy Agency (IRENA), global offshore wind capacity surged from just 3.1 GW in 2010 to 82.9 GW in 2024. Under IRENA’s Net Zero Scenario, this capacity is expected to scale to at least 2,000 GW by 2050.
- Government policies aggressively support this pipeline; for example, the European Commission targets 300 GW by 2050, while nine North Sea countries agreed in 2026 to jointly develop up to 100 GW of cross-border offshore wind capacity. In 2024 alone, the world added 8 GW of new offshore wind, supported heavily by China (6.9 GW) and a 23% year-over-year increase in commissioning across IEA member countries.
Europe remains the leading regional market for offshore construction vessels, sustained by continuous investments and binding government targets. The updated EU Offshore Renewable Energy Strategy aims to achieve up to 89 GW of offshore capacity by 2030 and 366 GW by 2050. With WindEurope reporting 39 GW of installed capacity in 2025, the region must expand its infrastructure more than eightfold to meet mid-century goals, ensuring steady vessel utilization. Other regions are also scaling their maritime supply chains to keep pace.
In the United States, the Government Accountability Office (GAO) reported that by August 2025, 50 offshore wind vessels had been delivered or were under order, with nearly 80% meeting Jones Act requirements. Meanwhile, China continues to strengthen market demand through an integrated domestic supply chain that supports both massive onshore growth and its expanding offshore footprint.
Key Takeaways
- The global Offshore Wind Construction Vessel market was valued at US$14.9 billion in 2025.
- The market is projected to grow at a CAGR of 12.9% and is estimated to reach US$50.1 billion by 2035.
- On the basis of Vessel type, Wind Turbine Installation Vessel (WTIV) dominated the Offshore Wind Construction Vessel market, constituting 28.1% of the total market share.
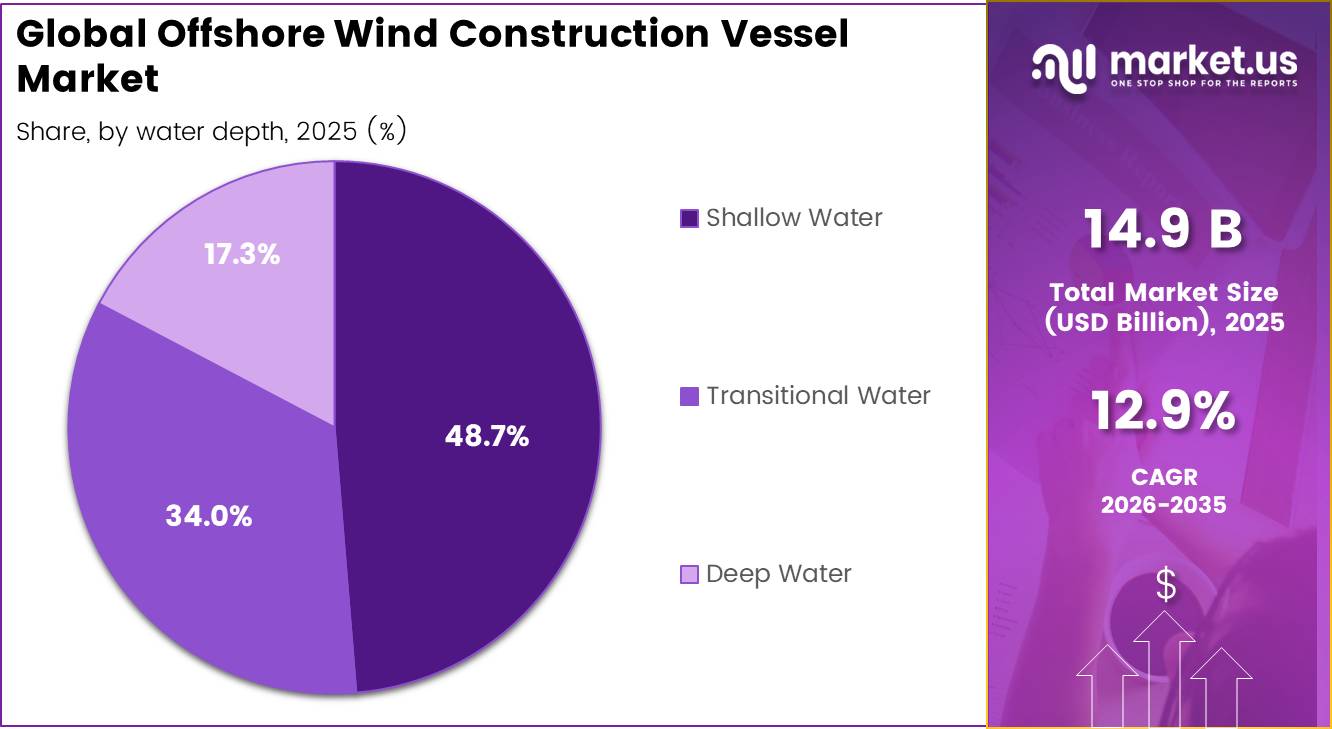
- Based on the Water Depth, the Shallow Water dominated the Offshore Wind Construction Vessel market, with a substantial market share of around 48.7%.
- Based on the material Application, Turbine Installation led the market, comprising 33.2% of the total market.
- In 2025, the Europe was the most dominant region in the Offshore Wind Construction Vessel market, accounting for 42.3% of the total global consumption.
Vessel Type Analysis
Wind Turbine Installation Vessel (WTIV) represents dominant Segment in the Offshore Wind Construction Vessel Market.
Wind Turbine Installation Vessels (WTIVs) accounted for the largest share of the offshore wind construction vessel market, capturing 28.1%. Their leadership is driven by their essential role in installing offshore wind turbines, as every project requires heavy-lift cranes and jack-up systems to transport and install turbine components safely at sea.
According to the Global Wind Energy Council (GWEC), global offshore wind capacity reached 92.5 GW by the end of 2025 and is expected to increase to 420 GW by 2035, requiring the installation of nearly 327 GW of new capacity over the next decade. More than 50 GW of offshore wind projects are currently under construction worldwide, while annual installations are projected to double in 2026, triple by 2031, and exceed 50 GW per year by 2035. This strong project pipeline is creating sustained demand for WTIVs.
Demand is also increasing as offshore wind turbines become larger and heavier. In January 2026, China installed the world’s first 20 MW offshore wind turbine off Fujian Province, requiring advanced installation vessels with higher lifting capacity than most existing WTIVs. To meet this need, DEME developed the Norse Wind WTIV, capable of transporting seven 15 MW turbine sets or five 20 MW+ turbine sets in a single voyage. In addition, WindEurope has highlighted a shortage of WTIVs across Europe during 2024-2025, with demand expected to exceed supply between 2028 and 2030, when 5 to 9 WTIVs will be required simultaneously in the Baltic Sea. These factors are expected to support the segment’s leading position throughout the forecast period.
Water Depth Analysis
Shallow Water a significant Water Depth.
The shallow water segment held a dominant 48.7% share of the offshore wind construction vessel market, supported by the concentration of offshore wind projects in waters below 60 meters. These locations offer lower installation costs and are well suited for fixed-bottom foundation technologies. According to the Danish Energy Agency, nearly 50% of the North Sea has water depths below 60 meters, making it one of the most suitable regions for large-scale offshore wind development. By the end of 2024, over 99% of the world’s 83.2 GW of installed offshore wind capacity was built using fixed-bottom foundations, including monopiles, jackets, and gravity-base structures, which are primarily designed for shallow and transitional waters.
China continues to strengthen this segment through extensive offshore development in the Yellow Sea, East China Sea, and Bohai Sea, where average water depths range between 10 and 35 meters. According to the China Wind Energy Association (CWEA) and the IEA Wind TCP 2024 Annual Report, China’s cumulative offshore wind capacity exceeded 40 GW by the end of 2024, with nearly all projects installed in shallow coastal waters using dedicated shallow-draft installation vessels. In addition, Rabobank projects that fixed-bottom foundations will remain the leading technology through at least 2030, as floating offshore wind continues to face higher levelized costs of electricity (EUR 85–100/MWh) than fixed-bottom systems. This is expected to maintain strong demand for shallow-water construction vessels over the coming years.
Deep water constitutes another fast-growing market segment in Offshore Wind Construction Vessel Market size. The government authorities around the world have been looking towards the deep waters as well for exploiting the offshore wind resources. The BOEM report indicates that the United States’ Outer Continental Shelf now consists of nearly 15 million acres of leased areas for offshore wind developments, thereby opening up numerous prospects for deep-water and floating wind farm projects.
Application Analysis
Turbine Installation Are the Most Widely Used.
The Turbine Installation segment accounted for 33.2% of the offshore wind construction vessel market, as every offshore wind project requires specialized vessels to transport, lift, and install turbines at sea. This makes turbine installation the most essential and vessel-intensive stage of offshore wind development. According to the GWEC Global Wind Report 2026, the global wind industry installed a record 165 GW of new capacity in 2025, up 40% from the previous record year. Offshore wind contributed 9.3 GW, representing a 16% year-on-year increase. This growth has significantly increased the demand for turbine installation vessels, as higher installation activity directly translates into more vessel operating days.
Demand is also rising because offshore wind turbines are becoming larger and heavier. The GWEC OEM Market Share Report 2025 states that the average offshore turbine capacity reached 10,312 kW (10.3 MW) in 2025, compared with about 7 MW five years earlier. The European Commission’s Joint Research Centre (JRC) also reports that commercial offshore turbines now commonly exceed 14 MW, while prototype models have reached 15–18 MW with rotor diameters above 220 meters.
These larger turbines require more powerful cranes, higher lifting capacity, and advanced jack-up installation vessels. In addition, the American Clean Power Association (ACP) estimates that each offshore wind project requires at least 10 dedicated construction and commissioning vessels, with turbine installation vessels recording the highest utilization. According to REN21 Global Status Report 2025, 56.3 GW of offshore wind capacity was auctioned globally in 2024, ensuring strong long-term demand for turbine installation vessels through the 2030s.
The Foundation Installation Application Segment is a growing segment in the Offshore Wind Construction Vessel Market. This can be attributed to the increasing number of offshore wind power projects across the globe and their increasing size. According to the European Commission, the combined offshore wind capacity of the EU stood at around 21.6 GW by the end of 2025.
Key Market Segments
By Vessel Type
- Wind Turbine Installation Vessel (WTIV)
- Service Operation Vessel (SOV)
- Crew Transfer Vessel (CTV)
- Cable Laying Vessel (CLV)
- Heavy Lift Vessel (HLV)
- Foundation Installation Vessel
- Survey & Support Vessel
- Others
By Depth Water
- Shallow Water
- Transitional Water
- Deep Water
By Application
- Turbine Installation
- Foundation Installation
- Cable Installation
- Operations & Maintenance (O&M)
- Survey & Inspection
Driver Analysis
Government Offshore Wind Capacity Mandates & Auction Pipelines
The EU, under the revised Renewable Energy Directive adopted in 2023, has aligned member-state commitments to a collective 86–89 GW of offshore capacity by 2030 against a 2023 baseline of just 19.38 GW installed, requiring an approximate 67–70 GW construction campaign within a sub-seven-year window. In the UK specifically, DESNZ’s Contracts for Difference Allocation Round 7 (AR7), concluded in early 2026, secured a record 8.4 GW of offshore wind across six fixed-bottom and two floating projects at strike prices of GBP 91.20/MWh and GBP 216.49/MWh, representing the single largest offshore wind procurement in European history and directly locking in vessel construction windows through to approximately 2031–2032.
The UK government estimates over £50 billion in construction capital expenditure will be required to build its offshore pipeline through 2030 and has deployed a £300 million Great British Energy Supply Chain Fund alongside a £1 billion broader supply chain support package to ease the bottlenecks.
China’s 15th Five-Year Plan, formalized through the October 2025 Beijing Declaration 2.0, mandates a minimum of 15 GW of new offshore wind capacity annually, representing more than double the pace of prior plan periods and requiring systematic annual mobilization of multiple FIV and WTIV vessel campaigns in Chinese coastal waters. India’s Ministry of New & Renewable Energy, having issued bids for 4 GW of offshore wind off Tamil Nadu in February 2024 divided into four 1 GW blocks, frames an emerging but structurally significant demand pipeline for installation, foundation, and SOV-class assets across the Bay of Bengal corridor.
Drivers Impact Analysis
| Driver | (~) % Impact on CAGR Forecast | Geographic Relevance | Impact Timeline |
|---|---|---|---|
| Government Offshore Wind Capacity Mandates & Auction Pipelines | +3.2% | EU core (UK, Germany, Netherlands, Denmark), APAC corridors (China, Taiwan, South Korea), South Asia spill-over (India) | Short–Medium term (2026–2030) |
| Turbine Upsizing to 15–20 MW Class Forcing Next-Gen WTIV Fleet Renewal | +2.8% | EU (North Sea, Baltic), APAC (Chinese coastal, Taiwan Strait), North America spill-over | Medium term (2027–2030) |
| Acute Structural Vessel Supply Deficit Driving Day-Rate Premium and Newbuild Capex | +2.5% | EU core (North Sea, Baltic Sea), APAC corridors, US East Coast spill-over | Short term (2026–2028) |
| Floating Offshore Wind Commercialization Unlocking Dedicated Vessel Sub-Segment | +1.8% | EU Atlantic (UK, Norway, Portugal, Spain), APAC deep-water corridors (Japan, South Korea), US West Coast | Medium–Long term (2028–2032) |
| IMO Net-Zero Framework 2027 Entry into Force Triggering Fleet Decarbonization Capex | +1.5% | Global (mandatory for vessels >5,000 GT), EU most immediate compliance exposure | Medium term (2027–2030) |
| APAC Ex-China Offshore Wind Acceleration Creating Dedicated Regional Vessel Demand | +1.4% | APAC corridors (South Korea, Taiwan, Japan primary), Vietnam/India emerging spill-over | Medium term (2027–2031) |
Restraint Analysis
Jones Act & cabotage vessel constraints
The Jones Act and wider cabotage rules are structurally constraining offshore wind construction vessel productivity in US waters by forcing a fragmented “feeder plus foreign installation” model that adds 10–20% to per-MW installation costs and extends typical project installation windows by 6–12 months. The Bureau of Ocean Energy Management (BOEM) reports roughly 45 GW of US offshore wind at various stages of development, but as of 2026 there is still no operational Jones Act-compliant wind turbine installation vessel (WTIV), meaning developers must charter foreign-flagged WTIVs and pair them with US-built, US-crewed feeder vessels for component shuttle operations between US ports and lease areas. This split operation increases voyage cycles, doubles harbor calls per tower set, and raises day rates effectively from around an implied USD 220,000–250,000 per day to closer to USD 280,000–320,000 when feeder logistics, standby, and demurrage are included.
At the same time, CBP rulings clarifying what constitutes a “US point” on the seabed restrict flexibility in rock-dumping and foundation works, compressing acceptable weather windows and cutting achievable annual installation throughput by an estimated 15–25% versus unconstrained European operations. In economic terms, these regulatory frictions drive margin compression for vessel operators by pushing up crewing, compliance, and insurance overheads by 8–12% per campaign, while also forcing developers to rephase CapEx, delay financial close, and reprice power purchase agreements (PPAs), effectively clipping US Atlantic and Gulf offshore wind construction vessel CAGR by roughly 2.2 percentage points relative to a regulatory-neutral base case through 2030.
Restraint Impact Analysis
| Restraint | (~) % Impact on CAGR Forecast | Geographic Relevance | Impact Timeline |
|---|---|---|---|
| Jones Act & cabotage vessel constraints | -2.2% | US Atlantic & Gulf | Medium term (2-4 years) |
| EU permitting & environmental compliance drag | -1.9% | EU North Sea & Baltic | Medium term (2-4 years) |
| Global shortage of WTIVs and heavy-lift tonnage | -2.7% | EU, UK, US, APAC | Short & medium term (≤ 4 years) |
| Subsea cable & key component supply bottlenecks | -1.6% | EU corridors, UK, APAC | Short term (≤ 2 years) |
| Cost inflation & offshore wind project cancellations | -2.0% | US, UK, EU | Short & medium term (≤ 4 years) |
| Port infrastructure and grid-connection constraints | -1.5% | EU core, UK, APAC | Long term (≥ 4 years) |
Opportunity Analysis
Jones Act compliant WTIV and fleet leasing platform
This opportunity centers on building and operating a dedicated portfolio of Jones Act–compliant wind turbine installation vessels (WTIVs) and heavy-lift support craft, monetized via long-horizon leasing contracts to developers pursuing the United States’ 30 GW offshore wind ambition by 2030 and additional leases issued thereafter, rather than simply meeting current project-level demand.
Government and quasi-government assessments show over 21 GW of potential capacity already under U.S. federal leases and a national target of 30 GW by 2030, yet the number of domestic-compliant installation vessels remains in the low single digits, forcing developers to rely on hybrid foreign U.S. feeder strategies constrained by cabotage rules, which is a structural bottleneck and thus not a fully monetized market segment today.
A specialized platform deploying 3–5 newbuild WTIVs over 2026–2032, each capable of installing 1.5–2.0 GW per year of 15–20 MW turbines, could unlock an incremental addressable revenue pool of roughly USD 700–900 million per vessel over a 10-year period through day-rate and capacity-reservation models, with operating margins elevated by 8–10 percentage points compared with general-purpose offshore construction fleets due to scarcity pricing and higher utilization (65–75% vs ~50–55% typical heavy-lift fleet utilization).
Opportunity Impact Analysis
| Opportunity | (~) % Potential CAGR Upside | Geographic Relevance | Execution Window |
|---|---|---|---|
| Jones Act compliant WTIV and fleet leasing platform | +2.2% | US East Coast, US Gulf | Short term (≤ 2 years) |
| Standardized multi-purpose vessels for 20–30 MW turbines and floating projects | +1.8% | EU North Sea, UK, APAC core | Medium term (2-4 years) |
| APAC-localized balance-of-systems and construction vessel clusters | +1.5% | China, Japan, Korea, India, ASEAN | Medium term (2-4 years) |
| Green-financed retrofit and life-extension of legacy offshore fleets | +1.2% | EU, UK, Middle East, China | Short–Medium (≤ 4 years) |
| Integrated port–vessel–O&M infrastructure hubs for 380 GW+ pipeline | +1.6% | EU, US, China, India | Long term (≥ 4 years) |
| Cross-basin vessel pooling and digital utilization marketplaces | +1.0% | Global multi-basin operators | Medium–Long (≥ 3 years) |
Challenges Analysis
Specialized vessel shortfall
The offshore wind construction vessel market faces a structural shortfall of highly specialized installation and heavy-lift units, with U.S. federal analyses indicating that achieving 44–52 GW of offshore wind by 2035 will require dozens of additional Jones Act–compliant WTIVs, cable layers, and feeder barges beyond today’s limited fleet, where several vessel classes are already flagged as “high or moderate risk” to meeting national targets due to multi‑year build times and capital costs often exceeding USD 300–500 million per unit.
NREL and DOE pipeline data for roughly 80 GW of U.S. offshore wind capacity and EU targets around 60–107 GW by 2030 imply annual installations of 10–12 GW in Europe and 3–5 GW in the U.S., yet current installation vessel capacity typically supports closer to 6–8 GW per year globally for large‑scale projects, creating a 25–35% capacity gap that translates into project phasing delays of 12–18 months and lowers achievable market CAGR by an estimated 1.6 percentage points as vessel day rates climb 20–40% during peak seasons.
Construction times of 30–36 months for next‑generation WTIVs and 18–24 months for large cable layers, coupled with limited shipyard slots in Europe and Asia, constrain rapid fleet expansion and force developers to optimize work windows at high utilization factors near 85–90%, amplifying schedule risk from weather and permitting slippage and increasing vessel idle penalties that can add USD 3–5 million per month of delay on multi‑GW campaigns.
Strategically, this friction pushes corporate players to pursue long‑term chartering structures of 8–12 years, joint ownership models between utilities and marine contractors, and portfolio‑level sequencing across markets to smooth utilization, but because vessel design evolution must accommodate larger turbines (15–20 MW) and deeper sites beyond 50–60 meters, the industry realistically needs at least one full investment and design cycle 4 to 6 years to normalize capacity, justifying the long‑term mitigation horizon and the estimated 1.6% drag on potential CAGR rather than a hard stop in current sales.
Challenges Impact Analysis
| Challenge | (~) % CAGR Friction Drag | Geographic Relevance | Mitigation Horizon |
|---|---|---|---|
| Specialized vessel shortfall | -1.6% | North America, EU core | Long term (≥ 4 years) |
| Port & yard capacity strain | -1.3% | EU core, UK, APAC hubs | Long term (≥ 4 years) |
| Talent & crew skill gap | -1.2% | Global corridors | Medium term (2-4 years) |
| Complex regulatory compliance load | -0.9% | EU regulatory hubs, US East Coast, Asia EEZs | Medium term (2-4 years) |
| Supply chain lead-time volatility | -1.1% | Global OEM networks | Medium term (2-4 years) |
| Capital cost & localization requirements | -0.8% | US, EU, India emerging | Long term (≥ 4 years) |
Geopolitical Impact Analysis
Geopolitical tensions are increasing costs and disrupting supply chains across the offshore wind construction vessel market. Vessel manufacturing depends heavily on steel and aluminum for hulls, jack-up legs, cranes, and installation equipment. Under the U.S. Presidential Proclamation effective June 4, 2025, Section 232 tariffs on imported steel and aluminum increased to 50% from 25% in March 2025, while Russian aluminum became subject to a 200% duty. These tariffs also cover derivative steel products used in vessel construction, increasing offshore wind project costs by an estimated 5–10% in the U.S. market.
In addition, the U.S. “Restoring America’s Maritime Dominance” executive order introduced new port charges on Chinese-operated vessels of USD 50 per net ton, rising to USD 140 per net ton by 2028. Chinese-built vessels also face separate fees of USD 18 per net ton, increasing to USD 250 per net ton by 2028. As many offshore wind installation vessels are built in Chinese shipyards, these measures are increasing procurement costs and creating sourcing challenges for U.S. offshore projects.
Global shipping disruptions are adding further pressure to vessel manufacturing costs. Due to the Red Sea crisis, more than 90% of Asia-Europe shipping traffic has been rerouted around the Cape of Good Hope, increasing voyage distances by around 8,500 nautical miles and adding up to 10 days per trip.
According to the OECD/ITF, this diversion has increased roundtrip shipping costs by up to USD 1.7 million for a typical cargo vessel, raising the cost of transporting steel plates and marine components. UNCTAD projects global seaborne trade growth of only 0.5% in 2025, reflecting continued disruptions from geopolitical tensions and changing trade policies. As a result, offshore wind vessel builders are investing more in regional shipbuilding, diversifying suppliers, and securing long-term procurement contracts, while higher material, logistics, and vessel operating costs continue to shape the market outlook through 2035.
Regional Analysis
Europe Held the Largest Share of the Global Offshore Wind Construction Vessel Market.
Europe controls 42.3% of the market for Offshore Wind Construction Vessel because of the maturity of its offshore wind sector, presence of robust marine infrastructure and constant project development efforts. Europe continues to dominate as the center of offshore wind installation, requiring ongoing demand for offshore wind turbine installation, foundation installation, cables laying and other support vessels. As per Blue Economy Observatory by the European Commission (May 2026), offshore wind capacity of European Union had reached around 21.6 GW by the end of 2025.
Latin America emerges as one of the fastest-growing regions because of increasing offshore wind investments in the region and implementation of policies governing offshore wind projects. In early January 2025, Brazil passed its first offshore wind policy, approving the installation of offshore wind projects in territorial waters. Such a policy is likely to drive the growth of surveying, sea bottom examination, installations and demand for offshore construction vessels in the coming years.
Key Regions and Countries Covered
- North America
- The US
- Canada
- Europe
- Germany
- France
- The UK
- Spain
- Italy
- Russia & CIS
- Rest of Europe
- APAC
- China
- Japan
- South Korea
- India
- ASEAN
- Rest of APAC
- Latin America
- Brazil
- Mexico
- Rest of Latin America
- Middle East & Africa
- GCC
- South Africa
- Rest of MEA
Key Players Analysis
Offshore Wind Construction Vessels Providers strive to bolster technology competence, fleet productivity, and integration of services in order to stay competitive amidst the constantly changing landscape of offshore wind energy generation. Firstly, one of the main directions includes the upgrading of offshore wind construction fleet and the building of the next-generation vessels able to deal with the growing sizes of turbines, weights of offshore constructions, and complexity of operations at sea. The use of advanced lifting equipment, dynamic positioning systems, hybrid engines, and sophisticated monitoring software is being encouraged to increase the efficiency and reliability of wind farm installations.
Another important factor for the success of wind energy generation includes the development of vessels that are capable of operating in deep waters or at long distances from shores due to increased endurance and flexibility of operations. Cooperation with offshore wind farm developers, engineering companies, energy organizations, and ports also plays an important role in ensuring future projects and increasing vessel productivity. Finally, expansion of companies’ capacities in offshore wind construction hubs can provide greater opportunities in terms of operations.
The Major Players In The Industry
- Lamprell Energy Ltd
- Xiamen Shipbuilding Industry Co. Ltd
- Pella Sietas GmbH
- Japan Marine United Corporation
- Shanghai Zhenhua Heavy Industries (ZPMC)
- Nantong Rainbow Offshore & Engineering
- COSCO Shipping Heavy Transport
- Olsen Windcarrier
- DEME Group
- Seafox Group
- Van Oord
- Jan De Nul Group
- Subsea 7
- Boskalis
- Keppel Offshore & Marine
- Other Key Players
Key Development
- In January 2025, Van Oord launched the newly constructed offshore installation vessel Boreas, which will help transport and install offshore wind turbines and turbine foundations. It comes equipped with a lift capacity of more than 3,000 tonnes and can help install wind turbines having a maximum power rating of 20 MW.
- In September 2025, DEME Group decided to build an additional Offshore Construction Vessel (OCV). The vessel would be built using hybrid battery propulsion technology, along with methanol readiness capability, enabling DEME to increase its subsea cable installation capacity for offshore wind projects.
Report Scope
| Report Features | Description |
|---|---|
| Market Value (2025) | USD 14.9 Bn |
| Forecast Revenue (2035) | USD 50.1 Bn |
| CAGR (2026-2035) | 12.9% |
| Base Year for Estimation | 2025 |
| Historic Period | 2020-2024 |
| Forecast Period | 2026-2035 |
| Report Coverage | Revenue Forecast, Market Dynamics, Competitive Landscape, Recent Developments |
| Segments Covered | By Vessel Type (Wind Turbine Installation Vessel (WTIV), Service Operation Vessel (SOV), Crew Transfer Vessel (CTV), Cable Laying Vessel (CLV), Heavy Lift Vessel (HLV), Foundation Installation Vessel, Survey & Support Vessel and Others), By Water Depth (Shallow Water, Transitional Water and Deep Water), By Application (Turbine Installation, Foundation Installation, Cable Installation, Operations & Maintenance (O&M), and Survey & Inspection) |
| Regional Analysis | North America – The US & Canada; Europe – Germany, France, The UK, Spain, Italy, Russia & CIS, Rest of Europe; APAC– China, Japan, South Korea, India, ASEAN & Rest of APAC; Latin America– Brazil, Mexico & Rest of Latin America; Middle East & Africa– GCC, South Africa, & Rest of MEA |
| Competitive Landscape | Lamprell Energy Ltd, Xiamen Shipbuilding Industry Co. Ltd, Pella Sietas GmbH, Japan Marine United Corporation, Shanghai Zhenhua Heavy Industries (ZPMC), Nantong Rainbow Offshore & Engineering, COSCO Shipping Heavy Transport, Fred. Olsen Windcarrier, DEME Group, Seafox Group, Van Oord, Jan De Nul Group, Subsea 7, Boskalis, Keppel Offshore & Marine, Other Key Players |
| Customization Scope | Customization for segments, region/country-level will be provided. Moreover, additional customization can be done based on the requirements. |
| Purchase Options | We have three licenses to opt for: Single User License, Multi-User License (Up to 5 Users), Corporate Use License (Unlimited Users and Printable PDF) |





































