


Report Overview
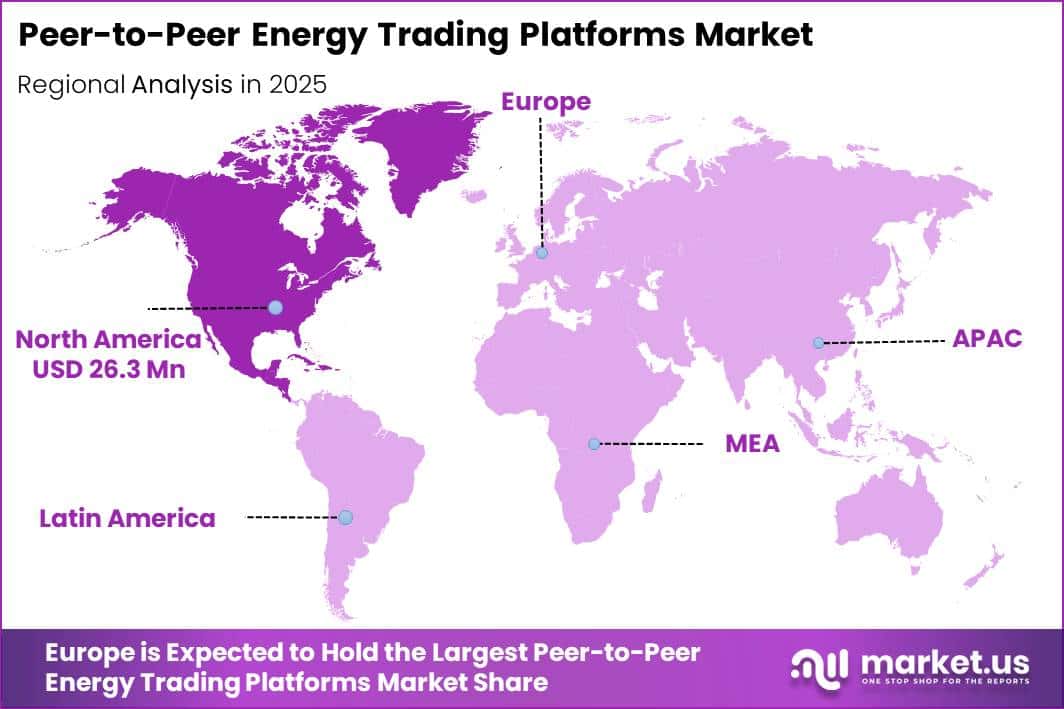
In 2025, the Global Peer-to-Peer Energy Trading Platforms Market was valued at USD 73.8 million. The market is projected to grow at a CAGR of 28.6% during 2026–2035, reaching approximately USD 911.4 million by 2035. North America dominated the global market in 2025, accounting for more than 35.7% of the total market share and generating approximately USD 26.3 million in revenue.
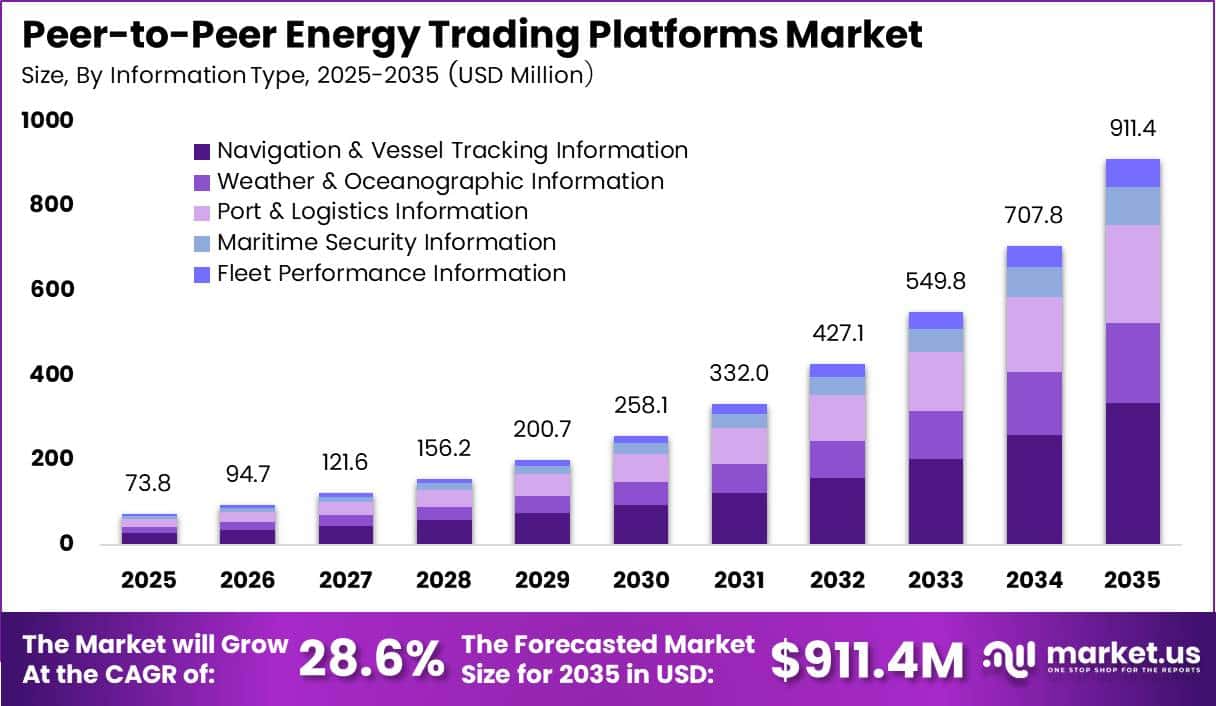
This strong growth is supported by rising investments in distributed renewable energy, smart grids, and local energy management systems. According to the International Energy Agency, global renewable capacity is expected to expand by more than 5,520 GW between 2024 and 2030. Solar PV and wind are forecast to contribute around 95% of these additions, while distributed solar is expected to account for nearly 40% of total PV expansion.
Global solar PV capacity had already crossed 2.2 TW by 2024, with approximately 554–600 GW of new capacity installed during the year. This rapid increase in rooftop and small-scale renewable systems is creating millions of prosumers who need digital platforms to sell surplus electricity, manage transactions, and settle payments in real time.
North American region benefits from advanced grid infrastructure, widespread smart meter deployment, supportive energy policies, and growing adoption of rooftop solar and battery storage. The United States installed around 47 GW of solar PV in 2024, representing an increase of nearly 40% compared with 2023. The growing use of bidirectional inverters, behind-the-meter batteries, and blockchain-based settlement systems is also improving transaction efficiency, platform transparency, and revenue opportunities.
Key Takeaway
- The Peer-to-Peer Energy Trading Platforms Market was valued at USD 73.8 million in 2025 and is projected to reach USD 911.4 million by 2035 at a CAGR of 28.6%.
- Navigation & Vessel Tracking Information dominated the information-type segment with a 36.8% share.
- Software Platforms led the component segment with a 43.5% share due to their role in transaction matching, pricing, and energy settlement.
- Cloud-Based deployment accounted for 58.9% of the market, supported by scalability and efficient management of large energy datasets.
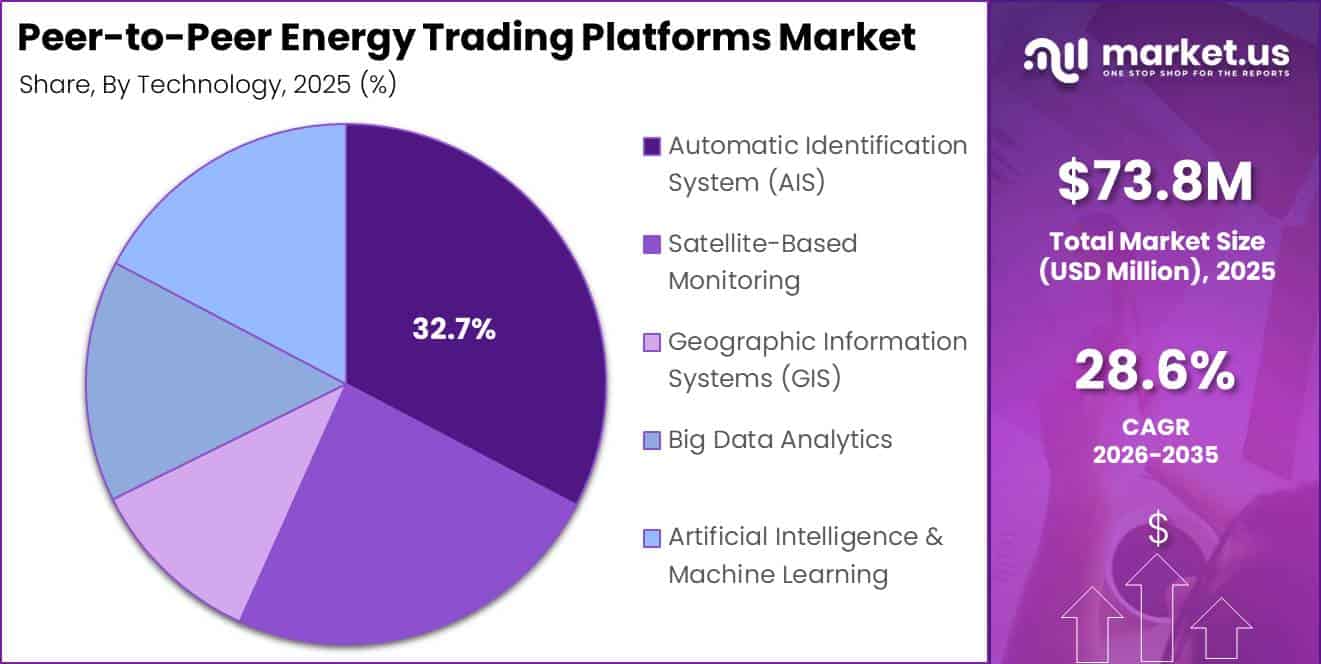
- Automatic Identification System technology held a leading 32.7% share due to its widespread use in maritime monitoring.
- Fleet Management & Operations dominated the application segment with a 29.6% share.
- Commercial Shipping Companies led the end-user segment with a 41.8% share.
- Vessel-Based Data accounted for 38.4% of the data-source segment due to its real-time operational visibility.
- Maritime Monitoring & Tracking Solutions dominated the solution-type segment with a 34.2% share.
- North America led the global market in 2025 with more than 35.7% share, generating approximately USD 26.3 million in revenue.
By Information Type
Navigation & Vessel Tracking Information held a dominant 36.8% share of the information-type segment, supported by the growing need for safe navigation, efficient routing, and real-time fleet monitoring. The International Maritime Organization requires Automatic Identification Systems on cargo vessels above 300 gross tons and on all passenger ships. This regulation creates a continuous global flow of vessel position, speed, direction, and identification data.
Maritime transport carries more than 80% of global merchandise trade, while seaborne cargo volumes exceeded 12.7 billion tonnes in 2024. Ton-miles also increased by nearly 6% as ships travelled longer distances because of route disruptions. These conditions increase demand for digital platforms that support route planning, congestion forecasting, real-time arrival updates, vessel monitoring, and dynamic port-slot booking.
Port & Logistics Information is expected to be the fastest-growing segment as ports increasingly adopt digital systems for berth allocation, container handling, yard management, and inland transport coordination. Indian ports reported cargo growth of more than 4% year-on-year during the first 7 months of FY2026, while container traffic recorded double-digit growth.
By Component
Software platforms held a dominant 43.5% share of the peer-to-peer energy trading component segment, as they manage the main functions required for local electricity trading. These platforms match millions of small and variable energy supplies with real-time demand, calculate prices, record transactions, and support secure payment settlement.
Services are expected to be the fastest-growing component because utilities, municipalities, and energy project developers require technical support to deploy and operate these platforms. The World Bank’s EnergyData platform contains more than 1,000 datasets and over 20 applications covering energy planning activities across 193 countries.
By Deployment Mode
Cloud-based deployment held a dominant 58.9% share of the peer-to-peer energy trading platforms market, as it provides the scalability required to manage large and continuously changing energy datasets. A utility- or city-level trading program can connect hundreds of thousands of smart meters, rooftop solar inverters, batteries, and other energy devices.
Cloud infrastructure allows platform providers to process this information without requiring utilities or aggregators to invest heavily in on-premises hardware. It supports energy forecasting, dynamic pricing, transaction matching, and payment settlement across millions of trading activities. Cloud-based systems can also expand capacity as more prosumers join the network, helping operators maintain reliable performance during periods of high demand.
By Technology
Automatic Identification System technology held a dominant 32.7% share of the peer-to-peer energy trading platforms market, supported by its widespread use across the global maritime industry. Under SOLAS Regulation V/19, AIS equipment is required on cargo vessels above 300 gross tons operating on international routes, cargo ships above 500 gross tons on domestic routes, and all passenger vessels.
The global commercial fleet includes more than 100,000 vessels and transports over 12 billion tonnes of cargo each year. This creates a large volume of time-stamped AIS data across major shipping routes and ports. Peer-to-peer platforms can use this information to forecast vessel arrivals, estimate berth demand, coordinate tug operations, schedule shore-side electricity supply, and manage port microgrid loads.
By Application
Fleet Management & Operations held a dominant 29.6% share of the peer-to-peer energy trading platforms market, as shipowners and fleet operators manage some of the largest and most continuous energy loads in maritime transport. Global seaborne trade exceeded 12 billion tonnes in 2023, while more than 80% of world merchandise was transported by sea. This large trade volume creates substantial demand for bunker fuel and onboard electricity used for propulsion, navigation, cooling, lighting, and cargo handling.
Peer-to-peer platforms help fleet operators reduce operating costs by improving voyage schedules, port arrival timing, slow-steaming decisions, shore-power use, and coordination with local microgrids. These platforms can also connect vessel batteries, waste-heat recovery systems, and shore-side charging infrastructure with local energy contracts.
By End User
Commercial shipping companies held a dominant 41.8% share of the peer-to-peer energy trading platforms market, as they operate the largest number of vessels and face substantial fuel and electricity costs. As of early 2026, the global merchant fleet had a carrying capacity of about 2.5 billion deadweight tons.
Approximately 116,000 vessels of at least 100 gross tons were in operation, including nearly 62,000 vessels above 1,000 gross tons. With around 80% of global merchandise trade transported by sea, commercial shipowners have a strong need to improve energy procurement and operating efficiency.
By Data Source
Vessel-based data held a dominant 38.4% share of the peer-to-peer energy trading platforms market because it provides direct and detailed information about ship movements and operating conditions. Under International Maritime Organization rules, Automatic Identification System equipment is required on cargo vessels above 300 gross tons operating on international routes, larger cargo ships on domestic routes, and all passenger vessels.
As of January 2026, the global merchant fleet included approximately 116,000 vessels of at least 100 gross tons, of which around 62,000 vessels were above 1,000 gross tons. This large fleet creates a continuous flow of real-time vessel data that can be used by peer-to-peer platforms. The information helps fleets and ports connect vessel movements, berth schedules, and auxiliary electricity demand with local energy markets.
By Solution Type
Maritime Monitoring & Tracking Solutions held a dominant 34.2% share of the peer-to-peer energy trading platforms market, as real-time vessel visibility is essential for energy planning and operational coordination. Automatic Identification System transponders required under International Maritime Organization rules continuously transmit vessel identity, position, speed, direction, and operating status for tens of thousands of ships.
Maritime Analytics Platforms are expected to be the fastest-growing solution segment. These platforms analyse historical AIS records, port performance information, fuel data, and vessel operating patterns to forecast congestion, calculate waiting times, and estimate berth-level energy demand. Arrival windows and generate revenue from flexible energy use.
Key Market Segments
By Information Type
- Navigation & Vessel Tracking Information
- Weather & Oceanographic Information
- Port & Logistics Information
- Maritime Security Information
- Fleet Performance Information
By Component
- Software Platforms
- Hardware Systems
- Services
By Deployment Mode
- Cloud-Based
- On-Premises
By Technology
- Automatic Identification System (AIS)
- Satellite-Based Monitoring
- Geographic Information Systems (GIS)
- Big Data Analytics
- Artificial Intelligence & Machine Learning
By Application
- Fleet Management & Operations
- Navigation & Route Optimization
- Port Management & Logistics
- Maritime Security & Surveillance
- Environmental Monitoring
By End User
- Commercial Shipping Companies
- Port Authorities
- Government & Naval Agencies
- Offshore Oil & Gas Operators
- Fisheries & Marine Research Organizations
By Data Source
- Vessel-Based Data
- Satellite Data
- Port & Harbor Data
- Oceanographic Sensors
By Solution Type
- Maritime Monitoring & Tracking Solutions
- Maritime Analytics Platforms
- Electronic Navigation Solutions
- Maritime Communication Systems
Geopolitical Impact Analysis
Geopolitical tensions are increasing costs and creating supply risks for peer-to-peer energy trading platforms. These platforms depend on solar modules, inverters, batteries, smart meters, communication equipment, and other electronic components. Recent trade measures and reciprocal tariffs in the United States have placed import duties of around 20% to 34% on selected clean-energy products, depending on their country of origin.
Shipping disruptions are creating further pressure. Rerouting vessels away from the Red Sea and Suez Canal through the Cape of Good Hope can add nearly 12 days to a typical Asia–Europe journey. This represents approximately a 30% increase in transit time and may raise voyage-related greenhouse gas emissions by around 70%. Longer routes increase fuel and freight expenses, delay hardware deliveries, and extend installation schedules for solar, battery, and digital grid projects.
Electricity price volatility also affects platform operators and users. During 2022–2023, fuel supply disruptions and policy uncertainty caused retail electricity prices to rise sharply, while wholesale prices in parts of Europe temporarily increased several times above normal levels. Higher price volatility strengthens demand for real-time energy trading, battery storage, demand response, and local price hedging.
Trade restrictions have additionally delayed clean-technology investment and contributed to the cancellation of manufacturing projects valued at billions of dollars in the United States. Overall, geopolitical instability can increase revenue opportunities per transaction, but it also makes market expansion more difficult through higher equipment costs, longer delivery cycles, investment uncertainty, and changing regional energy prices.
Regional Analysis
North America held a dominant 35.7% share of the global peer-to-peer energy trading platforms market in 2025, generating approximately USD 26.3 million in revenue. The region benefits from strong adoption of distributed solar systems, smart meters, battery storage, and advanced digital grid infrastructure. The United States continues to install tens of gigawatts of solar PV capacity each year, while the expansion of rooftop generation and connected energy devices has created millions of prosumer endpoints.
Supportive policies and pilot programs also strengthen the regional market. States such as California and New York are encouraging community solar, local energy markets, virtual power plants, and flexible grid services. This regulatory support allows utilities, energy aggregators, and technology providers to test new commercial models and connect peer-to-peer trading systems with existing utility operations.
Asia-Pacific is expected to be the fastest-growing regional market. Growth is supported by rapid urbanisation, expanding electricity demand, and large investments in rooftop solar, utility-scale solar, battery storage, and smart grids. China, India, Australia, and Japan are increasing renewable energy deployment while testing energy communities, blockchain settlement, and local electricity trading models.
Key Regions and Countries
North America
- US
- Canada
Europe
- Germany
- France
- The UK
- Spain
- Italy
- Rest of Europe
Asia Pacific
- China
- Japan
- South Korea
- India
- Australia
- Rest of APAC
Latin America
- Brazil
- Mexico
- Rest of Latin America
Middle East & Africa
- GCC
- South Africa
- Rest of MEA
Market Dynamics
Drivers
| Driver | (~) % CAGR | Geographic Relevance | Impact Timeline |
|---|---|---|---|
| Growth in distributed renewables | +4.0% | Europe, Asia-Pacific, North America | Short term (≤ 2 years) |
| Blockchain-based P2P trading maturation | +3.2% | EU, UK, Australia, selected US states | Medium term (2–4 years) |
| Regulatory pilots for local energy communities | +2.6% | EU, India, Australia | Short term (≤ 2 years) |
| Smart meter and DER interoperability | +2.1% | OECD markets, China | Medium term (2–4 years) |
| Rising retail electricity prices | +1.8% | Europe, parts of Asia, Latin America | Short term (≤ 2 years) |
| Corporate decarbonization and ESG mandates | +1.5% | Global large enterprises | Long term (≥ 4 years) |
Growth in distributed renewables
The rapid expansion of rooftop solar and other distributed energy resources over the past 2 years has supported the growth of peer-to-peer energy trading platforms. Between 2024 and 2026, several European markets recorded residential and commercial solar capacity growth of around 20–30% annually. Average rooftop system sizes also increased from approximately 3–5 kW to 7–10 kW, creating surplus electricity for around 2–4 hours per day.
P2P platforms allow prosumers to sell this surplus at prices that are often 10–25% higher than traditional feed-in tariffs. Local buyers may also receive electricity discounts of approximately 5–15% compared with standard retail tariffs. These benefits can improve platform gross margins per traded MWh by an estimated 5–8 percentage points compared with conventional electricity retail models.
Platforms can generate revenue through transaction fees of around 1–3 euro cents per kWh, supporting scalable and asset-light business models. Higher electricity returns can also improve the financial performance of rooftop solar systems. In favorable markets, solar payback periods may decline from approximately 8–10 years to around 5–7 years.
Restraints
| Restraint | (~) % CAGR | Geographic Relevance | Impact Timeline |
|---|---|---|---|
| Regulatory ambiguity on P2P power sales | –3.8% | Asia, Africa, parts of Europe and Latin America | Short term (≤ 2 years) |
| Grid access and wheeling charge barriers | –3.0% | India, emerging Asia, Sub-Saharan Africa | Medium term (2–4 years) |
| High cost of compliance and licensing | –2.4% | EU, UK, North America | Short term (≤ 2 years) |
| Limited smart metering penetration | –2.0% | South Asia, Latin America, Africa | Long term (≥ 4 years) |
| Consumer protection and data privacy constraints | –1.6% | EU, UK, selected Asia-Pacific markets | Medium term (2–4 years) |
| High interest rate environment for prosumer capex | –1.2% | Global, with stronger impact in emerging markets | Short term (≤ 2 years) |
Regulatory ambiguity on P2P power sales
The main restraint on peer-to-peer energy trading platforms is the lack of clear legal recognition for direct electricity sales between households and businesses. In many jurisdictions, only utilities and licensed retailers are permitted to sell grid-connected electricity. In several Asian and African markets, wheeling charges and cross-subsidy surcharges can increase the underlying energy cost by 20–40% when P2P transactions are treated as third-party sales.
Regulatory uncertainty often limits platforms to sandbox projects involving only a few hundred to a few thousand users. Annual traded volumes may also be capped below 10 GWh per pilot. Legal and compliance requirements can increase operating expenses by 10–20% and delay commercial deployment by 12–24 months compared with markets that have established clear P2P trading rules.
Challenges
| Challenge | (~) % CAGR | Geographic Relevance | Mitigation Horizon |
|---|---|---|---|
| Grid balancing and congestion management | –3.5% | Europe, US, high-DER penetration markets | Long term (≥ 4 years) |
| Scalable settlement and billing infrastructure | –2.7% | Global | Medium term (2–4 years) |
| Cybersecurity and data governance risk | –2.3% | Global | Medium term (2–4 years) |
| User acquisition and retention costs | –2.0% | Global retail markets | Short term (≤ 2 years) |
| Interoperability across platforms and DERs | –1.8% | Global | Long term (≥ 4 years) |
| Skills gap in energy-tech and blockchain | –1.5% | Global, especially emerging markets | Medium term (2–4 years) |
Grid balancing and congestion management
A key challenge for peer-to-peer energy trading is maintaining grid stability as thousands of small trades change the timing and location of electricity flows. In markets with high distributed energy resource penetration, voltage fluctuations and local congestion may increase technical losses by 1–3 percentage points on affected feeders. Uncoordinated price responses may also increase peak ramps by 10–20% within 15–30 minutes.
Grid operators may need smart transformer controls, real-time data systems, and flexibility resources to manage these risks. These upgrades can add several tens of euros per kW of connected distributed generation. As a result, platform integration costs per user may rise by approximately 5–15%, while interconnection timelines may be extended by 6–18 months.
P2P platforms must work with distribution system operators to introduce congestion management, locational pricing, and curtailment rules. These measures may reduce trading volumes by 10–25% in grid-constrained areas. Although investment in forecasting, grid-aware matching engines, research, and operations will increase, these capabilities are essential for sustainable market expansion.
Opportunities
| Opportunity | (~) % CAGR | Geographic Relevance | Execution Window |
|---|---|---|---|
| Integration of P2P platforms with flexibility and ancillary services | +3.6% | Europe, UK, advanced Asia-Pacific markets | Medium term (2–4 years) |
| Expansion into community microgrids and energy sharing schemes | +3.0% | Global, strongest in emerging markets | Long term (≥ 4 years) |
| Tokenized green certificates and fractional ownership | +2.4% | Global, with early traction in EU and Asia | Medium term (2–4 years) |
| White-label platforms for utilities and retailers | +2.2% | Global regulated markets | Short term (≤ 2 years) |
| Embedded finance and prosumer credit products | +1.9% | Global, particularly emerging markets | Medium term (2–4 years) |
| Cross-border renewable energy P2P corridors | +1.5% | EU internal market, regional power pools | Long term (≥ 4 years) |
Integration of P2P platforms with flexibility and ancillary services
Most peer-to-peer energy trading platforms currently focus on basic kilowatt-hour matching between local buyers and sellers. Grid flexibility services, including frequency regulation, voltage support, and congestion relief, are still mainly procured through traditional market mechanisms. By aggregating thousands of flexible loads and distributed generators, P2P platforms could enter balancing markets, where fast-response service prices may be 2–5 times higher than standard energy prices.
The additional revenue could be shared with prosumers through dynamic tariffs, improving household returns by an estimated 10–20% compared with energy-only trading. Platform business models could also move from transaction fees toward hybrid structures that combine per-kWh commissions with performance-based fees. Under such models, around 20–40% of flexibility revenue could be shared with users, while platform gross margins may increase by 5–10 percentage points.
The integration of flexibility services requires investment in forecasting systems, aggregation algorithms, control technologies, and grid-code compliance. However, the additional capital expenditure for metering, control hardware, and software integration may remain within 10–30 euros per kW of controllable capacity. This investment could provide access to larger balancing markets and strengthen the role of P2P platforms in grid management and system-level decarbonization.
Key Players Analysis
The competitive landscape of the peer-to-peer energy trading platforms market shows a clear Tier-1 and Tier-2 structure within the related maritime technology ecosystem. Tier-1 companies compete through large-scale operations, integrated hardware and software, advanced analytics, and strong research spending. Thales Group generated EUR 20.6 billion in revenue in 2024, including EUR 10.6 billion from Defense & Security, which increased by 12%.
The company invested around 18% of revenue, or nearly EUR 3.7 billion, in research and development covering artificial intelligence, sensing, and autonomous systems. Wärtsilä reported EUR 6,449 million in 2024 net sales, with its Marine business contributing EUR 3,053 million.
Kongsberg recorded order intake of nearly NOK 90 billion and an order backlog of NOK 128 billion, representing 44% year-on-year growth. DNV generated NOK 34,966 million in operating revenue, up 10.7%, while Hexagon AB reported EUR 5.4 billion in 2024 sales. Its Asset Life Cycle Intelligence division increased by 10% to EUR 228.8 million.
Tier-2 companies are generally smaller and focus on vessel tracking, satellite data, AIS analytics, and subsea monitoring. Spire Global reported USD 110.5 million in FY2024 revenue, increasing 13%, and USD 112.2 million in annual recurring revenue. Orbcomm, Windward, MarineTraffic, Kraken Robotics, Furuno Electric, and Inmarsat Maritime compete through specialized data, sensors, and communication systems.
Top Key Players in the Market
- Kongsberg Maritime
- Wärtsilä
- Thales Group
- Northrop Grumman
- Orbcomm
- Spire Global
- Windward
- MarineTraffic
- Furuno Electric
- Lloyd’s Register
- DNV
- Inmarsat Maritime
- Hexagon AB
- Kraken Robotics
- Veson Nautical
Recent Developments
- In 2026, Kraken Robotics completed the acquisition of Covelya Group on July 2 for approximately CAD 615 million. The transaction strengthened Kraken’s maritime monitoring, navigation, communication, imaging, positioning, and data analytics capabilities. The company expects approximately CAD 10 million in cost savings within 24 months and increased its 2026 revenue guidance to CAD 290–320 million, with adjusted EBITDA projected at CAD 65–75 million.
- In 2025, Spire Global completed the sale of its maritime data business to Kpler on April 25 for approximately USD 233.5 million, before adjustments. The agreement also included USD 7.5 million for transition services over 12 months, bringing the disclosed transaction value to around USD 241 million. Spire used the sale proceeds to repay all outstanding debt, while Kpler expanded its satellite-based vessel tracking and maritime analytics operations.
Report Scope
| Report Features | Description |
|---|---|
| Market Value (2025) | USD 73.8 Million |
| Forecast Revenue (2035) | USD 911.4 Million |
| CAGR (2026-2035) | 28.6% |
| Base Year for Estimation | 2025 |
| Historic Period | 2020-2024 |
| Forecast Period | 2026-2035 |
| Report Coverage | Revenue Forecast, Market Dynamics, Competitive Landscape, Recent Developments |
| Segments Covered | By Information Type (Navigation & Vessel Tracking Information, Weather & Oceanographic Information, Port & Logistics Information, Maritime Security Information, Fleet Performance Information); By Component (Software Platforms, Hardware Systems, Services); By Deployment Mode (Cloud-Based, On-Premises); By Technology (Automatic Identification System (AIS), Satellite-Based Monitoring, Geographic Information Systems (GIS), Big Data Analytics, Artificial Intelligence & Machine Learning); By Application (Fleet Management & Operations, Navigation & Route Optimization, Port Management & Logistics, Maritime Security & Surveillance, Environmental Monitoring); By End User (Commercial Shipping Companies, Port Authorities, Government & Naval Agencies, Offshore Oil & Gas Operators, Fisheries & Marine Research Organizations); By Data Source (Vessel-Based Data, Satellite Data, Port & Harbor Data, Oceanographic Sensors); By Solution Type (Maritime Monitoring & Tracking Solutions, Maritime Analytics Platforms, Electronic Navigation Solutions, Maritime Communication Systems) |
| Regional Analysis | North America – US, Canada; Europe – Germany, France, The UK, Spain, Italy, Rest of Europe; Asia Pacific – China, Japan, South Korea, India, Australia, Singapore, Rest of APAC; Latin America – Brazil, Mexico, Rest of Latin America; Middle East & Africa – GCC, South Africa, Rest of MEA |
| Competitive Landscape | Kongsberg Maritime, Wärtsilä, Thales Group, Northrop Grumman, Orbcomm, Spire Global, Windward, MarineTraffic, Furuno Electric, Lloyd’s Register, DNV, Inmarsat Maritime, Hexagon AB, Kraken Robotics, Veson Nautical |
| Customization Scope | Customization for segments and region/country levels will be provided. Moreover, customization can be tailored to the requirements. |
| Purchase Options | We have three licenses to opt for: Single User License, Multi-User License (Up to 5 Users), Corporate Use License (Unlimited Users and Printable PDF) |





























