


Report Overview
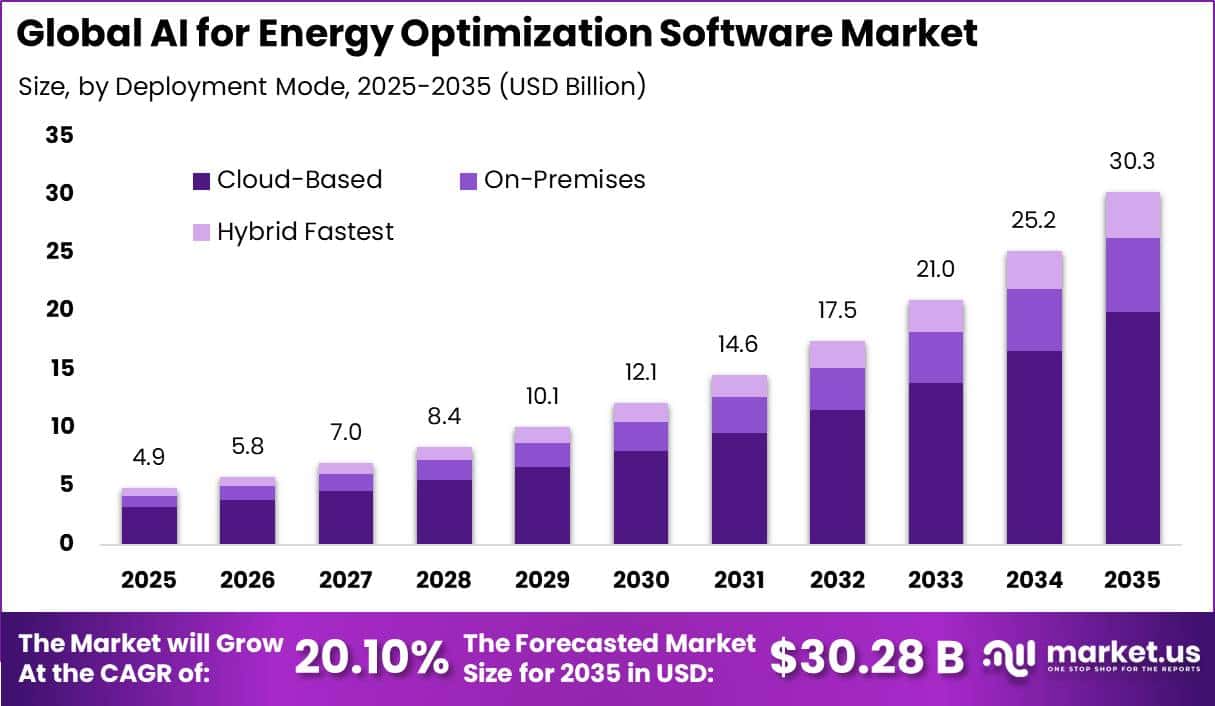
In 2025, the Global AI for Energy Optimization Software Market was valued at USD 4.8 billion. The market is projected to grow at a CAGR of 20.1% during 2026–2035, reaching approximately USD 30.2 billion by 2035. Europe dominated the global market in 2025, accounting for more than 35.0% of the total market share and generating approximately USD 1.69 billion in revenue.
Growth is supported by rising electricity demand from data centres, buildings, transport, and industry. Global electricity use increased by about 800 TWh, or 3%, in 2025 and is expected to rise from 28,200 TWh in 2025 to 33,600 TWh by 2030, adding 5,400 TWh in 5 years. Data centres consumed around 415 TWh in 2024, equal to 1.5% of global electricity use, and could reach 945 TWh by 2030.
Global data-centre investment reached nearly USD 500 billion in 2024, almost 2 times the 2022 level. AI-based fault detection can reduce outage duration by 30–50%, while digital grid tools could unlock up to 175 GW of transmission capacity.
Buildings account for around 40% of EU energy use, 50% of gas consumption, and nearly 80% of household energy use. EU final energy consumption reached 901 Mtoe in 2024, around 18% above the 2030 target of 763 Mtoe. EU rules require a 1.9% annual public-sector energy reduction and a 3% yearly renovation rate for public buildings.
Residential building energy use must fall by at least 16% by 2030 and 20–22% by 2035 versus 2020. Around 60% of European households had smart electricity meters by 2024, while penetration exceeded 80% in 15 EU countries, supporting wider AI-based energy optimization.
Key Takeaway
- The AI for Energy Optimization Software Market was valued at USD 4.8 billion in 2025 and is projected to reach USD 30.2 billion by 2035 at a 20.1% CAGR.
- Software leads the market with a 65.0% share, supported by its central role in converting energy and operational data into real-time optimization decisions.
- Cloud-based deployment leads with a 66.0% share, driven by scalable energy-data processing without extensive on-site server infrastructure.
- Electricity leads with a 58.5% share, supported by its high measurability, digital controllability, and suitability for real-time optimization.
- Machine learning leads with a 25.9% share, owing to its ability to convert large energy datasets into forecasts, efficiency insights, and operating decisions.
- Energy Consumption Optimization leads with a 28.8% share, driven by measurable savings from continuous monitoring and control of energy use.
- Utilities lead with a 32.1% share, supported by growing requirements to manage complex grids, variable generation, and changing electricity demand.
- Energy Consumption and Demand Optimization leads with a 29.1% share, supported by continuous energy monitoring, forecasting, and demand control.
- Energy Analytics & Monitoring leads with a 31.0% share, as continuous measurement is essential for identifying energy waste and improving efficiency.
- Manufacturing Plants lead with a 32.1% share, driven by high energy consumption across production equipment, heating, cooling, and process systems.
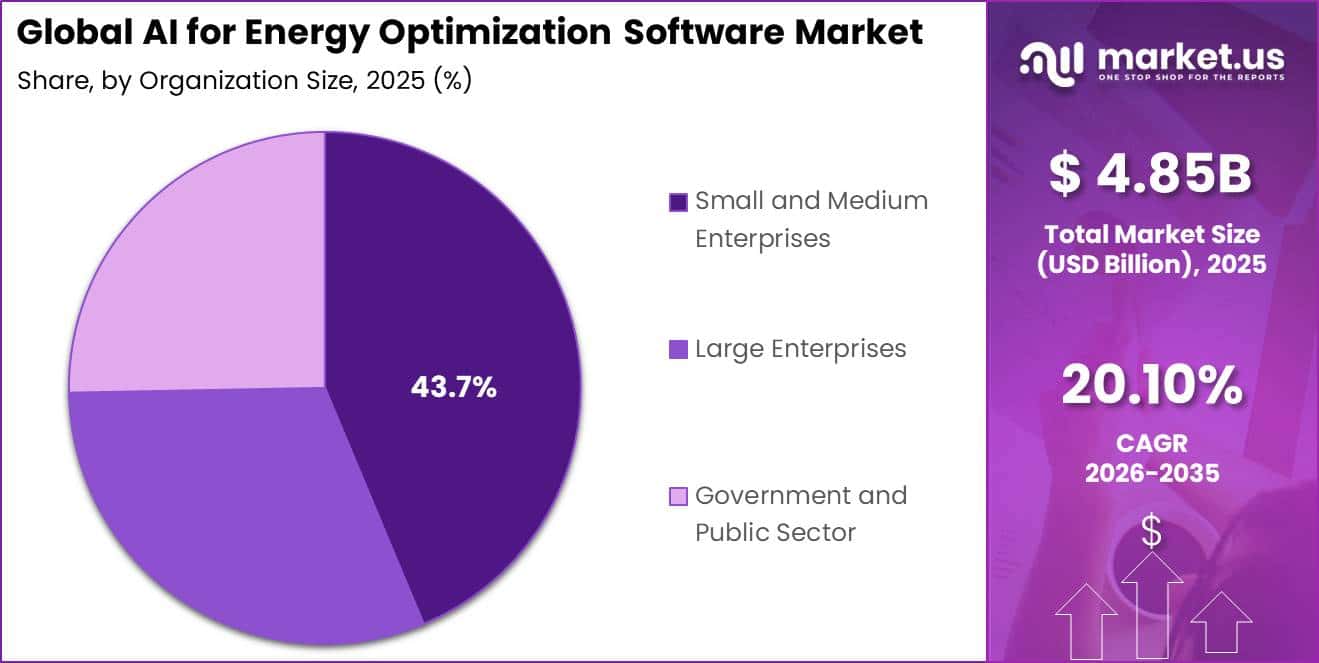
- Small and Medium Enterprises lead with a 43.7% share, supported by increasing adoption of affordable digital tools to reduce energy use and operating costs.
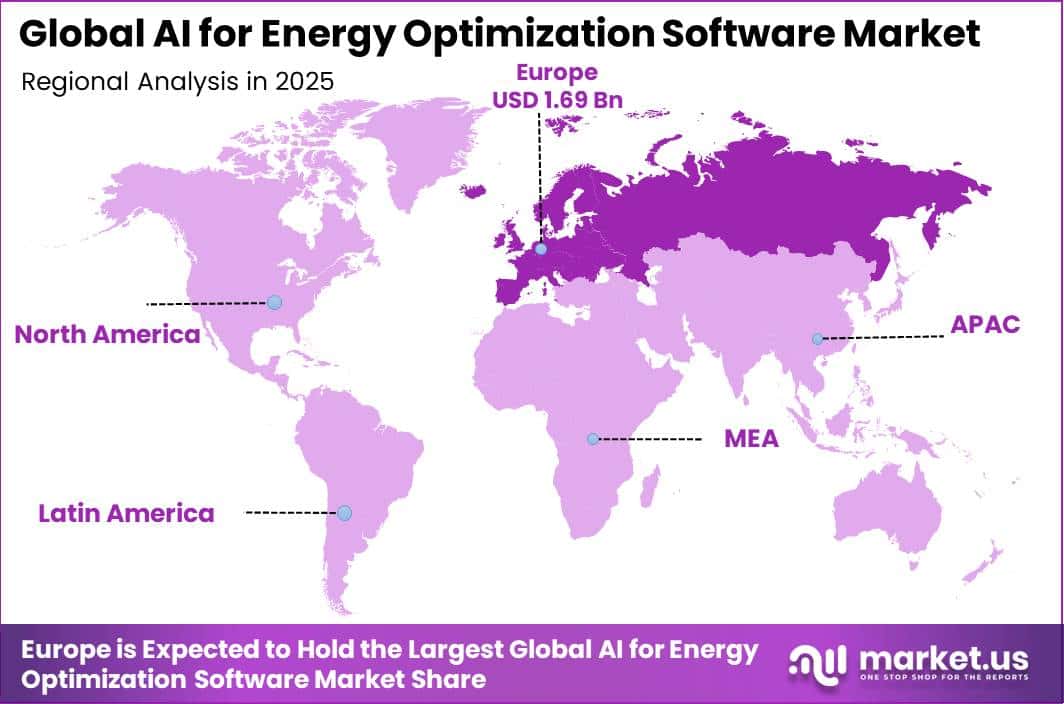
- Europe led the market in 2025 with more than 35.0% share, worth approximately USD 1.69 billion.
Market Statistics and Data Insights
- In 2026, Resorts World Las Vegas reduced chilled-water-plant energy use by 10.2% using Johnson Controls OpenBlue AI autonomous control, generating about USD 110,000 in annual energy-cost savings without replacing existing equipment.
- The same 2026 OpenBlue installation received an additional USD 88,000 utility incentive, while its AI optimization engine recalculates the most efficient chiller, pump, and cooling-tower combination every 15 minutes.
- In 2026, DATEV reported that Johnson Controls’ AI-based Energy & Comfort Intelligence reduced applicable airside HVAC energy consumption by nearly 10%, while autonomous control executed thousands of dynamic commands per equipment unit without generating a single comfort complaint.
- A Schneider Electric digital optimization project reported in April 2026 reduced annual energy demand at a 30-floor Adelaide office building by almost 50%, while gas consumption declined 5% year-on-year.
- The same Schneider Electric optimization program extended HVAC asset life by at least 20%, demonstrating that analytics-led energy management can also reduce equipment replacement and maintenance pressure.
- At MST hospital, Siemens installed its Building Energy Optimization System in early 2025 and began real-time control in August 2025; optimization increased combined heat-and-power efficiency from 67% to 89%.
- Honeywell’s 2025 survey of 250 U.S. commercial-building managers and decision-makers found that 55% were already using AI for overall building energy management.
- The same 2025 Honeywell study found 49% of respondents were already using AI-based predictive maintenance, while nearly 60% had adopted AI to streamline maintenance and repair processes.
- Global data-centre electricity consumption increased 17% in 2025, while electricity consumption at AI-focused data centres increased 50%, creating stronger operational pressure for workload, cooling and power-management software.
- Global battery-storage deployment reached 108 GW of new capacity in 2025, representing a 40% year-on-year increase and expanding the volume of storage assets requiring automated charge, discharge and price optimization.
- Battery-based UPS capacity additions, primarily serving data centres, increased 30% in 2025 to approximately 45 GW, increasing the amount of power infrastructure available for digitally coordinated backup and resilience management.
By Component
The software segment held a dominant 65.0% share of the AI for Energy Optimization Software Market because it acts as the main digital layer for converting energy, asset, weather, tariff, and operating data into real-time decisions. Software can also be deployed across multiple locations and improved through regular updates, supporting continuous energy savings.
Global end-use energy-efficiency investment reached about USD 660 billion in 2024, covering buildings, transport, industry, electrification, and heat pumps. Governments also allocated nearly USD 60 billion toward building-efficiency measures during the same year, expanding the number of connected assets requiring digital monitoring and control.
In Europe, building automation and control systems are required for non-residential buildings with heating or cooling systems above 290 kW, while this threshold will decline to 70 kW by the end of 2029. AI-based software helps users identify energy waste, forecast peak demand, and optimize HVAC, lighting, storage, and power-generation systems.
Meanwhile, the services segment is the fastest-growing segment, expanding at a 25.4% CAGR. Growth is supported by increasing demand for system integration, data cleaning, AI model training, cybersecurity, energy audits, and ongoing performance management. These services help organizations convert AI software insights into measurable energy savings, lower operating costs, and improved equipment performance.
By Deployment Mode
The cloud-based segment held a dominant 66.0% share of the AI for Energy Optimization Software Market because it allows utilities, building operators, and multi-site companies to process large volumes of energy data without maintaining costly local servers.
In 2025, 52.7% of EU enterprises used paid cloud services, up 7.4 percentage points from 2023, while 40.9% of enterprises used advanced cloud services such as hosted databases, security tools, development platforms, finance systems, and enterprise resource planning solutions.
Meanwhile, the hybrid segment is the fastest-growing segment, expanding at a 25.5% CAGR. Hybrid systems are gaining adoption because critical energy operations still require fast local control. These solutions process time-sensitive equipment data at the site or edge while using cloud platforms for larger forecasting models and portfolio-level analysis.
The European Commission aims for 75% of EU businesses to use cloud-edge technologies by 2030 and plans to deploy 10,000 climate-neutral and secure edge nodes across Europe. These initiatives are expected to strengthen the infrastructure needed for wider adoption of hybrid AI energy optimization solutions.
By Energy Source
The electricity segment held a dominant 58.5% share of the AI for Energy Optimization Software Market because electricity is the energy source most easily measured, monitored, and controlled through digital systems. Global renewable capacity additions reached about 700 GW in 2024, including nearly 550 GW of solar PV and 120 GW of wind capacity.
Electricity demand from industry increased by nearly 4% in 2024, while electricity use in transport grew by more than 8%, supported by global electric-car sales exceeding 17 million units. This growing electrification creates more flexible loads that can be optimized using AI-based platforms. Electricity also has a strong digital advantage because smart meters, sensors, batteries, inverters, and charging systems continuously generate operational data.
AI software can use this data to reduce losses, manage demand peaks, and automate equipment settings. With renewable sources contributing more than 80% of global electricity-generation growth in 2024, electricity optimization is becoming increasingly important for grid reliability and lower operating costs.
By AI Technology
The machine learning segment held a dominant 25.9% share of the AI for Energy Optimization Software Market because it is widely used to convert large volumes of energy data into practical operating decisions. Power systems continuously generate data from smart meters, grid sensors, weather systems, renewable-energy assets, and equipment records.
Research from the National Renewable Energy Laboratory also showed that machine-learning grid models achieved 99.72% accuracy in frequency estimation and 99.29% accuracy in transient estimation, demonstrating their ability to support fast and reliable power-system analysis.
Meanwhile, the generative AI segment is the fastest-growing segment, expanding at a 27% CAGR. Generative AI can convert complex engineering data, operating manuals, maintenance records, and grid requirements into simple guidance for operators. It can also support scenario analysis, prepare operating procedures, and evaluate unusual weather-related risks.
By Optimization Function
The Energy Consumption Optimization segment held a dominant 28.8% share of the AI for Energy Optimization Software Market. Its leadership is supported by the large, measurable savings available from continuously monitoring and controlling industrial energy use. The IEA reports that structured energy-management programs deliver more than 10% energy savings on average within the first 3 years, while some companies achieve 30% or more.
Across IEA member countries, bringing industrial firms closer to the performance of the top 25% most energy-efficient companies could reduce annual industrial energy costs by up to USD 600 billion. AI strengthens this function by continuously detecting inefficient equipment, adjusting operating schedules, forecasting loads, and reducing unnecessary consumption.
Meanwhile, the Energy Storage Optimization segment is the fastest-growing segment, expanding at a 23.15% CAGR. Global battery-storage additions reached 108 GW in 2025, increasing 40% from 2024, while installed capacity became 11 times higher than in 2021. Around 80% of new capacity was utility-scale. This rapid expansion creates strong demand for AI software that decides when batteries should charge, discharge, provide grid services, or shift renewable electricity to higher-demand periods.
By End User
The utilities segment held a dominant 32.1% share of the AI for Energy Optimization Software Market because utilities manage increasingly complex grids with large volumes of variable generation, demand, pricing, and network data. Global renewable power capacity reached 4,448 GW at the end of 2024, representing 46.4% of total installed power capacity, while variable renewables accounted for 31.3%. This scale requires AI tools for load forecasting, dispatch planning, congestion management, loss reduction, and demand-response decisions across utility networks.
Meanwhile, the data centers segment is the fastest-growing segment, expanding at a 25.9% CAGR. Lawrence Berkeley National Laboratory estimates that U.S. data centers could account for 11.8% of total national electricity use by 2030, with a possible range of 9.5–15.3% and reference-case consumption of 649 TWh.
U.S. electricity demand also grew about 1.7% annually during 2020–2025, compared with only 0.1% annually during 2005–2019, with data centers driving much of the recent increase. These large continuous loads increase demand for AI software that optimizes cooling, workload scheduling, electricity procurement, backup systems, and peak-load management.
By Application
The Energy Consumption and Demand Optimization segment held a dominant 29.1% share of the AI for Energy Optimization Software Market because energy users increasingly have the digital infrastructure needed to measure and control consumption continuously. FERC reported 128.4 million advanced electricity meters operating in the United States in 2023, compared with only 6.7 million in 2007, lifting penetration from 4.7% to 76.8%.
Meanwhile, the Data Center Energy Optimization segment is the fastest-growing segment, expanding at a 26.5% CAGR. U.S. Department of Energy-backed testing of a data-center cooling optimization toolkit achieved 53% cooling-energy savings at one facility and 74% at another, significantly exceeding the original 30% savings target.
By Solution Type
The Energy Analytics & Monitoring segment held a dominant 31.0% share of the AI for Energy Optimization Software Market because continuous measurement is the starting point for reducing energy waste. The U.S. Department of Energy estimates that properly implemented building monitoring and control systems can deliver about 30% annual energy savings.
Advanced analytics, machine learning, and predictive controls could provide an additional 10% reduction in total building energy consumption. AI platforms analyze equipment, meter, temperature, occupancy, and operating data to detect abnormal consumption and recommend corrective actions, making analytics a core function across commercial and industrial energy systems.
Meanwhile, the Carbon Management segment is the fastest-growing segment, expanding at a 19.1% CAGR. EU ETS-covered emissions reached approximately 1,187 million tonnes of CO₂-equivalent in 2024, while carbon allowance auctions generated €38.8 billion during the year.
Carbon pricing now covers around 75% of EU greenhouse-gas emissions following recent ETS expansion. These financial and regulatory pressures are increasing demand for AI software that measures emissions, tracks reduction targets, identifies carbon-intensive operations, and supports compliance, reporting, and investment decisions.
By Facility Type
The Manufacturing Plants segment held a dominant 32.1% share of the AI for Energy Optimization Software Market because factories operate many energy-intensive systems, including motors, pumps, compressed air, process heating, refrigeration, and production lines. These systems create continuous operational data that AI can analyze to reduce idle loads, improve equipment scheduling, and lower energy use.
The U.S. Department of Energy’s Industrial Training and Assessment Centers have assessed more than 21,650 manufacturing facilities and generated over 161,200 energy and productivity recommendations. This large number of identified plant-level improvements demonstrates the economic need for continuous monitoring and optimization software rather than one-time efficiency measures.
Meanwhile, the Data Centers segment is the fastest-growing segment, expanding at a 25.85% CAGR. Great Britain had approximately 1.6 GW of colocation data-center IT capacity in 2024. Data centers consumed around 4.5 TWh of electricity in Great Britain in 2024, equal to 2% of grid electricity consumption and 41% higher than in 2020. AI optimization therefore becomes increasingly important for coordinating computing loads, cooling, power distribution, and facility operations.
By Organization Size
The Small and Medium Enterprises segment held a dominant 43.7% share of the AI for Energy Optimization Software Market because SMEs make up the largest share of businesses and are increasingly adopting digital tools to reduce energy and operating costs. According to the European Commission, SMEs represent 99.8% of all enterprises in the European Union, creating a large customer base for energy optimization solutions.
The OECD’s 2025 D4SME Survey found that 39% of surveyed SMEs were using AI applications. The same survey showed that 28% used digital tools to support sustainability activities, while 17% already tracked their energy consumption through digital systems. These figures show that SMEs are steadily building the digital foundation needed for AI-based energy management.
Key Market Segments
By Component
- Software
- Services
By Deployment Mode
- Cloud-Based
- On-Premises
- Hybrid
By Energy Source
- Electricity
- Natural Gas
- Battery Energy Storage
- Distributed Energy Resources
- Hybrid Energy Systems
- Solar Energy
- Wind Energy
- Hydropower
By AI Technology
- Machine Learning
- Deep Learning
- Generative AI
- Digital Twin & AI
- Optimization Algorithms
- Reinforcement Learning
- Predictive Analytics
- Natural Language Processing
- Computer Vision
By Optimization Function
- Energy Consumption Optimization
- Renewable Energy Optimization
- Energy Storage Optimization
- Energy Trading Optimization
- Demand Optimization
- Load Forecasting
- Peak Load Management
- Energy Cost Optimization
- Carbon Emission Optimization
- Asset Performance Optimization
By End User
- Utilities
- Healthcare Facilities
- Retail & Hospitality
- Residential Buildings
- Manufacturing
- Commercial Buildings
- Industrial Facilities
- Data Centers
- Transportation & Mobility
- Other End Users
By Application
- Energy Consumption and Demand Optimization
- Asset Performance and Predictive Maintenance
- Industrial Energy Optimization
- Data Center Energy Optimization
- Energy Storage Management
- Smart Grid and DER Management
- Renewable Energy Forecasting and Integration
- Energy Trading, Pricing and Market Intelligence
- Building Energy Optimization
- Carbon and Sustainability Management
By Solution Type
- Energy Analytics & Monitoring
- Predictive Maintenance
- Renewable Energy Management
- AI Energy Forecasting
- Automated Energy Control
- Demand Response Optimization
- Energy Management & Reporting
- AI-Based Energy Trading
- Energy Storage Optimization
- Carbon Management
By Facility Type
- Office Buildings
- Retail & Shopping Centers
- Manufacturing Plants
- Hotels
- Hospitals
- Educational Institutions
- Warehouses and Logistics Centers
- Data Centers
- Airports & Transportation Facilities
- Other Facilities
By Organization Size
- Small and Medium Enterprises
- Large Enterprises
- Government and Public Sector
Geopolitical Impact Analysis
Geopolitical tensions are raising the deployment cost and supply-chain risk of AI for Energy Optimization Software, particularly for the physical infrastructure supporting these platforms, including semiconductors, servers, telecommunications equipment, smart sensors, gateways, and edge-computing devices.
WTO data show that AI-related goods, including semiconductors, servers, and telecom equipment, increased 20% year-on-year in the first half of 2025 and generated nearly half of global merchandise-trade growth. At the same time, WTO monitoring recorded 141 new trade-related actions, with affected trade reaching USD 2.7 trillion; about 83%, or USD 2.26 trillion, was linked to trade-policy changes introduced since early 2025.
Higher tariffs and export restrictions therefore increase hardware procurement costs and encourage software vendors and energy operators to diversify suppliers and regionalize infrastructure sourcing.
Regional conflicts are also disrupting equipment distribution. UNCTAD reports that Red Sea rerouting around the Cape of Good Hope adds about 12 days, increases Asia-Europe transit times by roughly 30%, and reduces effective global container capacity by about 9%. Suez Canal transits fell by around 70% by mid-2024.
Meanwhile, EU wholesale electricity prices averaged about USD 90/MWh in the first half of 2025, approximately 30% higher year-on-year, while natural-gas prices increased around 20%. These disruptions increase cloud and data-center operating costs while strengthening demand for AI software that forecasts energy prices, shifts loads, optimizes storage, and reduces exposure to volatile electricity markets.
Regional Analysis
In 2025, Europe held a dominant position in the AI for Energy Optimization Software Market, capturing more than a 35.0% share and generating approximately USD 1.69 billion in market value. The region’s leadership is supported by strong energy-efficiency policies, widespread digitalization of utilities and buildings, and growing adoption of renewable energy.
Rising deployment of solar, wind, battery storage, electric vehicles, and heat pumps is making electricity networks more complex, encouraging operators to use AI for forecasting, load balancing, demand response, and real-time energy management. These conditions continue to support Europe’s 35.0% market leadership.
Meanwhile, Asia Pacific is the fastest-growing regional market and is projected to expand at a 22.5% CAGR. Growth is being driven by rapid industrialization, expanding data-center capacity, urban development, renewable-energy installations, and increasing electricity demand across major economies in the region.
Key Regions and Countries
North America
- US
- Canada
Europe
- Germany
- France
- The UK
- Spain
- Italy
- Rest of Europe
Asia Pacific
- China
- Japan
- South Korea
- India
- Australia
- Rest of APAC
Latin America
- Brazil
- Mexico
- Rest of Latin America
Middle East & Africa
- GCC
- South Africa
- Rest of MEA
Market Dynamics
Drivers
| Driver | (~) % CAGR | Geographic Relevance | Impact Timeline |
|---|---|---|---|
| Accelerating Load Complexity | +1.4% | North America, Europe, China, developed APAC | Short term (2 years or less) |
| Renewable Variability Expansion | +1.0% | Europe, China, United States, Australia | Medium term (2 to 4 years) |
| Enterprise Cloud-AI Adoption | +0.8% | Europe, North America, East Asia | Short term (2 years or less) |
| Wholesale Power Price Volatility | +0.7% | Europe, United States, Australia | Short term (2 years or less) |
| Advanced Metering Scale-Up | +0.6% | North America, Europe, developed APAC | Medium term (2 to 4 years) |
| Building Electrification Controls | +0.5% | Europe, North America, Japan, South Korea | Medium term (2 to 4 years) |
Accelerating Load Complexity
Electric-load growth is making AI energy optimization software a continuous operating tool rather than a periodic efficiency solution. According to the IEA, global electricity demand increased 4.4% in 2024 and another 3% in 2025, while buildings contributed nearly 45% of the 2025 demand increase and data-center electricity use rose about 17%.
FERC reported that U.S. summer electricity load in 2025 was expected to exceed each of the previous 4 summers. The U.S. EIA also found electricity demand grew about 1.7% annually during 2020–2025, compared with only 0.1% annually during 2005–2019. Rising and more variable loads increase demand for AI forecasting, peak management, HVAC control, and real-time dispatch, supporting an estimated +1.4% CAGR impact.
Restraints
| Restraint | (~) % CAGR | Geographic Relevance | Impact Timeline |
|---|---|---|---|
| Critical-Infrastructure AI Compliance | -1.3% | European Union, EEA-linked deployments | Short term (2 years or less) |
| Sovereign-Cloud Procurement Rules | -0.9% | Europe, Middle East, regulated Asia | Medium term (2 to 4 years) |
| Utility Procurement Inertia | -0.8% | Global regulated utilities | Medium term (2 to 4 years) |
| SME Integration Cost Barrier | -0.7% | Europe, Latin America, Southeast Asia | Short term (2 years or less) |
| Weak Dynamic-Tariff Exposure | -0.6% | Regulated retail-power markets | Medium term (2 to 4 years) |
| Savings Verification Risk | -0.5% | Global commercial and industrial sites | Short term (2 years or less) |
Critical-Infrastructure AI Compliance
Regulatory requirements can delay AI energy-optimization purchases, particularly where software controls critical electricity, heating, gas, water, or digital infrastructure. The EU AI Act became broadly applicable on 2 August 2026, while certain high-risk critical-infrastructure requirements are scheduled from 2 December 2027. Penalties can reach €15 million or 3% of global annual turnover, rising to €35 million or 7% for the most serious infringements.
NIS2 also requires cybersecurity controls for energy-sector entities, with maximum fines for essential entities of at least €10 million or 2% of worldwide annual turnover. Eurostat reported that only 20.0% of EU enterprises used AI in 2025, ranging from 17.0% of small businesses to 55.0% of large enterprises. Compliance, cybersecurity, validation, and oversight requirements can therefore slow deployments, creating an estimated -1.3% CAGR pressure.
Challenges
| Challenge | (~) % CAGR | Geographic Relevance | Mitigation Horizon |
|---|---|---|---|
| Energy-AI Talent Scarcity | -1.1% | Global; strongest in mature digital economies | Long-term (4 years or more) |
| Legacy OT Protocol Fragmentation | -0.9% | Global industrial and utility brownfields | Long term (4 years or more) |
| Weather-Driven Model Drift | -0.7% | Global renewable-heavy grids | Medium term (2 to 4 years) |
| Edge-Cloud Reliability Gaps | -0.6% | Remote industrial sites, emerging markets | Medium term (2 to 4 years) |
| Critical Hardware Supply Tightness | -0.5% | North America, Europe, Asia | Medium term (2 to 4 years) |
| Cross-Site Data Quality | -0.4% | Global multi-site enterprises | Medium term (2 to 4 years) |
Energy-AI Talent Scarcity
The main operational challenge is the shortage of professionals who understand AI, electrical systems, building controls, and industrial operations. OECD data show that around 40% of non-AI-adopting employers in manufacturing and finance identify skills shortages as a key barrier. Eurostat also reported that 57.5% of EU enterprises recruiting ICT specialists in 2023 faced hiring difficulties, while only 20.05% employed ICT specialists in 2024.
The OECD further found that around 20% of medium-sized AI adopters struggled to find qualified candidates, while nearly 19% had difficulty defining required skills. At the same time, IEA data show AI-server power density increased 11-fold between 2020 and 2025, increasing energy-management complexity. These talent and technical gaps create an estimated -1.1% CAGR friction drag.
Opportunities
| Opportunity | (~) % CAGR | Geographic Relevance | Execution Window |
|---|---|---|---|
| Virtual Power Plant Orchestration | +1.2% | North America, Europe, Australia, Japan | Medium term (2 to 4 years) |
| Fleet Smart-Charging Platforms | +0.9% | China, Europe, North America, Southeast Asia | Medium term (2 to 4 years) |
| Industrial Process-Heat Optimization | +0.8% | Europe, China, North America, Japan | Long term (4 years or more) |
| Emerging-Market Microgrid AI | +0.6% | Southeast Asia, Africa, Latin America | Long term (4 years or more) |
| Carbon-Aware Compute Scheduling | +0.5% | North America, Europe, East Asia | Medium term (2 to 4 years) |
| Performance-Based Energy SaaS | +0.4% | Global commercial and industrial users | Medium term (2 to 4 years) |
Virtual Power Plant Orchestration
Virtual power plants remain a major future opportunity because distributed energy assets are growing faster than their coordinated participation in electricity markets. The U.S. Department of Energy reported about 33 GW of North American VPP capacity, with potential to reach 80–160 GW by 2030, equal to roughly 10–20% of peak demand. DOE also highlighted programs launched in under 6 months with less than USD 1 million in upfront investment that can deliver more than 100 MW of peak-load reduction.
FERC reported 33,272 MW of wholesale-market demand response in 2024, equal to around 6.5% of aggregate RTO/ISO peak demand. The IEA also recorded 108 GW of new battery-storage capacity in 2025, up 40%, expanding the pool of flexible assets available for AI-based coordination. This creates strong potential for multi-asset orchestration platforms and supports an estimated +1.2% CAGR upside.
Key Players Analysis
The AI for Energy Optimization Software Market is led by large automation and electrification groups with established building, grid, and industrial software platforms. Since companies do not disclose product-level AI energy-optimization revenue, the following shares are analyst estimates based on disclosed segment scale, installed footprint, and software breadth.
Tier-1 leaders are estimated to control around 55–65% collectively, led by Schneider Electric at approximately 12–15%, Siemens at 10–13%, Honeywell at 8–10%, GE Vernova at 7–9%, and ABB at 6–8%. Schneider Electric generated €33.1 billion from Energy Management in 2025, up 10.3% organically, while Siemens Smart Infrastructure produced €22.9 billion, including €4.8 billion from services.
Honeywell’s Building Automation business reached USD 7.37 billion in 2025, rising 13%, while company-wide R&D spending reached USD 1.8 billion, equal to 4.8% of sales. ABB generated USD 33.2 billion in revenue and invested USD 1.3 billion in R&D. GE Vernova reported USD 38.07 billion in revenue and plans USD 11 billion of CapEx and R&D investment during 2025–2028.
Competition is also intensifying through acquisitions and specialist platforms. Siemens completed its approximately USD 10 billion Altair acquisition, while Schneider acquired 75% of Motivair for USD 850 million.
Tier-2 challengers include Johnson Controls, Trane Technologies, IBM, Hitachi Energy, C3.ai, Envision Digital, Uplight, Stem, Enel X, Innowatts, Amperon, Emerald AI, Verdigris, and Grid4C.C3.ai spent USD 229.1 million on R&D against USD 250.3 million of FY2026 revenue, while Stem invested USD 35.3 million in R&D on USD 156.3 million revenue, showing the high innovation intensity among software-focused challengers.
Top Key Players in the Market
- GE Vernova
- Honeywell
- Hitachi Energy
- C3.ai
- Envision Digital
- Schneider Electric
- Siemens
- Uplight
- Stem, Inc.
- Enel X
- IBM
- Johnson Controls
- Trane Technologies
- Innowatts
- Amperon
- Emerald AI
- ABB
- Verdigris
- Grid4C
Recent Developments
- In 2025, ABB completed the acquisition of Sensorfact BV on February 3, with net cash outflow of USD 148 million. ABB initially announced the deal on January 21, when Sensorfact had more than 1,900 customers and over 250 employees. ABB’s 2025 Financial Report confirms that it acquired all shares of Sensorfact and incorporated its AI-based energy-management SaaS capabilities into the Electrification portfolio.
- In 2025, on February 28, Schneider Electric completed its acquisition of a 75% controlling interest in Motivair Corporation. Schneider Electric’s official half-year accounts confirm consideration of EUR 850 million, fully paid in cash at the acquisition date. The remaining 25% is expected to be acquired in 2028. Motivair was consolidated into Schneider Electric’s Energy Management segment, directly linking the transaction to data-center energy and thermal-management infrastructure.
Report Scope
| Report Features | Description |
|---|---|
| Market Value (2025) | USD 4.85 Billion |
| Forecast Revenue (2035) | USD 30.2 Billion |
| CAGR (2026-2035) | 20.1% |
| Base Year for Estimation | 2025 |
| Historic Period | 2020-2024 |
| Forecast Period | 2026-2035 |
| Report Coverage | Revenue Forecast, Market Dynamics, Competitive Landscape, Recent Developments |
| Segments Covered | By Component (Software, Services); By Deployment Mode (Cloud-Based, On-Premises, Hybrid); By Energy Source (Electricity, Natural Gas, Battery Energy Storage, Distributed Energy Resources, Hybrid Energy Systems, Solar Energy, Wind Energy, Hydropower); By AI Technology (Machine Learning, Deep Learning, Generative AI, Digital Twin & AI, Optimization Algorithms, Reinforcement Learning, Predictive Analytics, Natural Language Processing, Computer Vision); By Optimization Function (Energy Consumption Optimization, Renewable Energy Optimization, Energy Storage Optimization, Energy Trading Optimization, Demand Optimization, Load Forecasting, Peak Load Management, Energy Cost Optimization, Carbon Emission Optimization, Asset Performance Optimization); By End User (Utilities, Healthcare Facilities, Retail & Hospitality, Residential Buildings, Manufacturing, Commercial Buildings, Industrial Facilities, Data Centers, Transportation & Mobility, Other End Users); By Application (Energy Consumption and Demand Optimization, Asset Performance and Predictive Maintenance, Industrial Energy Optimization, Data Center Energy Optimization, Energy Storage Management, Smart Grid and DER Management, Renewable Energy Forecasting and Integration, Energy Trading, Pricing and Market Intelligence, Building Energy Optimization, Carbon and Sustainability Management); By Solution Type (Energy Analytics & Monitoring, Predictive Maintenance, Renewable Energy Management, AI Energy Forecasting, Automated Energy Control, Demand Response Optimization, Energy Management & Reporting, AI-Based Energy Trading, Energy Storage Optimization, Carbon Management); By Facility Type (Office Buildings, Retail & Shopping Centers, Manufacturing Plants, Hotels, Hospitals, Educational Institutions, Warehouses and Logistics Centers, Data Centers, Airports & Transportation Facilities, Other Facilities); By Organization Size (Small and Medium Enterprises, Large Enterprises, Government and Public Sector) |
| Regional Analysis | North America – US, Canada; Europe – Germany, France, The UK, Spain, Italy, Rest of Europe; Asia Pacific – China, Japan, South Korea, India, Australia, Singapore, Rest of APAC; Latin America – Brazil, Mexico, Rest of Latin America; Middle East & Africa – GCC, South Africa, Rest of MEA |
| Competitive Landscape | GE Vernova, Honeywell, Hitachi Energy, C3.ai, Envision Digital, Schneider Electric, Siemens, Uplight, Stem, Inc., Enel X, IBM, Johnson Controls, Trane Technologies, Innowatts, Amperon, Emerald AI, ABB, Verdigris, Grid4C |
| Customization Scope | Customization for segments, region/country-level will be provided. Moreover, additional customization can be done based on the requirements. |
| Purchase Options | We have three licenses to opt for: Single User License, Multi-User License (Up to 5 Users), Corporate Use License (Unlimited Users and Printable PDF) |





























