


Report Overview
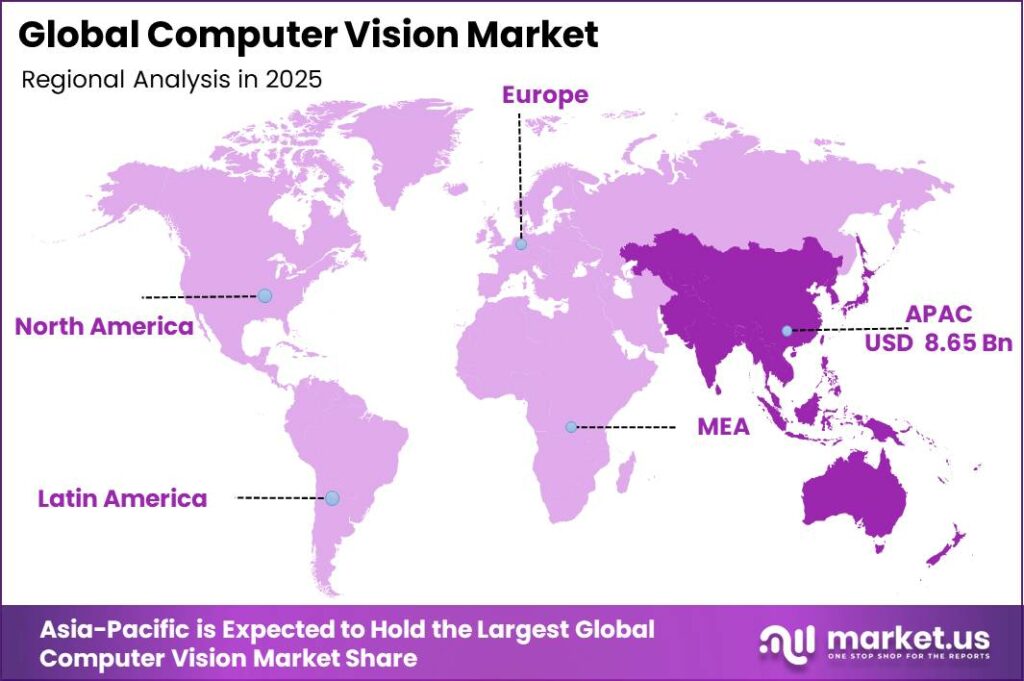
The Global Computer Vision Market is projected to grow from USD 20.4 billion in 2025 to approximately USD 110.6 billion by 2035, expanding at a CAGR of 18.4% during 2026–2035. Asia-Pacific remains the major growth hub, accounting for around USD 8.65 billion and a 42.45% share in 2025
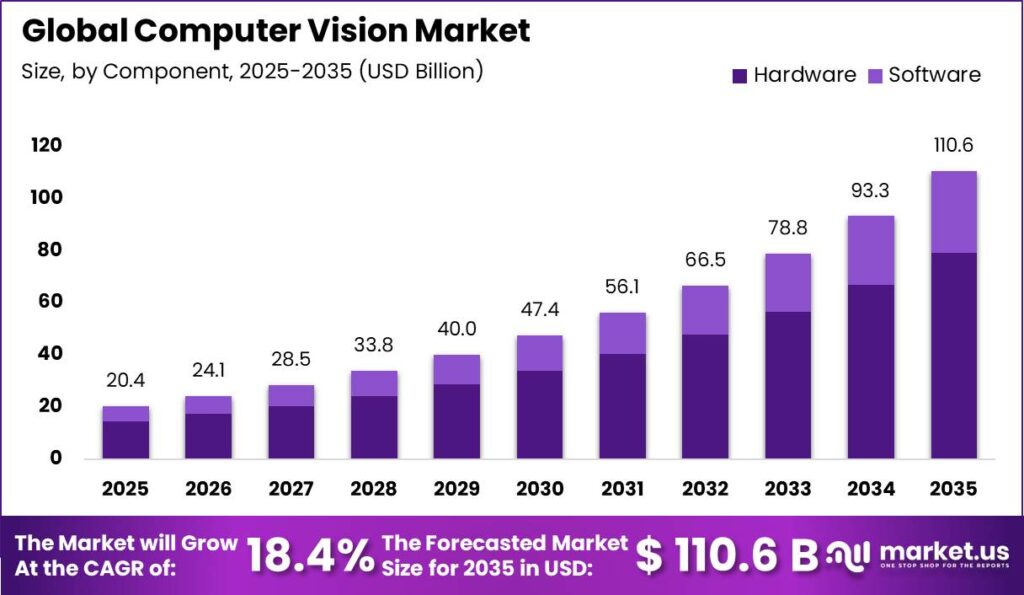
This growth is driven by measurable expansion across automotive, robotics, manufacturing, and healthcare sectors, where computer vision enables automation, precision, quality control, and intelligent decision-making. Asia Pacific growth is supported by its strong manufacturing base and rapid adoption of advanced automation technologies.
According to the International Organization of Motor Vehicle Manufacturers (OICA), global vehicle production increased from 92.7 million units in 2024 to 96.4 million units in 2025, while global sales reached 99.8 million units. Asia-Oceania contributed significantly to this growth, with vehicle production rising by approximately 7–8%. The expansion of automotive manufacturing directly increases demand for computer vision systems used in assembly inspection, paint monitoring, defect detection, and final quality assurance processes.
The International Federation of Robotics (IFR) reported 542,000 industrial robots installed worldwide in 2024, with more than 4.664 million robots operating globally. As factories increasingly adopt robotics and Industry 4.0 solutions, computer vision has become essential for robotic guidance, component recognition, automated inspection, and safe human-machine interaction, accelerating demand across industrial applications.
Key Takeaway
- The Global Computer Vision Market was valued at USD 20.4 billion in 2025 and is projected to reach USD 110.6 billion by 2035, growing at a CAGR of 18.4% during 2026-2035.
- By Component, Hardware dominated the global computer vision market with a 71.67% share in 2025
- By Application, Quality Assurance & Inspection led the market with a 26.32% share in 2025
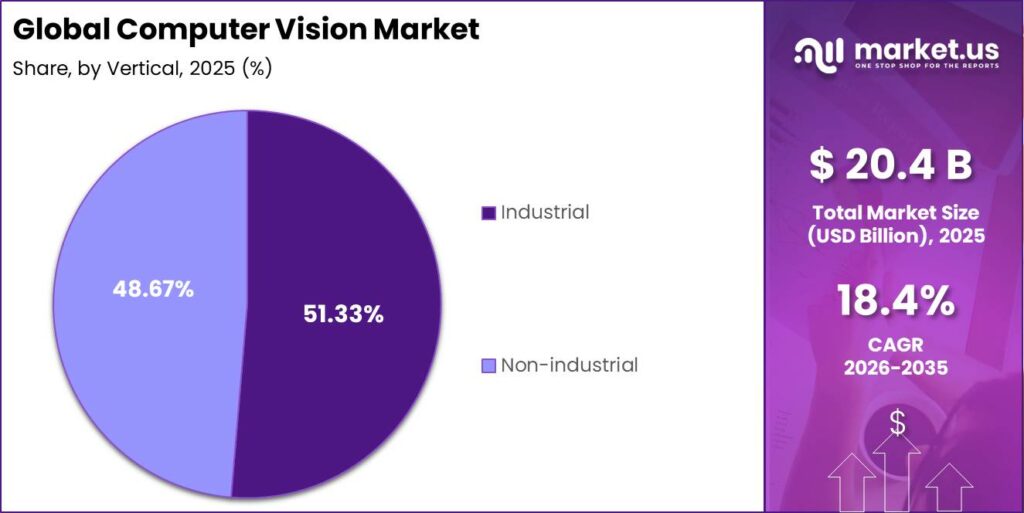
- By Vertical, the Industrial segment dominated the computer vision market with a 51.33% share in 2025,
- Asia-Pacific dominated the global computer vision market with a 42.45% share in 2025
Component Analysis
The Hardware deployment segment accounts for approximately 71.67% of the global Computer Vision Market Component, reflecting its critical role in supporting the growing demand for data-intensive vision infrastructure. The increasing volume of digital data requires high-performance cameras, sensors, processors, and edge servers to deliver low-latency processing and reliable performance across applications.
In 2024, global mobile broadband traffic was expected to reach around 1.3 zettabytes, while fixed broadband traffic approached 6 zettabytes, highlighting the need for advanced hardware architectures capable of handling large-scale data processing. At major internet exchanges such as DE-CIX, more than 3,400 networks exchanged 68 exabytes of traffic in 2024, emphasizing the importance of robust networking and optical infrastructure for distributed vision workloads.
Additionally, U.S. broadband providers invested USD 89.6 billion in communications infrastructure in 2024, with network assets typically operating over 7-10-year lifecycles. This long-term infrastructure investment supports continued computer vision adoption across sectors such as telecom, utilities, and public safety, helping maintain the Hardware segment’s dominant market position.
Application Analysis
Quality Assurance & Inspection holds a dominant 26.32% share of global computer vision applications due to its essential role in defect detection, safety checks, and regulatory compliance. World Bank data shows global manufacturing value added exceeds USD 16 trillion annually, creating strong demand for automated inspection systems.
In the automotive industry, OICA reports around 80–92 million vehicles are produced annually, with each vehicle requiring inspection of hundreds of components. Computer vision-based quality systems help reduce defects, recalls, and warranty costs, making QA & Inspection the largest and most established application segment.
Positioning & Guidance is the fastest-growing computer vision application segment, driven by increasing adoption of industrial robots, autonomous mobile robots, and smart machines. IFR reported over 276,000 industrial robots installed in 2023, with vision systems enabling navigation, collision avoidance, and precise operations.
Vertical Analysis
Industrial computer vision accounts for around 51.33% of global computer vision market revenues across verticals, making it the leading segment. Its dominance is supported by demand for large-scale manufacturing and automation, with UNIDO and World Bank data showing that manufacturing value added accounts for a significant share of global GDP, generating trillions of dollars in annual output that requires inspection, measurement, and tracking.
In 2024, the International Federation of Robotics reported approximately 4.7 million industrial robots operating worldwide and nearly 540,000 new robot installations in a single year, with Asia leading deployments. Each robotic cell and automated production line uses multiple cameras and vision modules for quality inspection, guidance, and safety, increasing computer vision adoption across factories.
Non-industrial verticals such as retail, e-commerce, healthcare, mobility, and smart cities are the fastest-growing areas due to rising digital activity and the generation of visual data. UNCTAD estimates global e-commerce reached USD 26.7 trillion, including nearly USD 21.8 trillion in B2B transactions, while online retail penetration increased from 16% to 19%, driving demand for AI-enabled camera-based solutions.
Key Market Segments
- Component
- Hardware
- Cameras
- Frame Grabbers
- Optics
- LED Lighting
- Processors
- Software
- Hardware
- Application
- Quality Assurance & Inspection
- Positioning & Guidance
- Measurement
- Identification
- Predictive Maintenance
- 3D Visualization & Interactive 3D Imaging Modelling
- Vertical
- Industrial
- Automotive
- Pharmaceuticals
- Electronics & Semiconductor
- Food & Packaging
- Wood and Paper
- Printing
- Machinery
- Others
- Non-industrial
- Healthcare
- Consumer Electronics
- Security & Surveillance
- Retail
- Sports and Entertainment
- Autonomous and Semi-autonomous Vehicles
- Others
- Industrial
Market Dynamics
Drivers
| Driver | (~) % Impact on CAGR | Geographic Relevance | Impact Timeline |
|---|---|---|---|
| Generative AI & Multimodal Model Integration | +3.8% | Global, concentrated in North America, East Asia | Short term (≤ 2 years) |
| Industrial Automation & Smart Manufacturing Adoption | +2.9% | Global, led by China, Germany, South Korea, Japan | Short term (≤ 2 years) |
| ADAS & Autonomous Vehicle Vision Stack Expansion | +2.4% | North America, Europe, China | Medium term (2-4 years) |
| AI-Powered Medical Imaging & Diagnostic Deployment | +2.1% | North America, Europe, Japan, South Korea | Medium term (2-4 years) |
| Smart City Surveillance & Public Safety Infrastructure | +1.6% | Asia-Pacific (India, China), Middle East, Southeast Asia | Short term (≤ 2 years) |
| Edge AI Hardware Cost Deflation Enabling Mass Deployment | +1.3% | Global, strongest in cost-sensitive emerging markets | Medium term (2-4 years) |
Generative AI & Multimodal Model Integration
The fusion of large vision-language models, such as GPT-4o-class architectures and Gemini 2.5 Pro with its 1-million-token context window natively handling text, images, audio, and video simultaneously, has structurally shifted computer vision from a narrow, task-specific inference tool into an open-world reasoning platform, compressing development cycles and expanding addressable deployment contexts.
The multimodal AI segment, valued at approximately $2.83 billion in 2026, is expanding at a CAGR of 30.6%, pulling computer vision workloads with it as vision encoding becomes a mandatory component of every frontier model pipeline.
Restraints
| Restraint | (~) % Impact on CAGR | Geographic Relevance | Impact Timeline |
|---|---|---|---|
| EU AI Act High-Risk Classification & Biometric Surveillance Bans | -2.6% | European Union, 27 member states, binding | Short term (≤ 2 years) |
| GDPR Visual Data Processing Constraints | -1.8% | Europe, UK; ripple effect in PDPA-adopting Asia markets | Short term (≤ 2 years) |
| Advanced AI Chip Export Controls & Geopolitical Supply Restrictions | -1.5% | China, Russia, select Middle East markets | Short term (≤ 2 years) |
| High On-Premise GPU Infrastructure CapEx Barrier | -1.2% | Global, disproportionate in mid-market & emerging economies | Medium term (2-4 years) |
| Fragmented Liability & Certification Standards Across Jurisdictions | -0.9% | Cross-border deployments in EU, ASEAN, Latin America | Medium term (2-4 years) |
EU AI Act High-Risk Classification & Biometric Surveillance Bans
The EU AI Act (Regulation 2024/1689), the world’s first comprehensive AI regulation, banned prohibited AI practices, including mass biometric surveillance, untargeted facial image scraping from CCTV or the internet to build recognition databases, and emotion recognition in workplaces and schools, effective 2 February 2025, with full application of high-risk system obligations across all 27 EU member states from 2 August 2026.
Computer vision systems deployed in security, access control, critical infrastructure, and human resources contexts are directly classified as high-risk, GDPR-aligned Data Protection Impact Assessments, continuous human oversight mechanisms, and technical documentation burdens that collectively impose compliance costs estimated at €30,000-€300,000 per system depending on organizational scale and risk tier.
Non-compliance penalties reach up to EUR 35 million or 7% of global annual turnover, whichever is higher, creating a commercially prohibitive deterrent that is already causing European enterprises to delay, redesign, or outright cancel planned deployments of public-space and workplace vision systems, directly compressing near-term revenue capture in one of the market’s highest-ASP verticals.
Challenges
| Challenge | (~) % CAGR | Geographic Relevance | Mitigation Horizon |
|---|---|---|---|
| Training Data Annotation Cost Burden | -2.2% | Global, acute in long-tail industrial verticals | Medium term (2-4 years) |
| Specialized CV Talent Scarcity | -1.9% | Global, severe in India, Southeast Asia, Latin America | Long term (≥ 4 years) |
| Advanced GPU Semiconductor Supply Constraints | -1.4% | Global, critical path through TSMC, Samsung fabs | Medium term (2-4 years) |
| Model Interpretability & Reliability in Mission-Critical Use | -1.1% | Global, regulatory-sensitive: healthcare, automotive, defense | Long term (≥ 4 years) |
| Legacy System Integration Complexity | -0.8% | Global, concentrated in heavy manufacturing, utilities | Medium term (2-4 years) |
| Cybersecurity Vulnerabilities in Vision Pipelines | -0.6% | Global, highest exposure in critical infrastructure deployments | Long term (≥ 4 years) |
Training Data Annotation Cost Burden
Data annotation remains a major cost and scalability challenge in computer vision development, often accounting for 50–80% of total project budgets. Costs increase further for specialized datasets requiring expert labeling, such as industrial defects, medical images, and complex traffic scenarios. Bounding-box annotation can cost around USD 0.02 per object, while time-based workflows average USD 6 per annotator-hour, creating significant barriers for large-scale AI model development.
Although auto-labeling pipelines grounded in vision-language models now demonstrate cost reduction potential of up to 100,000× for large, well-represented datasets, this efficiency breakthrough does not yet extend reliably to the long-tail, rare-event, and fine-grained industrial defect categories that constitute the highest-value commercial contracts in manufacturing quality inspection.
Opportunities
| Opportunity | (~) % Potential CAGR | Geographic Relevance | Execution Window |
|---|---|---|---|
| Predictive Maintenance Vision in Industrial IoT | +2.7% | Global, highest ROI in North America, Germany, Japan | Medium term (2-4 years) |
| Agentic Vision AI in Retail & Autonomous Commerce | +2.3% | North America, China, UK, India | Medium term (2-4 years) |
| Agricultural Precision Monitoring & Crop Intelligence | +1.8% | India, Brazil, Sub-Saharan Africa, Southeast Asia | Long term (≥ 4 years) |
| Federated & Privacy-Preserving Vision for Regulated Sectors | +1.5% | Europe, North America, Japan, healthcare & finance verticals | Long term (≥ 4 years) |
| Vision-as-a-Service Monetization for SME Markets | +1.2% | Global, Southeast Asia, India, Latin America most underpenetrated | Short term (≤ 2 years) |
| 3D Spatial Vision for AR/VR & Digital Twin Platforms | +1.0% | North America, East Asia, Europe | Long term (≥ 4 years) |
Predictive Maintenance Vision in Industrial IoT
Industrial computer vision has largely focused on reactive quality inspection during 2024–2025, detecting defects after production rather than enabling real-time equipment health monitoring. This leaves predictive maintenance as a major untapped opportunity requiring investment in multi-sensor fusion architectures, edge inference hardware, and long-duration baseline model training, which many manufacturers have yet to fund.
AI-based predictive maintenance solutions can reduce unplanned downtime by up to 50% and lower maintenance costs by 20–30%, while only a limited share of industrial facilities currently operate vision-enabled predictive maintenance platforms. This creates a significant global opportunity for vendors to expand computer vision beyond inspection into continuous asset monitoring.
To capture this opportunity, vendors are shifting from one-time hardware-based sales toward multi-year software subscription models covering model retraining, alert threshold calibration, and CMMS platform integration. This transition can move margins from the typical 30–40% gross margin range of hardware-bundled vision systems toward the 65–80% gross margin profile of industrial SaaS platforms, increasing revenue per deployed sensor node over the contract lifecycle.
Geopolitical Impact Analysis
Geopolitical disruptions are reshaping the global computer vision supply chain by increasing costs and extending delivery timelines for semiconductors, image sensors, and complete vision systems. According to UNCTAD’s 2024 analysis, container capacity through the Suez Canal declined by more than 50% by mid-2024, while rerouted cargo around Africa increased by nearly 90%.
Freight rates from Shanghai increased by 122% overall, while Shanghai-Europe shipping rates surged by 256% between December 2023 and February 2024. For computer vision manufacturers transporting camera modules, industrial vision systems, and embedded AI servers, these higher logistics costs can raise landed costs by around 8-15%, directly impacting system pricing.
Trade restrictions are adding further pressure on semiconductor-based computer vision components. Global average tariffs remain around 5.6%, but targeted tariffs on strategic goods such as semiconductors and critical materials have increased toward 25-50% levels. Since silicon-based electronics account for approximately 40-50% of bill-of-material costs in industrial vision systems, a 10-20% rise in wafer and freight costs can increase final system prices by around 6-10%.
Regional Analysis
Asia-Pacific leads the global computer vision market, accounting for approximately 42.45% share and generating around USD 8.65 billion in revenue. The region’s growth is driven by rapid industrial automation, AI adoption, and increasing use of computer vision in manufacturing, automotive, healthcare, retail, and smart city applications. China, Japan, South Korea, and India are key contributors due to strong electronics manufacturing ecosystems and AI investments.
The region is also the fastest-growing market, supported by expanding 5G networks, digital transformation initiatives, and Industry 4.0 programs. Government support for AI development and smart infrastructure projects is accelerating the adoption of vision-based automation and analytics solutions.
Rising e-commerce activity, enhanced security requirements, and advancements in deep learning are expected to further strengthen demand. Asia-Pacific is projected to maintain its leadership position while continuing to be a major growth center for the global computer vision market.
Key Regions and Countries
North America
- US
- Canada
Europe
- Germany
- France
- The UK
- Spain
- Italy
- Rest of Europe
Asia Pacific
- China
- Japan
- South Korea
- India
- Australia
- Rest of APAC
Latin America
- Brazil
- Mexico
- Rest of Latin America
Middle East & Africa
- GCC
- South Africa
- Rest of MEA
Key Players Analysis
The global computer vision market is led by a small group of Tier-1 players with strong positions in AI computing, cloud platforms, and industrial automation. NVIDIA, Microsoft, Keyence, and OMRON are key companies shaping the market’s technology ecosystem.
NVIDIA reported USD 215.9 billion in fiscal 2026 revenue, with Data Center revenue increasing 68% year-on-year, highlighting its role as a core AI computing provider. Microsoft generated USD 81.3 billion in Q2 FY2026 revenue, including more than USD 51 billion from Microsoft Cloud. Keyence and OMRON further strengthen the industrial vision segment with FY2025 sales of ¥1,059,145 million and ¥767.4 billion, respectively.
Tier-2 companies such as Cognex, Basler, and Teledyne focus on specialized machine vision systems, smart cameras, and industrial inspection solutions. Cognex reported approximately USD 994 million in 2025 revenue, while Basler recorded €224.5 million in audited 2025 sales, reflecting strong niche positions but a smaller scale compared with Tier-1 players. Overall, Tier-1 companies are estimated to capture around 45%-55% of market value, while Tier-2 specialists account for approximately 20%-30%.
Top Key Players in the Market
- Amazon Web Services, Inc.
- Basler AG
- Cognex Corporation
- Intel Corporation
- Microsoft
- NVIDIA Corporation
- Omron Corporation
- Qualcomm Technologies, Inc.
- Teledyne Vision Solutions
- Jai A/S
- Mediatek
- Tordivel As
- Other Key Players
Recent Developments
- In February 2026, Teledyne Technologies completed multiple vision and optics acquisitions worth approximately USD 57.9 million in cash, strengthening its high-precision imaging and optical systems capabilities.
- In February 2025, Teledyne Technologies acquired selected aerospace and defense electronics businesses from Excelitas Technologies, including Qioptiq optical systems, for approximately USD 710 million to expand its imaging and optical technology portfolio.
Report Scope
| Report Features | Description |
|---|---|
| Market Value (2025) | USD 20.4 Billion |
| Forecast Revenue (2035) | USD 110.6 Billion |
| CAGR (2026-2035) | 18.4% |
| Base Year for Estimation | 2025 |
| Historic Period | 2020-2024 |
| Forecast Period | 2026-2035 |
| Report Coverage | Revenue Forecast, Market Dynamics, Competitive Landscape, Recent Developments |
| Segments Covered | By Component (Hardware, Software), By Hardware Type (Cameras, Frame Grabbers, Optics, LED Lighting, Processors), By Application (Quality Assurance & Inspection, Positioning & Guidance, Measurement, Identification, Predictive Maintenance, 3D Visualization & Interactive 3D Imaging Modelling), By Vertical (Industrial, Non-Industrial) |
| Regional Analysis | North America – US, Canada; Europe – Germany, France, The UK, Spain, Italy, Rest of Europe; Asia Pacific – China, Japan, South Korea, India, Australia, Singapore, Rest of APAC; Latin America – Brazil, Mexico, Rest of Latin America; Middle East & Africa – GCC, South Africa, Rest of MEA |
| Competitive Landscape | Amazon Web Services, Inc., Basler AG, Cognex Corporation, Google, Intel Corporation, Microsoft, NVIDIA Corporation, Omron Corporation, Qualcomm Technologies, Inc., Teledyne Vision Solutions, JAI A/S, MediaTek, Tordivel AS, Other Key Players |
| Customization Scope | Customization for segments and region/country-level will be provided. Moreover, additional customization can be done based on the requirements. |
| Purchase Options | We have three licenses to opt for: Single User License, Multi-User License (Up to 5 Users), Corporate Use License (Unlimited Users and Printable PDF) |





























