


Report Overview
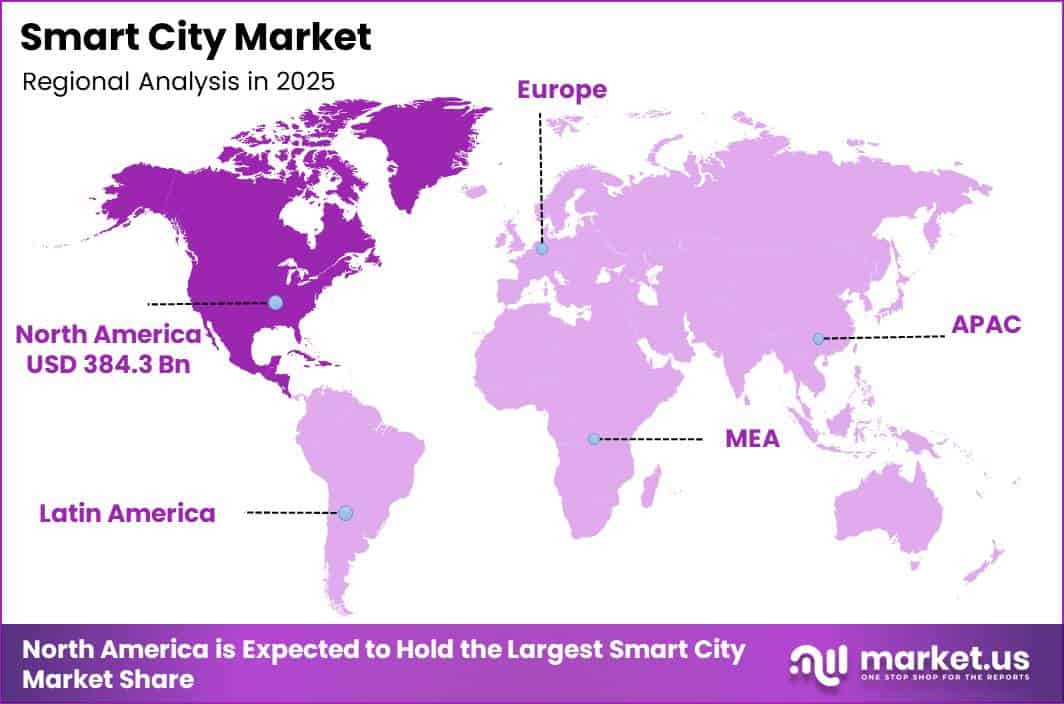
In 2025, the Global Smart City Market was valued at USD 1.4 trillion. The market is projected to grow at a CAGR of 21.6% during 2026–2035, reaching approximately USD 10.2 trillion by 2035. North America dominated the global market in 2025, accounting for more than 22.0% of the total market share and generating approximately USD 384.3 billion in revenue.
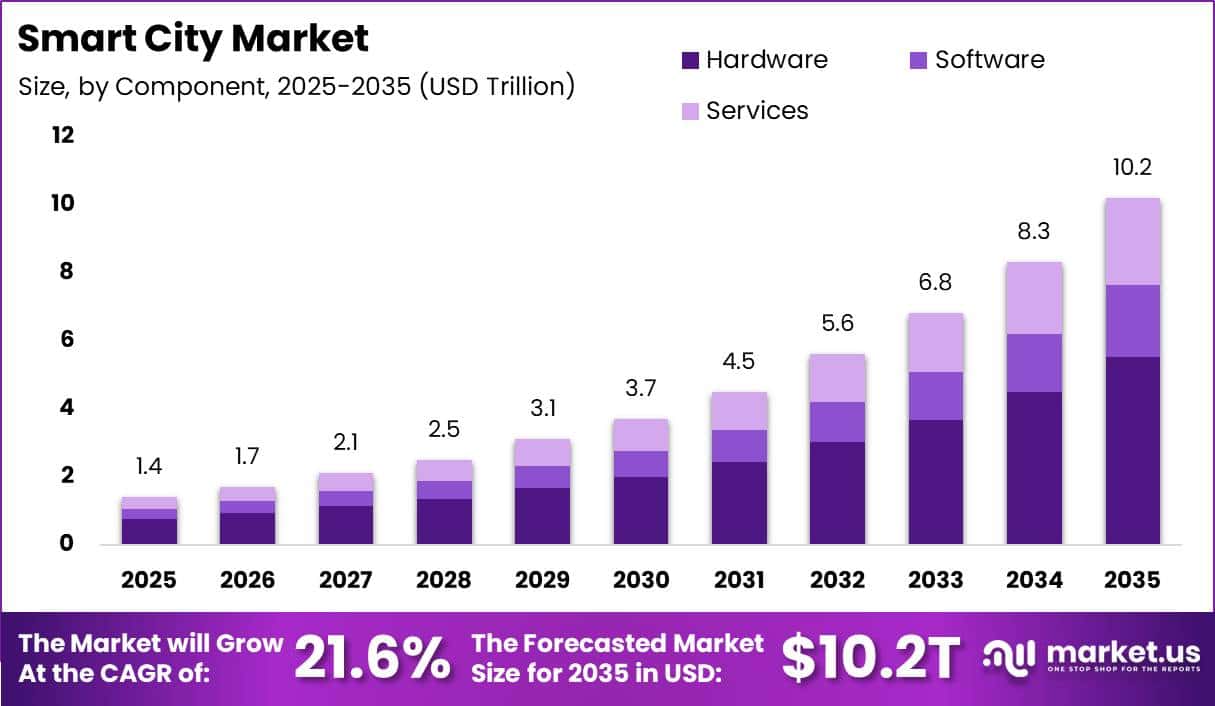
Growth is mainly supported by rapid urbanization, rising infrastructure spending, and stronger government focus on digital public services. In 2018, UN DESA reported that 55% of the global population lived in urban areas and estimated that this share would rise to 68% by 2050. This shift will add nearly 2.5 billion urban residents, mainly across Asia and Africa, creating significant demand for modern transport, energy, water, waste management, housing, and public safety systems.
Urban infrastructure investment is also increasing rapidly. Annual physical capital investment in cities was expected to rise from around USD 10 trillion to more than USD 20 trillion by 2025. Total urban infrastructure requirements, including buildings, utilities, and transport networks, are estimated at approximately USD 80–97 trillion by 2040. If only 10–15% of this spending is directed toward connected and intelligent systems, the smart city market could reasonably exceed USD 10 trillion by 2035.
North America is supported by early adoption of 5G, IoT, smart grids, and data-based city management. Urbanization in several advanced economies is expected to exceed 80% by 2050, while infrastructure spending commonly represents 2–6% of GDP. As the global urban population increases from 4.2 billion to approximately 6.7 billion by 2050, demand for smart mobility, utilities, governance, and public services will continue to strengthen.
Key Takeaway
- The Smart City Market reached USD 1.4 trillion and is projected to grow at a 21.6% CAGR to approximately USD 10.2 trillion by 2035.
- Smart utilities dominated the application segment with a 29.5% share, supported by rising investment in electricity, water, and waste infrastructure.
- Hardware captured a leading 54% share, driven by demand for sensors, cameras, smart meters, controllers, and communication equipment.
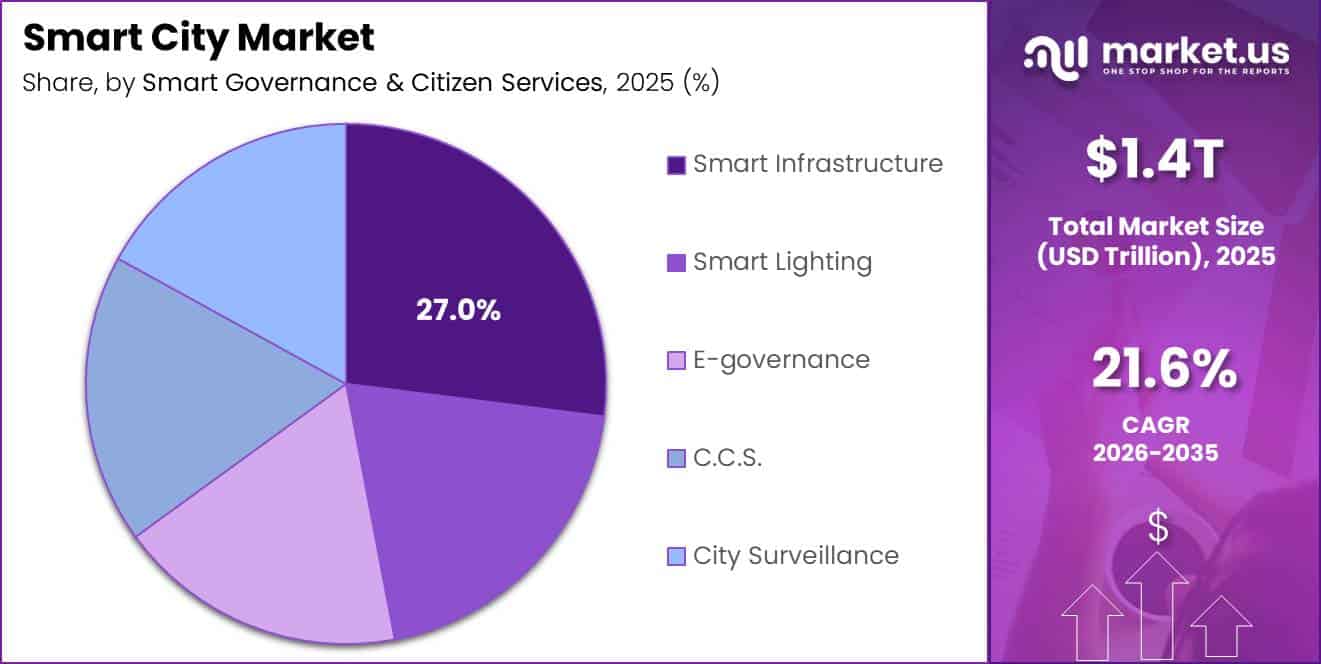
- Smart infrastructure accounted for a dominant 27% share of smart governance and citizen services.
- Energy management led smart utilities with a 28% share, supported by demand control, loss reduction, and renewable energy integration.
- Intelligent transportation systems held a leading 30% share, driven by congestion management and real-time traffic monitoring.
- Medical devices dominated smart healthcare with a 55.5% share, reflecting strong demand across hospitals, clinics, ambulances, and homes.
- Government and municipal bodies represented the largest end-user group with a 48% share of total smart city demand.
- North America led the market in 2025 with more than a 22.0% share, generating nearly USD 384.3 billion in revenue.
By Application
Smart utilities held the leading 29.5% share, as cities depend on reliable electricity, water, and waste services. In 2024, global electricity access reached about 92%, but 655 million people still lacked power, while 2.1 billion lacked safely managed drinking water and 3.4 billion lacked safely managed sanitation. These gaps are encouraging governments to invest in smart grids, digital water networks, automated controls, and metering.
WHO and UNICEF data show that safely managed sanitation coverage increased from 48% in 2015 to around 58–59% in 2024, helping more than 900 million people gain improved services. Smart meter deployments are expected to reach nearly 3.9 billion units worldwide by 2035, supporting demand for sensors, analytics, and utility management platforms.
Smart public safety is the fastest-growing device segment as urban density increases exposure to crime, road accidents, disasters, and health emergencies. More than 55% of the global population lives in urban areas, while public order and safety spending can represent 1–2% of GDP in some high-income economies.
By Component
Hardware held a leading 54% share of the smart city component market because every digital urban service depends on physical equipment such as sensors, cameras, smart meters, controllers, and communication devices. According to the International Energy Agency, hundreds of millions of residential smart meters had already been installed worldwide by 2021, with deployment programs continuing across major economies.
Software is the fastest-growing smart city component because cities increasingly use data, automation, and artificial intelligence to improve the performance of existing infrastructure. As the number of connected sensors and meters reaches billions, municipalities require advanced platforms to process information and support real-time decisions. Software enables predictive maintenance, dynamic pricing, traffic optimization, and digital citizen services without replacing installed hardware.
By Smart Governance & Citizen Services
Smart infrastructure held the leading 27% share of the smart governance and citizen services segment because it supports urban mobility, public facilities, utilities, and access to essential services. Global infrastructure investment requirements are estimated at nearly USD 94 trillion between 2016 and 2040, with around 56% associated with urban areas.
Smart lighting is the fastest-growing device segment because streetlights are widely installed, energy-intensive, and relatively easy to modernize. Outdoor lighting can represent around 10–20% of municipal electricity consumption, while large cities may operate hundreds of thousands of lighting units. Replacing conventional lamps with LEDs and connected controllers can reduce energy use by up to 50–70%.
By Smart Utilities
Energy management held the leading 28% share of smart utilities because cities consume large amounts of electricity and require better control over demand, losses, and renewable energy integration. Cities account for around 75% of global energy use and nearly 70% of greenhouse gas emissions, while buildings and industries consume more than 90% of global electricity.
In 2019, worldwide final electricity consumption reached approximately 22,848 TWh. Electricity’s share of final energy demand is expected to rise from about 20% today to more than 50% by 2050 under net-zero scenarios. Smart meters, demand-response tools, and building energy platforms help utilities monitor millions of connections, forecast peak demand, and shift loads automatically.
Waste management is the fastest-growing smart utility segment as global waste volumes continue to increase. Municipal solid waste generation reached about 2.6 billion tonnes in 2022 and could rise by 50% to 3.8 billion tonnes by 2050. Waste volumes may increase by more than 90–120% across Sub-Saharan Africa and South Asia.
Cities are therefore adopting smart bins, digital tracking, and route-optimization systems. With urban waste expected to increase by over 1 billion tonnes between 2022 and 2050, demand for connected waste-monitoring devices will expand rapidly.
By Smart Transportation
Intelligent transportation systems held the leading 30% share of smart transportation because growing vehicle fleets and traffic congestion require real-time monitoring and control. Global motor vehicle production exceeded 90 million units in 2023, supporting more than 1.4 billion vehicles in use worldwide. Private cars account for over half of urban passenger-kilometres, generate around 75% of urban passenger transport emissions, and receive more than 95% of road space in many cities.
Severe congestion can cost economies up to 1% of GDP, while commuters in major U.S. and European cities lose dozens of hours each year in traffic. Adaptive signals, connected public transport, centralized control centres, and incident-management systems improve traffic flow. Even modest reductions in delays across millions of daily journeys can generate billions of dollars in economic and fuel savings.
Parking management is the fastest-growing device segment because inefficient parking increases congestion, emissions, and pressure on valuable urban land. In many low- and middle-income cities, over 95% of road space, including on-street parking, is allocated to private vehicles. Smart parking sensors, connected meters, digital payments, dynamic pricing, and guidance applications provide real-time space information.
By Smart Healthcare
Medical devices held the leading 55.5% share of smart healthcare because diagnosis, monitoring, and treatment depend on physical equipment used in hospitals, clinics, ambulances, and homes. Global health spending reached USD 9.8 trillion in 2021, equal to 10.3% of world GDP, while governments contributed more than USD 6.2 trillion. A major part of healthcare capital spending supports imaging systems, ventilators, infusion pumps, surgical equipment, and bedside monitors.
In high-income countries, average healthcare expenditure is around USD 4,000 per person each year. Population ageing and urban growth are increasing demand for connected devices that provide real-time monitoring, automated alerts, and remote diagnosis. These systems improve patient safety, staff productivity, and treatment capacity, supporting continued investment in medical hardware.
Systems and software are the fastest-growing smart healthcare segment because they convert data from millions of medical devices and patient interactions into useful clinical information. Healthcare represents around 10% of global GDP, and a rising portion is being directed toward electronic health records, telemedicine, analytics, and clinical decision-support tools.
By End-User
Government and municipal bodies held the leading 48% share of smart city end-user demand because they manage essential urban services and control major infrastructure and technology budgets. Global infrastructure investment requirements are estimated at around USD 94 trillion between 2016 and 2040, with more than 50% linked to transport, energy, water, and public facilities.
In the United States, public infrastructure spending reached approximately USD 625.8 billion in 2023, and nearly 80% was funded by state and local governments. These authorities purchase and operate smart traffic systems, connected lighting, public safety networks, digital utilities, and citizen-service platforms.
Transportation and logistics operators are the fastest-growing smart city end-user segment because rising passenger and freight volumes require better real-time coordination. E-commerce growth, rapid deliveries, and expanding city populations are placing greater pressure on roads, depots, and curb space.
Key Market Segments
By Application
- Smart Governance
- Smart Building
- Environmental Solution
- Smart Utilities
- Smart Transportation
- Smart Healthcare
- Smart Public Safety
- Smart Security
- Smart Education
- Smart Mobility Management
- Other Solutions
By Component
- Hardware
- Software
- Services
By Smart Governance & Citizen Services
- City Surveillance
- C.C.S.
- E-governance
- Smart Lighting
- Smart Infrastructure
By Smart Utilities
- Energy Management
- Water Management
- Waste Management
- Meter Data Management
- Distribution Management System
- Substation Automation
- Other Smart Utilities Solutions
By Smart Transportation
- Intelligent Transportation System
- Parking Management
- Smart Ticketing & Travel Assistance
- Traffic Management
- Passenger Information
- Connected Logistics
- Other Smart Transportation Solutions
By Smart Healthcare
- Medical Devices
- Systems & Software
By End-User
- Government and Municipal
- Residential
- Commercial and Industrial
- Transportation and Logistics Operators
- Utilities Providers
- Other End-User
Geopolitical Impact Analysis
Geopolitical tensions are significantly affecting the cost and delivery schedules of important smart city equipment, including IoT devices, grid systems, smart lighting, surveillance cameras, sensors, and networking products. Tariff measures tracked by the WTO and IMF show that effective duties on several information and communication technology goods have increased to around 10–25% under Section 301 and related trade actions. These tariffs directly raise the import cost of semiconductors, sensors, and communication equipment used in connected urban infrastructure.
Critical mineral supply risks are also creating uncertainty. The International Energy Agency reported that lithium prices increased by nearly eightfold during 2021–2022 before falling by more than 80% after 2023. Prices for graphite, cobalt, and nickel declined by around 10–20% in 2024 from earlier peaks. Such volatility makes pricing and capital planning more difficult for electric-bus fleets, energy storage projects, smart grids, and backup power systems.
Shipping disruptions are adding further pressure. According to UNCTAD, the Red Sea crisis forced many vessels operating between Asia and Europe to travel around the Cape of Good Hope. This diversion added approximately 12 sailing days, increased transit times by nearly 30%, and reduced effective global container capacity by an estimated 9%. Container rates on the Shanghai–Rotterdam route doubled, while prices on the Shanghai–Genoa route increased by 350% between 1 December and 1 February.
For smart city projects dependent on Asian electronics, cameras, and LED equipment, these conditions can increase landed hardware costs by 15–30% and extend project schedules by several weeks. Municipalities and system integrators are therefore adopting nearshoring, multi-sourcing, and phased deployment strategies to control budget and delivery risks.
Regional Analysis
North America held the leading position in the global smart city market in 2025, accounting for an estimated 22.0% share and approximately USD 384.3 billion in revenue. Its strong position is supported by early investment in smart utilities, public safety, intelligent transportation, and digital government services across the United States and Canada.
Advanced ICT networks, broad 5G deployment, strong municipal spending, and high adoption of cloud platforms support the installation of connected streetlights, smart grids, traffic control systems, sensors, and city data platforms. Government programs focused on lower emissions, climate resilience, and improved public services are also increasing investment in connected urban infrastructure.
Asia Pacific is the fastest-growing region due to rapid urbanization, large infrastructure programs, and expanding digital investment. China, India, Southeast Asia, Japan, and South Korea are increasing spending on smart transport corridors, integrated command centres, utility modernization, and digital public services. Hundreds of millions of people are expected to move into urban areas over the coming decade, creating strong demand for new city infrastructure.
Europe represents another important regional market. Growth is supported by strict climate regulations, energy-efficiency goals, established public transport systems, and continued investment in smart ticketing, real-time transport management, digital utilities, and urban innovation. Funding from European Union programs and national governments is encouraging steady adoption, particularly across Western and Northern Europe.
Key Regions and Countries
North America
- US
- Canada
Europe
- Germany
- France
- The UK
- Spain
- Italy
- Rest of Europe
Asia Pacific
- China
- Japan
- South Korea
- India
- Australia
- Rest of APAC
Latin America
- Brazil
- Mexico
- Rest of Latin America
Middle East & Africa
- GCC
- South Africa
- Rest of MEA
Market Dynamics
Drivers
| Driver | (~) % CAGR | Geographic Relevance | Impact Timeline |
|---|---|---|---|
| Urban infrastructure digitalization mandates | +4.0% | Global | Medium term |
| 5G&fiber coverage enabling city IoT | +3.0% | North America, Europe, Asia Pacific | Short term |
| Public climate&resilience funding | +2.5% | OECD, select emerging markets | Medium term |
| Growth in connected vehicles&mobility | +2.0% | Global urban corridors | Medium term |
| Smart public safety modernization | +1.5% | Americas, EMEA | Short term |
Urban infrastructure digitalization mandates
Urban infrastructure digitalization mandates could add approximately +4.0% to the baseline Smart City Market CAGR by turning traditional transport, energy, water, and building projects into continuous technology-purchasing programs. Cities represent nearly 56% of global infrastructure investment requirements through 2040, while annual infrastructure spending is estimated at around 3–4% of global GDP.
A growing portion of this expenditure is being directed toward digitally enabled assets, including sensor-equipped roads, automated power grids, connected water networks, and intelligent buildings. The expected addition of approximately 2.5 billion urban residents between 2020 and 2050 will further require municipalities to expand infrastructure while meeting climate, efficiency, and resilience targets.
Multi-year service contracts can increase recurring revenue per installed asset by an estimated 10–20%. This combination of mandatory smart features, large public infrastructure budgets, and service-based contracts supports faster and more stable growth across smart utilities, transportation, buildings, and governance platforms compared with conventional infrastructure investment.
Restraints
| Restraint | (~) % CAGR | Geographic Relevance | Impact Timeline |
|---|---|---|---|
| High sovereign borrowing costs | -3.5% | Emerging markets, select OECD | Short term |
| Municipal budget rigidity | -2.5% | Global | Medium term |
| Data protection&procurement compliance | -2.0% | Europe, North America | Medium term |
| Fragmented standards for interoperability | -1.5% | Global | Long term |
| Citizen opposition to surveillance | -1.0% | Europe, Americas | Short term |
High sovereign borrowing costs
High sovereign borrowing costs could reduce the Smart City Market’s baseline CAGR by approximately -3.5%, as governments face greater difficulty financing large urban technology projects. Sovereign bond yields in many emerging markets increased from nearly 3–4% during the mid-2010s to around 7–9% after 2022, while several frontier economies now pay double-digit rates on new debt.
Interest payments also consume more than 10% of government revenue in a growing number of countries, leaving less funding available for smart grids, intelligent transport systems, digital utilities, and integrated city platforms.
Municipal governments often depend on central transfers, government guarantees, or public borrowing to fund infrastructure. When national budgets tighten, local capital expenditure can decline by 10–20% year on year in financially stressed markets.
Challenges
| Challenge | (~) % CAGR | Geographic Relevance | Mitigation Horizon |
|---|---|---|---|
| Critical digital skills gap | -3.0% | Global | Long term |
| Cybersecurity risk exposure | -2.5% | Global | Medium term |
| Legacy asset integration complexity | -2.0% | OECD, large emerging cities | Long term |
| Vendor lock-in concerns | -1.5% | Global | Medium term |
| Urban data governance maturity | -1.0% | Global | Medium term |
Critical digital skills gap
The critical digital skills gap imposes around -3.0% friction on potential CAGR by limiting how fast cities can design, deploy, and operate complex smart systems, even when funding exists. Per ILO labour statistics, global shortages of ICT professionals exceeded 4 million roles in 2025, with demand for data engineers, cybersecurity specialists, and cloud architects growing at more than 10% annually.
OECD skills surveys show that fewer than 30% of municipal employees in many member countries report advanced competence in data analytics or digital project management, despite rapid adoption targets for e-government and smart infrastructure. According to World Bank urban governance assessments, capability constraints are a leading reason why large cities under-execute approved digital budgets, sometimes achieving only 60–70% of planned disbursements in early program years.
Strategically, this forces reliance on external systems integrators, increases project overheads by an estimated 5–10%, and extends deployment timelines well beyond initial plans. Private vendors must invest heavily in training, managed services, and simplified tooling to compensate.
Opportunities
| Opportunity | (~) % CAGR | Geographic Relevance | Execution Window |
|---|---|---|---|
| Outcome-based smart service contracts | +3.0% | Global | Medium term |
| AI-driven urban operations platforms | +2.5% | OECD, advanced emerging markets | Short term |
| Green finance-linked city retrofits | +2.0% | Global | Medium term |
| Inter-city data&platform sharing | +1.5% | Regional blocs | Long term |
| Private operator-led district models | +1.0% | Asia Pacific, Middle East | Medium term |
Outcome-based smart service contracts
In 2022, 57% of the global population lived in urban areas, with the share projected to reach 68% by 2050. More than 70% of EU residents already live in cities, which generate 23% of transport-related emissions. Residents travel an average of 27 kilometres per day for 80 minutes, while ride-hailing is used by 23% and ride-sharing by 12%.
Buildings represented around 30% of global energy demand in 2024, with residential properties accounting for nearly 70% of building energy use. Global grid investment increased from about USD 300 billion annually to USD 400 billion in 2024, while battery-storage investment exceeded USD 50 billion. Smart city growth also faces integration and security challenges. Among 33 OECD countries, 88% had interoperability frameworks, but only 67% had API standards, 61% had metadata standards, and 52% had open-source frameworks.
ENISA reviewed more than 11,000 incidents, with public administration representing 19% of targets and transport 11%. AI use in internal government operations increased from 70% to 86%, while public-service adoption reached 75%. Building electricity use rose by more than 600 TWh, or 5%, in 2024. ITU Study Group 20 introduced 57 work items, while more than 250 cities now use nearly 100 U4SSC indicators supported by 19 UN agencies.
Key Players Analysis
Tier-1 companies, including Cisco, Microsoft, IBM, Huawei, Siemens, Schneider Electric, Honeywell, Hitachi, GE, Intel, NEC, and ABB, collectively account for an estimated 30–40% of global smart city platform, infrastructure, and cloud-service revenue. Cisco generated USD 56.7 billion in FY2025 revenue, including USD 22.3 billion from software, which increased by 21% year on year. The company also invested USD 9.3 billion in research and development, equal to 16.4% of revenue, supporting networking, IoT, cybersecurity, and city-monitoring solutions.
Microsoft’s Intelligent Cloud segment added USD 18.8 billion in FY2025 revenue, recording 21% growth, while Azure and related services expanded by 34%. Siemens’ Smart Infrastructure business generated approximately EUR 23.0 billion in fiscal 2025 revenue and achieved an 18.3% operational margin. Huawei, Honeywell, Hitachi, GE, Intel, NEC, and ABB maintain strong positions across telecom networks, industrial automation, power systems, embedded computing, smart transportation, and public safety.
Tier-2 companies such as UrbanFootprint, Quantela, and AGT International focus on specialized areas including digital twins, urban planning, analytics, and city-operation platforms. Their annual revenues generally range from tens of millions to low hundreds of millions of dollars. Many invest more than 20% of revenue in software development. Tier-1 firms continue to strengthen their portfolios through acquisitions and AI investment, including more than USD 2 billion in Cisco AI infrastructure orders during FY2025, while Tier-2 firms use partnerships to access wider markets.
Top Key Players in the Market
- Cisco Systems, Inc.
- Microsoft Corporation
- International Business Machines Corporation
- Huawei Technologies Co., Ltd.
- Honeywell International Inc.
- Schneider Electric SE
- Siemens AG
- Hitachi, Ltd.
- General Electric Company
- NEC Corporation
- UrbanFootprint, Inc.
- Quantela, Inc.
- Intel Corporation
- ABB Ltd.
- AGT International
Recent Developments
- In 2025, KAFD and Huawei signed an MoU to introduce advanced smart city technologies across the 1.6 million-square-metre financial district in Riyadh. The planned infrastructure includes Wi-Fi 7, 5G-Advanced connectivity, AI, IoT systems, cloud platforms, and connected smart poles.
- In 2025, Schneider Electric partnered with The Mobility House Solutions to expand smart charging and energy-management systems for commercial electric vehicle fleets. The partnership focuses on electric trucks, buses, and passenger vehicles operating from large depots and transport facilities. Its combined experience covers more than 2,000 fleet projects and over 100 heavy-duty vehicle depots.
Report Scope
| Report Features | Description |
|---|---|
| Market Value (2025) | USD 1.4 Trillion |
| Forecast Revenue (2035) | USD 10.2 Trillion |
| CAGR (2026-2035) | 21.6% |
| Base Year for Estimation | 2025 |
| Historic Period | 2020-2024 |
| Forecast Period | 2026-2035 |
| Report Coverage | Revenue Forecast, Market Dynamics, Competitive Landscape, Recent Developments |
| Segments Covered | By Application (Smart Governance, Smart Building, Environmental Solution, Smart Utilities, Smart Transportation, Smart Healthcare, Smart Public Safety, Smart Security, Smart Education, Smart Mobility Management, Other), By Component (Hardware, Software, Services), By Smart Governance & Citizen Services (City Surveillance, C.C.S., E-governance, Smart Lighting, Smart Infrastructure), By Smart Utilities (Energy Management, Water Management, Waste Management, Meter Data Management, Distribution Management System, Substation Automation, Other), By Smart Transportation (Intelligent Transportation System, Parking Management, Smart Ticketing & Travel Assistance, Traffic Management, Passenger Information, Connected Logistics, Other), By Smart Healthcare (Medical Devices, Systems & Software), By End-User (Government and Municipal, Residential, Commercial and Industrial, Transportation and Logistics Operators, Utilities Providers, Other) |
| Regional Analysis | North America – US, Canada; Europe – Germany, France, The UK, Spain, Italy, Rest of Europe; Asia Pacific – China, Japan, South Korea, India, Australia, Singapore, Rest of APAC; Latin America – Brazil, Mexico, Rest of Latin America; Middle East & Africa – GCC, South Africa, Rest of MEA |
| Competitive Landscape | Cisco Systems, Inc., Microsoft Corporation, International Business Machines Corporation, Huawei Technologies Co., Ltd., Honeywell International Inc., Schneider Electric SE, Siemens AG, Hitachi, Ltd., General Electric Company, NEC Corporation, UrbanFootprint, Inc., Quantela, Inc., Intel Corporation, ABB Ltd., AGT International |
| Customization Scope | Customization for segments, region/country-level will be provided. Moreover, additional customization can be done based on the requirements. |
| Purchase Options | We have three licenses to opt for: Single User License, Multi-User License (Up to 5 Users), Corporate Use License (Unlimited Users and Printable PDF) |





























