


Report Overview
In 2025, the Global Smart Wearables Market was valued at USD 95.5 billion. The market is projected to grow at a CAGR of 19.1% during 2026–2035, reaching approximately USD 548.2 billion by 2035. North America dominated the global market in 2025, accounting for more than 40.2% of the total market share and generating approximately USD 38.4 billion in revenue.
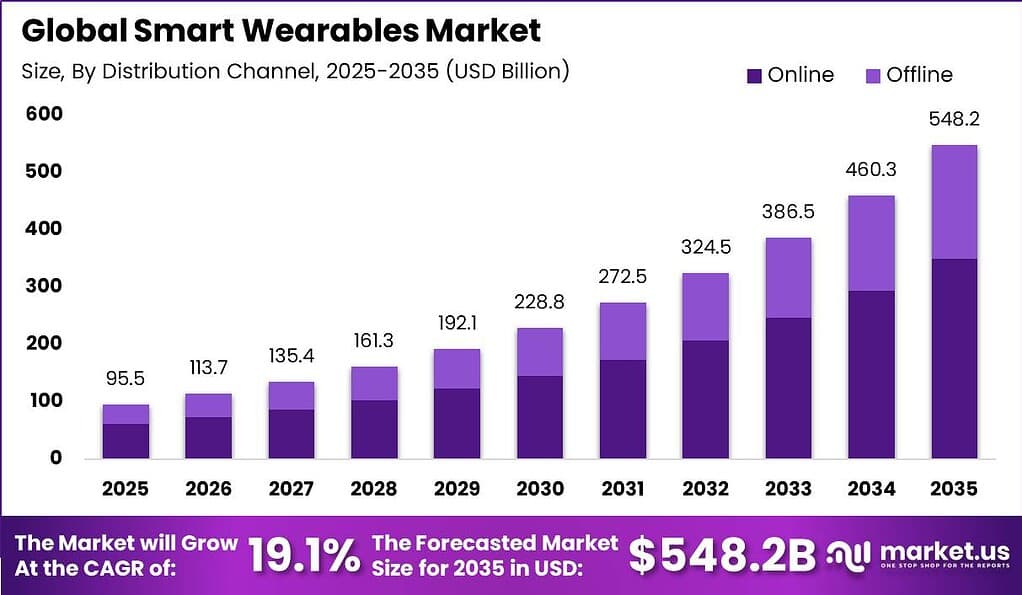
This sharp rise is strongly linked to the rapid scale‑up of digital health, fitness tracking, and connected consumer electronics. Over the last decade, the World Bank has committed just under USD 4 billion to digital health–related projects, with about 51% of this investment focused on health sector solutions such as remote monitoring, electronic records, and telehealth platforms, all of which rely heavily on wearable sensors and smart devices for data capture and continuous patient monitoring.
Global wearable shipments are expected to reach around 538 million units in a single year, supported by mid-single-digit annual volume growth. This expansion shows that smartwatches, hearables, fitness devices, and health wearables are shifting from niche products to mass-market consumer technologies.
Demand is also increasing as healthcare systems, insurers, and employers use wearable devices to manage chronic disease costs and improve workforce productivity. The World Bank’s health portfolio of around USD 27 billion is increasingly focused on data-driven and digitally enabled care. Supported by advanced connectivity, high consumer spending, and strong technology ecosystems.
Key Takeaway
- The global smart wearables market was valued at USD 95.5 billion in 2025.
- The global smart wearables market is projected to grow at a CAGR of 19.1% and is estimated to reach USD 548.2 billion by 2035.
- On the basis of product type, the smartwatches segment dominated the market, constituting 35.4% of the total market share.
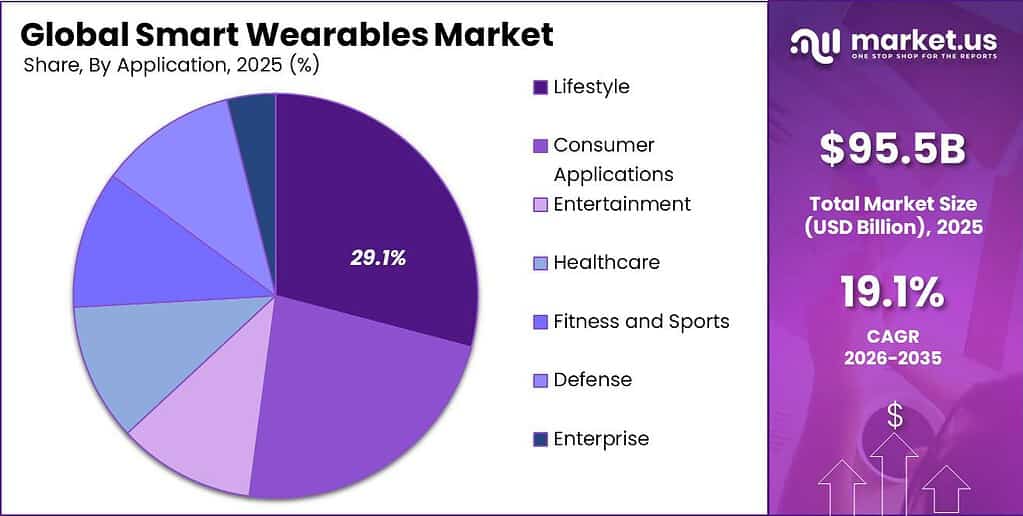
- Based on application, the lifestyle segment dominated the smart wearables market, accounting for 29.1% of the total market share.
- On the basis of distribution channel, the online segment dominated the market, accounting for 63.7% of the total market share.
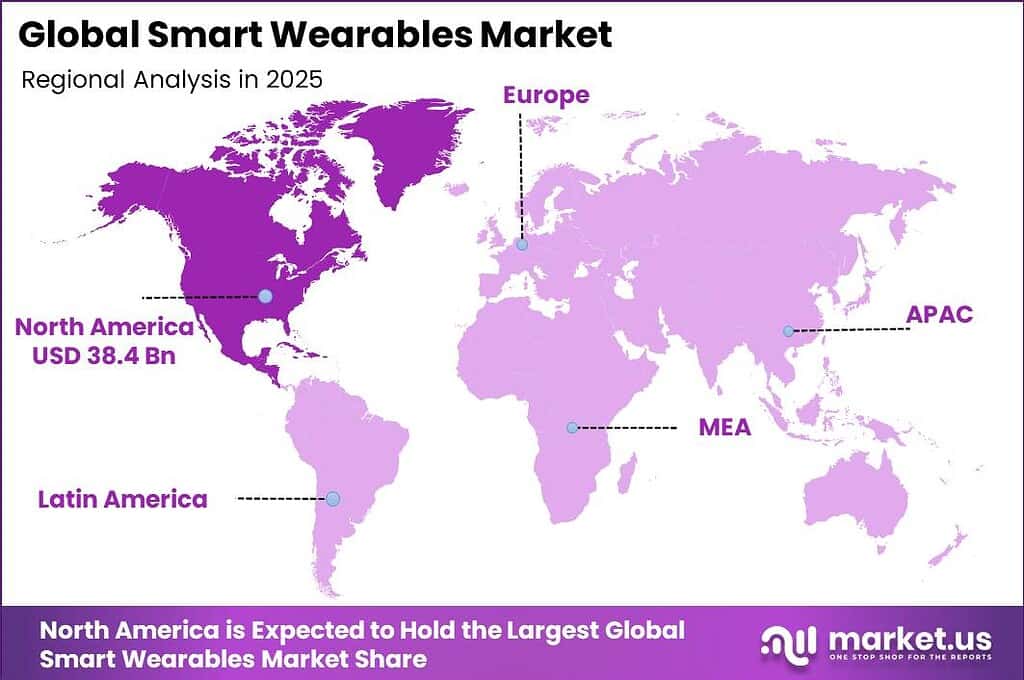
- In 2025, North America was the most dominant region in the smart wearables market, accounting for 40.2% of the total market share, equivalent to approximately USD 38.4 billion.
Product Type
In 2025, Smartwatches held a dominant market position, capturing more than a 35.4% share. In digital finance, wearables have become a practical interface for everyday payments, with Indian UPI transactions alone crossing 12 billion in December 2025, as banks and wallet providers rolled out smartwatch-ready payment apps. Biometric security on smartwatches is reinforcing trust in contactless payments, aligning with global forecasts that generative AI in fintech will reach about USD 2.17 billion in 2025 as institutions embed AI-driven fraud detection into consumer devices.
In March 2026, several neobanks expanded smartwatch-based budgeting tools, using generative AI to summarize spending patterns and push tailored alerts, supporting wider adoption among younger urban users. India’s AI in fintech spending, which was around USD 690 million in 2025, is also nudging local OEMs to pair health tracking with instant micro-insurance offers on watches, creating new bundled services. By June 2026, international payment networks were piloting smartwatch-focused tokenization programs, positioning wearables as a frontline channel for secure, AI-enhanced financial experiences.
Application
Lifestyle held a significant share of the market in 2025, accounting for about 29.1% as generative AI reshaped how consumers manage savings, subscriptions, and everyday spending behaviors. The wider AI in fintech market, estimated near USD 30 billion in 2025, is channeling substantial investment into AI-powered personal finance coaches that sit inside banking apps and lifestyle platforms.
India, where AI in fintech is projected to grow strongly through 2034, has seen lifestyle payment super‑apps bundle micro‑investments, rewards, and BNPL under a single AI interface, encouraging broader adoption. These practical, day‑to‑day tools underpin the steady expansion of lifestyle applications in generative AI fintech.
Distribution Channel
Online distribution is emerging as a fast-growing segment in 2025, with digital channels accounting for roughly 63.7% of generative AI in fintech deployments as cloud-based delivery becomes the default. The global generative AI in fintech market is expected to rise from about USD 2.17 billion in 2025 to USD 2.94 billion in 2026, and much of this increase is tied to API-first online platforms rather than on-premise solutions.
In May 2025, several major fintechs expanded AI‑driven onboarding and KYC services through web and mobile portals, reducing account opening times from days to minutes and lifting completion rates. Online channels also host AI-powered chatbots and virtual advisors; by October 2025, leading digital banks reported significant volumes of customer queries resolved through generative AI interfaces, lowering support costs.
Key Market Segments
By Product Type
- Smartwatches
- Fitness Trackers
- Smart Glasses
- Smart Clothing
- Smart Jewellery
- Smart Shoes
- Wearable Cameras
- Wearable Medical Devices
By Application
- Lifestyle
- Consumer Applications
- Entertainment
- Healthcare
- Fitness and Sports
- Defense
- Enterprise
By Distribution Channel
- Online
- Offline
Geopolitical Impact Analysis
Escalating geopolitical frictions are tightening cost and lead-time baselines for smart wearables, which rely heavily on China- and East Asia-centric supply chains for PCBs, sensors, batteries, and RF modules. WTO documentation confirms that Section 301 actions imposed additional US duties of 25% on multiple Chinese industrial and technology goods, including PCB assemblies and electronic sub-components used in smartwatches and fitness bands. Recent tariff schedules show effective US rates on Chinese-origin electronics assemblies commonly between 25% and 40%, with some HTS lines reaching about 145% in targeted categories, materially raising landed costs.
Even where only 20–30% of bill-of-materials value is tariff-exposed, this can translate into a 3–8% uplift in final device pricing. Meanwhile, US and allied export controls on advanced semiconductors and RF technologies are pushing OEMs toward dual-sourcing and board redesigns, lengthening design cycles and component lead times. World Bank analysis indicates major geopolitical disruptions can reduce global trade volumes by around 6.5% within months, signaling tighter availability of critical ICs and MEMS sensors.
Logistics disruptions linked to the Red Sea have further increased supply-chain volatility. Container freight rates on Far East–Europe lanes rose roughly 220% between December 2023 and early 2024, while Shanghai–Africa trades recorded increases of 137–200%, including absolute rises of about 1,872 dollars per TEU on some corridors. UNCTAD notes that global maritime trade volumes recovered approximately 2.4% in 2023, but volatile freight rates and conflict-related rerouting are adding 10–15 days to typical Asia–Europe transit times for electronics cargoes.
Fuel costs remain another pressure point, with crude benchmarks around 70 dollars per barrel keeping bunker and aviation fuel surcharges elevated. Overall, EMS providers are facing 20–200% container-rate spikes, tariff bands of up to 40% or more on China-linked inputs, and multi-week routing delays, encouraging OEMs to regionalize final assembly in India, Eastern Europe, and Mexico while selectively increasing prices and prioritizing high-margin SKUs.
Regional Analysis
North America dominates the global smart wearables market, capturing a significant 40.2% share and reaching a market value of USD 38.4 billion, supported by high device penetration rates and strong consumer spending on connected technologies.
The United States accounts for over 75% of the regional revenue, driven by widespread adoption of smartwatches and fitness trackers, with smartwatch penetration exceeding 35% among adults. The region benefits from a mature digital ecosystem, where over 85% of the population uses smartphones, enabling seamless integration with wearable devices.
Canada contributes steadily with increasing adoption rates, particularly in urban centers where digital health infrastructure is well established. Moreover, North America accounts for a considerable share of global R&D investments in wearable technology, with continuous innovation in sensors, battery efficiency, and connectivity standards such as Bluetooth Low Energy and 5G integration.
Key Regions and Countries
North America
- US
- Canada
Europe
- Germany
- France
- The UK
- Spain
- Italy
- Rest of Europe
Asia-Pacific
- China
- Japan
- South Korea
- India
- Australia
- Rest of APAC
Latin America
- Brazil
- Mexico
- Rest of Latin America
Middle East & Africa
- GCC
- South Africa
- Rest of MEA
Market Dynamics
Drivers
| Driver | (~) % Impact on CAGR | Geographic Relevance | Impact Timeline |
|---|---|---|---|
| FDA Wellness/CDS Deregulation Push | +3.2% | North America | Short term (≤ 2 years) |
| Remote Patient Monitoring Reimbursement Codes | +2.6% | North America, Western Europe | Short term (≤ 2 years) |
| Smart Ring and Patch Form-Factor Adoption | +2.1% | Asia-Pacific, North America | Short term (≤ 2 years) |
| On-Device AI Health Inference Chipsets | +1.9% | Global | Medium term (2–4 years) |
| Corporate Wellness and Insurance Incentive Programs | +1.4% | North America, Europe | Medium term (2–4 years) |
| India Domestic Manufacturing (PLI) Ramp-Up | +1.2% | India, South Asia | Medium term (2–4 years) |
FDA Wellness and Clinical Decision Support Deregulation
The root cause is the January 6, 2026, FDA guidance update that relaxed Section 520(o)(1)(E) criteria under the Food, Drug and Cosmetic Act. The update broadens the definition of non-device general wellness products to include wrist-worn and ring-form sensors reporting heart rate variability, blood pressure, and oxygen saturation without premarket clearance.
The quantitative mechanism is a compression of go-to-market cycles. Previously, 510(k) submissions required an average of 6 to 9 months of regulatory review. These requirements can now be bypassed for single-output wellness claims, effectively cutting time-to-shelf by an estimated 30 to 40% for new SKUs entering the market in 2026.
The strategic impact is a shift from hardware-only margins of roughly 25 to 30% toward blended hardware-plus-subscription models. Manufacturers are racing to monetize the expanded non-device wellness category before any future tightening. At the same time, firms face reputational risks following the FDA’s 2025 warning letter to a wearable company over unauthorized blood pressure claims.
Restraints
| Restraint | (~) % CAGR | Geographic Relevance | Impact Timeline |
|---|---|---|---|
| Mature-Node Semiconductor Allocation Constraints | -2.4% | Global, concentrated in East Asia fabs | Short term (≤ 2 years) |
| High-Interest-Rate Consumer Discretionary Pullback | -1.8% | North America, Europe | Short term (≤ 2 years) |
| Cross-Border Tariff Escalation on Electronics Components | -1.5% | United States, China | Short term (≤ 2 years) |
| Data Privacy Statutory Restrictions (Biometric Data) | -1.1% | European Union, California | Short term (≤ 2 years) |
| Battery Raw Material Export Curbs | -0.9% | Global, sourced from China/DRC | Short term (≤ 2 years) |
Mature-Node Semiconductor Allocation Constraints
The root cause is persistent capacity misallocation at 90 to 300 nm mature-node fabs, where S&P Global projects demand rising by 23% through 2026. AI-chip prioritization at leading foundries continues to crowd out low-margin wearable sensor and power-management IC orders.
The quantitative bottleneck manifests as lead times extending to six months or more for critical components. HBM-adjacent memory pricing pressures are also pushing component costs up by an estimated 5 to 10% in 2025 alone.
The strategic business impact is direct margin compression of an estimated 3 to 5 percentage points on bill-of-materials for entry-tier smartwatches and fitness bands. OEMs are therefore forced to either delay product launches by one to two quarters or absorb costs that erode already-thin device-level margins.
Challenges
| Challenge | (~) % CAGR | Geographic Relevance | Mitigation Horizon |
|---|---|---|---|
| Clinical Data Scientist Talent Shortage | -1.3% | North America, Western Europe | Medium term (2–4 years) |
| Sensor Accuracy Validation Complexity | -1.1% | Global | Long term (≥ 4 years) |
| Battery Energy Density Plateau | -1.0% | Global | Long term (≥ 4 years) |
| Fragmented Interoperability Standards | -0.8% | Global | Medium term (2–4 years) |
| Device Churn and Low Retention Rates | -0.7% | North America, Asia-Pacific | Medium term (2–4 years) |
Clinical Data Scientist Talent Shortage
The structural vulnerability stems from wearable manufacturers scaling AI-driven physiologic inference engines faster than the labor market can supply biomedical-data-trained engineers. Industry association surveys indicate an estimated deficit of 8,000 to 10,000 qualified clinical-algorithm specialists across North American and European digital-health employers as of 2026.
The quantitative friction appears as average time-to-hire for these roles extending beyond 4 to 6 months. Salary inflation for validation-engineering positions has also reached 15 to 20% year-over-year. Both factors slow the pace at which firms can bring FDA-aligned wellness algorithms to market under the newly loosened 2026 guidance.
The long-term corporate adjustment is a shift toward outsourced clinical-validation partnerships and academic-hospital collaborations to offset in-house capacity gaps. This raises per-unit R&D amortization costs by an estimated 2 to 3% and continuously constrains the speed of new algorithm rollouts, even though it does not halt existing product sales.
Opportunities
| Opportunity | (~) % Potential CAGR Upside | Geographic Relevance | Execution Window |
|---|---|---|---|
| Prescription Digital Therapeutics Bundling | +2.3% | North America, Western Europe | Medium term (2–4 years) |
| Enterprise and Industrial Safety Wearable Rollouts | +1.9% | North America, Asia-Pacific | Medium term (2–4 years) |
| Non-Invasive Glucose Sensing Commercialization | +1.7% | Global | Long term (≥ 4 years) |
| Tier-2/Tier-3 Emerging Market Penetration | +1.4% | Southeast Asia, Latin America, Africa | Medium term (2–4 years) |
| Insurer-Led Data Monetization Partnerships | +1.1% | North America | Long term (≥ 4 years) |
Prescription Digital Therapeutics Bundling
This represents untapped white space rather than a current driver because it requires deliberate strategic action to convert wellness-tier hardware into physician-prescribed adjunct therapy bundles. This monetization model is not yet widely activated under the existing wellness-exempt regulatory pathway governing most consumer wearables.
The unit-economic shift would come from moving average per-device revenue capture from a one-time hardware sale toward recurring prescription-adjacent subscription revenue. Margin expansion is estimated at 8 to 12 percentage points above standard hardware margins of 25 to 30% once reimbursement-linked software tiers are layered in.
Key Players Analysis
Tier-1 in smart wearables is led by Apple and Samsung, with Garmin, Huawei, and Xiaomi forming a scale-driven Tier-2 challenger group focused on fitness, outdoor, and mid-range consumer segments. Apple commands an estimated 30–35% of global smartwatch and premium wearables value share, supported by its Wearables, Home and Accessories segment, which generated roughly mid-thirties billion dollars in annual net sales in fiscal 2025, around 8–9% of total revenue.
Samsung’s Device eXperience (DX) division reported KRW 169.99 trillion (about USD 130–135 billion) in 2023 revenue, representing 65.7% of group sales, with its Mobile Experience (MX) business driving most DX revenue and supporting a high-teens percentage share of global wearables value, particularly Android smartwatches and hearables.
Garmin remains a specialized Tier-2 leader, reporting USD 5.23 billion in 2023 revenue, up 8% year on year, while Q1 2024 fitness revenue increased 40% to USD 343 million. Competitive dynamics are increasingly shaped by R&D and segment-focused investment. Apple has historically allocated around 7% of net sales to R&D, exceeding USD 25 billion annually, supporting Apple Watch, AirPods, custom silicon, and health and fitness capabilities.
Samsung Electronics reported KRW 258.94 trillion in 2023 revenue and KRW 6.57 trillion in operating profit, while continuing to integrate Galaxy smartphones, Watch, and Buds and sustain an estimated low-to-mid-20s unit share in Android-based wearables. Garmin reported nearly USD 1.1 billion in operating income on USD 5.23 billion in sales, or approximately a 21% operating margin, reflecting its profitable niche model and focus on advanced training metrics, multi-band GPS, and battery efficiency.
Top Key Players in the Market
- Sony Corporation
- Garmin Ltd
- Samsung Electronics Co. Ltd.
- Fitbit
- Under Armour
- Fossil Group
- Solos Technology Limited
- Ekso Bionics Holdings Inc.
- Sensoria Inc.
- AIQ Smart Clothing Inc.
- Withings
- Nuheara Limited
Recent Developments
- In April 2026, Apple announced a USD 10 billion multi‑year investment plan to expand Apple Watch and Vision Pro‑linked wearable production capacity in India, including a new smart wearables manufacturing campus near Bengaluru spanning approximately 1.2 million square feet and targeting additional annual output of 25–30 million wearable units once fully ramped up.
- In May 2026, Oura launched the Oura Ring 5 with advanced health‑tracking capabilities and simultaneously confirmed a new high‑volume smart ring production line designed for up to 5 million units per year, supported by a manufacturing footprint expansion of roughly 25,000 square meters in its contract facilities.
Report Scope
| Report Features | Description |
|---|---|
| Market Value (2025) | USD 95.5 Billion |
| Forecast Revenue (2035) | USD 548.2 Billion |
| CAGR (2026-2035) | 19.1% |
| Base Year for Estimation | 2025 |
| Historic Period | 2020-2024 |
| Forecast Period | 2026-2035 |
| Report Coverage | Revenue Forecast, Market Dynamics, Competitive Landscape, Recent Developments |
| Segments Covered | By Product Type (Smartwatches, Fitness Trackers, Smart Glasses, Smart Clothing, Smart Jewelry, Smart Shoes, Wearable Cameras, Wearable Medical Devices), By Application (Lifestyle, Consumer Applications, Entertainment, Healthcare, Fitness and Sports, Defense, Enterprise), By Distribution Channel (Online, Offline) |
| Regional Analysis | North America – US, Canada; Europe – Germany, France, The UK, Spain, Italy, Rest of Europe; Asia-Pacific – China, Japan, South Korea, India, Australia, Singapore, Rest of APAC; Latin America – Brazil, Mexico, Rest of Latin America; Middle East & Africa – GCC, South Africa, Rest of MEA |
| Competitive Landscape | Sony Corporation, Garmin Ltd, Samsung Electronics Co. Ltd., Fitbit, Under Armour, Fossil Group, Solos Technology Limited, Ekso Bionics Holdings Inc., Sensoria Inc., AIQ Smart Clothing Inc., Withings, Nuheara Limited |
| Customization Scope | Customization for segments, region/country-level will be provided. Moreover, additional customization can be done based on the requirements. |
| Purchase Options | We have three licenses to opt for: Single User License, Multi-User License (Up to 5 Users), Corporate Use License (Unlimited Users and Printable PDF) |





























