


Report Overview
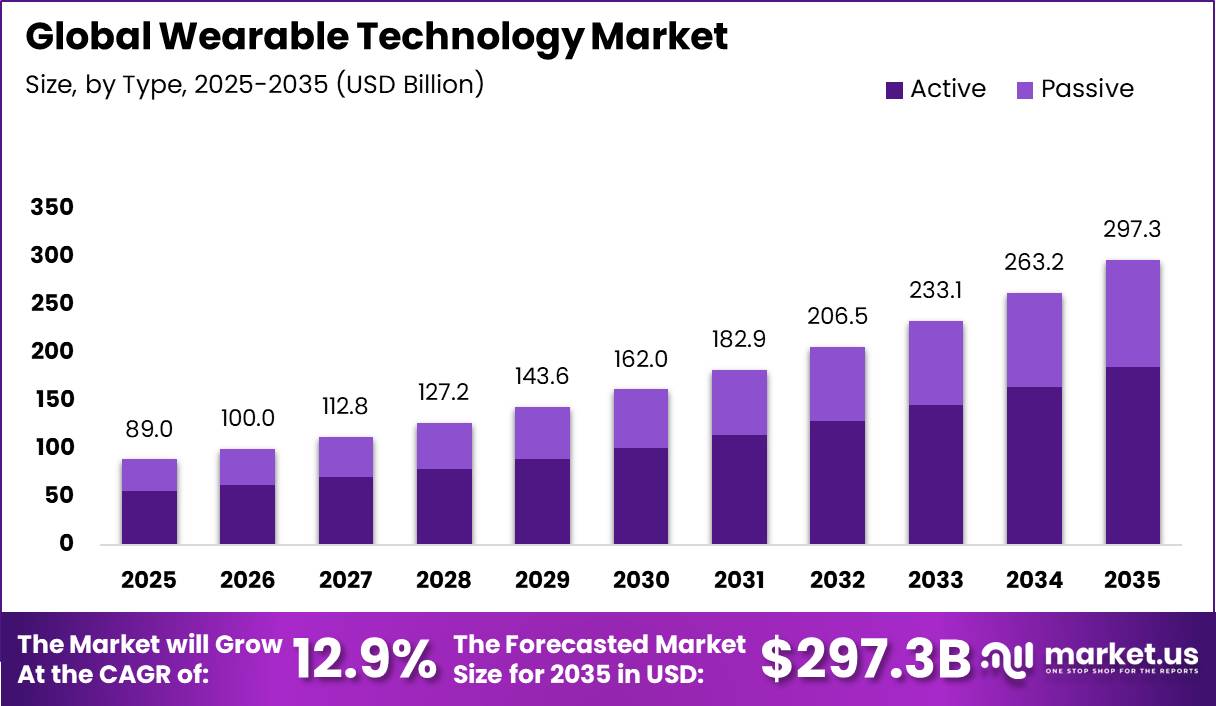
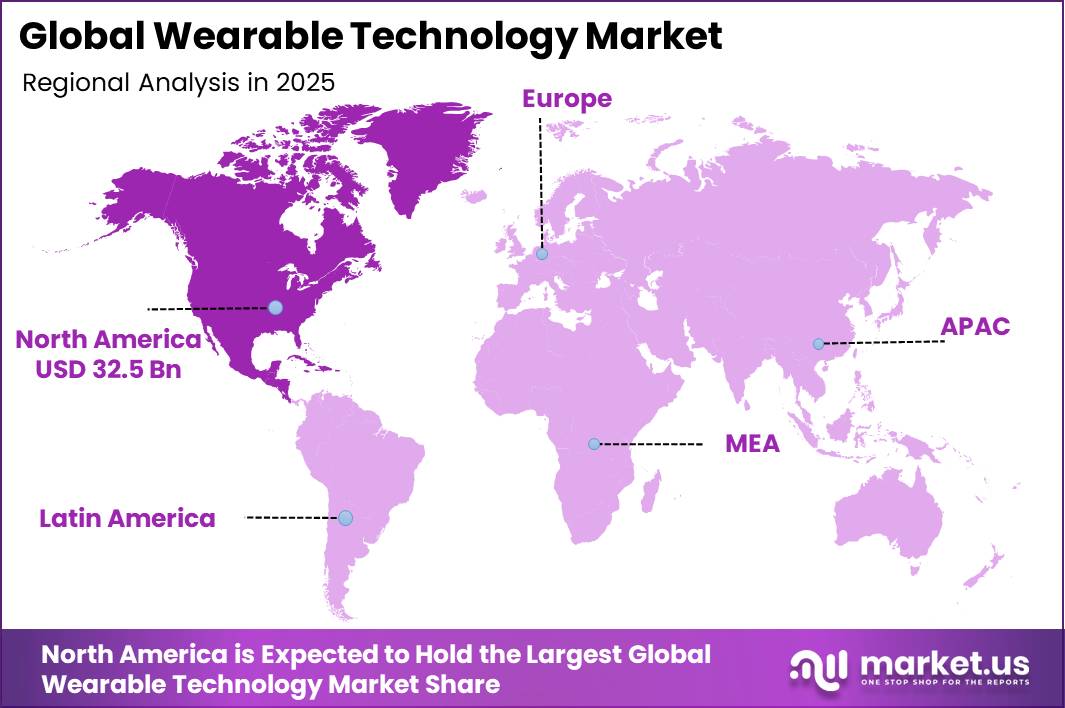
In 2025, the Global Wearable Technology Market was valued at USD 89.0 billion. The market is projected to grow at a CAGR of 12.9% during 2026–2035, reaching approximately USD 297.3 billion by 2035. North America dominated the global market in 2025, accounting for more than 36.5% of the total market share and generating approximately USD 32.5 billion in revenue.
The market is expanding due to the increasing number of people living with chronic diseases that require regular health monitoring. According to the World Health Organization (WHO), noncommunicable diseases (NCDs), including cardiovascular diseases, diabetes, and respiratory disorders, caused at least 43 million deaths in 2021, accounting for 75% of all non-pandemic-related deaths globally.
The International Diabetes Federation (IDF) Diabetes Atlas 2025 estimates that 589 million adults aged 20–79 are living with diabetes worldwide, or 1 in every 9 adults, with this number expected to increase to 853 million by 2050. In addition, WHO reports that 1.28 billion adults have hypertension, while 46% remain unaware of their condition. These health trends are increasing demand for wearable devices such as smartwatches, continuous glucose monitors, ECG wearables, and blood pressure trackers that support continuous and remote patient monitoring.
The region benefits from advanced healthcare systems, strong digital infrastructure, and high adoption of connected health technologies. According to the United Nations, the global population aged 60 years and above is projected to increase from 1 billion in 2020 to 1.4 billion by 2030 and 2.1 billion by 2050, creating greater demand for wearable health devices.
Ericsson’s Mobility Report states that around 660 million new 5G subscriptions were added globally in 2025, while North America achieved 79% 5G penetration. Faster connectivity supports real-time health data sharing, further strengthening wearable device adoption. Additionally, IDC reported global wearable shipments of 145.7 million units in Q1 2026, up 4.3% year over year, highlighting continued market demand across product categories.
Key Takeaway
- The global Wearable Technology Market was valued at USD 89.0 Billion in 2025 and is projected to reach USD 297.3 Billion by 2035.
- The market is anticipated to expand at a CAGR of 12.9% during the forecast period from 2026 to 2035.
- By type, the Active segment is expected to witness the fastest growth, while accounting for 62.5% of the market.
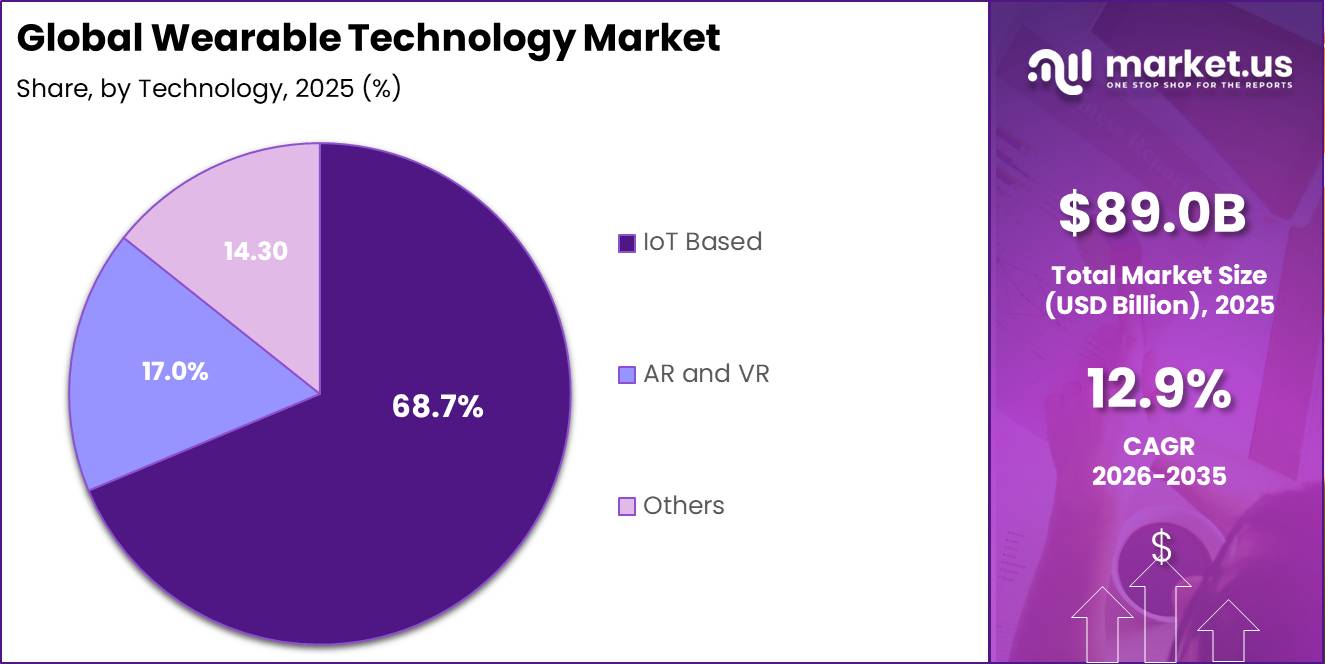
- By technology, IoT-based wearables led the market with a 68.7% share in 2025.
- By end use, Health & Fitness accounted for a 41.2% market share and is also projected to be the fastest-growing segment.
- North America dominated the global market with a 36.5% share, accounting for approximately USD 32.5 billion in 2025.
By Type
The Active segment accounted for approximately 62.5% of the global Wearable Technology Market, making it the largest product category. Its leadership is driven by growing demand for real-time health and fitness monitoring as more consumers focus on preventive healthcare, physical activity, and sports performance. According to the World Health Organization (WHO), around 1.8 billion adults, or 31% of the global adult population, did not meet the recommended minimum level of physical activity in 2022.
The organization also estimates that, without stronger intervention, nearly 500 million new preventable noncommunicable disease (NCD) cases could occur between 2020 and 2030, creating an additional USD 300 billion healthcare burden. These trends are encouraging greater use of wearable devices that track health and fitness data, including smartwatches, fitness bands, GPS sports watches, heart rate monitors, and continuous health trackers.
The commercial fitness industry further supports the growth of the Active segment. According to the Health & Fitness Association (HFA) 2025 Global Report, the global health and fitness industry generated USD 103.1 billion in revenue in 2024, serving 240.5 million members across more than 200,000 fitness facilities in nearly 30 countries. Global fitness memberships increased by 6% year over year, while industry revenue grew by 8%.
By Technology
The IoT-based segment held approximately 68.7% of the global Wearable Technology Market by technology, making it the leading segment. Its dominance is driven by the increasing use of connected devices that collect and share real-time health and fitness data. According to the Bluetooth Special Interest Group (Bluetooth SIG) Market Update 2025, global Bluetooth device shipments are expected to exceed 5.3 billion units in 2025, while Bluetooth Low Energy (BLE) shipments are projected to grow at a 22% CAGR through 2029.
The growing digital ecosystem is further supporting the adoption of IoT-enabled wearables. The International Telecommunication Union (ITU) reported that 6 billion people, or 74% of the global population, were using the internet in 2025, creating a large connected user base for cloud-based wearable applications.
The WHO-ITU Digital Health Report (2024) estimates that investing only USD 0.24 per patient per year in digital health solutions, including IoT-enabled wearables and telemedicine, could save more than 2 million lives, prevent 7 million hospitalizations, and generate USD 199 billion in economic benefits over the next decade. Supporting this trend, the Ericsson Mobility Report states that global 5G subscriptions reached 3.1 billion by Q1 2026, providing the high-speed, low-latency connectivity needed for continuous remote patient monitoring and real-time healthcare services.
By End Use
The Health & Fitness segment accounted for approximately 41.2% of the global Wearable Technology Market, making it the largest end-use segment. Its growth is driven by the increasing focus on preventive healthcare, fitness tracking, and chronic disease management.
The WHO also reported that 19.8 million people died from cardiovascular diseases (CVDs) in 2022, accounting for 32% of all global deaths. Major risk factors include physical inactivity, high blood pressure, and unhealthy diets, increasing the need for continuous health monitoring.
The growing burden of cardiovascular and metabolic diseases is supporting demand for wearable health devices. According to the British Heart Foundation (BHF) Global CVD Factsheet (2026), around 650 million people worldwide are living with cardiovascular disease, with nearly 53 million new cases diagnosed every year.
Key Market Segments
By Type
- Passive
- Wristbands
- Rings
- Key Rings
- Brooches
- Clothing
- Active
- Smart Glasses
- VR Headsets
- Smart Watches
By Technology
- IoT Based
- AR and VR Fastest Growing
- Others
By End Use
- BFSI
- Education
- Fashion
- Gaming & Entertainment
- Health & Fitness
- Logistics & Warehouse
- Travel
- Others
Market Dynamics
Challenge
Chronic hardware talent shortages remain a structural challenge for the wearable industry, particularly in North America, Europe, and Japan, where competition from automotive, industrial automation, and consumer electronics has created persistent shortages in RF design, low-power analog engineering, sensor fusion firmware, and advanced manufacturing. Specialized roles often face 10–20% vacancy rates, with average hiring times extending to 120–180 days.
These workforce gaps delay production expansion by 3–9 months, increase engineering salaries by 15–25%, and contribute to 2–4 percentage point yield losses during early manufacturing runs due to design-to-production misalignment. As a result, product launches slow, margins tighten, and manufacturers struggle to respond quickly to demand or localization requirements.
Overall, these talent constraints are estimated to reduce wearable market growth by approximately 0.9 percentage points of CAGR. Companies are responding through university partnerships, expanded R&D centers, workforce reskilling, and AI-assisted engineering tools, but meaningful improvement is expected to require a 4–6+ year timeframe due to the specialized expertise required.
| Challenge | (~) % CAGR Friction | Geographic Relevance | Mitigation Horizon |
|---|---|---|---|
| Complex sensor supply chain | -1.0% | APAC OEM hubs, NA/EU brands | Medium term (2–4 years) |
| Edge AI power–thermal limits | -0.8% | Global premium segments | Long term (≥ 4 years) |
| Data privacy–governance drag | -0.7% | NA, EU, India, select APAC | Medium term (2–4 years) |
| Chronic hardware talent gaps | -0.9% | North America, EU, Japan | Long term (≥ 4 years) |
| Battery–materials cost volatility | -0.6% | APAC manufacturing, global | Medium term (2–4 years) |
| Platform fragmentation & QoS | -0.5% | Global mass market | Short term (≤ 2 years) |
Opportunity
Smart rings and patchable sensors represent a significant growth opportunity because they expand the wearable market beyond wrist-based devices into smaller, less intrusive, and sleep-friendly form factors. In Q1 2025, wrist-worn device shipments reached 45.6 million units, up 10.5% year over year, including 34.8 million smartwatches, while wristband shipments grew by 34%, indicating increasing maturity in wrist-based wearables.
These new form factors enable applications such as continuous sleep monitoring, fertility and hormonal tracking, and passive stress detection. Studies also show that wearable-driven increases in physical activity of around 15% are associated with lower risks of obesity, type 2 diabetes, obstructive sleep apnea, and depression, supporting demand for comfortable devices designed for continuous wear.
This remains an opportunity because smart rings and patchable sensors are still in the early commercialization stage, with relatively low shipment volumes and evolving data standards. By attracting new users and supporting premium pricing through form-factor innovation, the segment could contribute approximately 1.7 percentage points to overall wearable market CAGR, particularly in North America and urban APAC markets.
| Opportunity | (~) % Potential CAGR | Geographic Relevance | Execution Window |
|---|---|---|---|
| Clinical wearables | +2.5% | North America, EU, Japan | Short term (≤ 2 years) |
| Smart rings and patchables | +1.7% | North America core, APAC urban | Short term (≤ 2 years) |
| Enterprise safety wearables | +1.4% | EU, North America, Gulf | Medium term (2-4 years) |
| Subscription health platforms | +2.0% | North America, EU, APAC developed | Short term (≤ 2 years) |
| Aging-care remote monitoring | +1.9% | Japan, EU, South Korea, China tier-1 | Medium term (2-4 years) |
| Industrial and defense roll-ups | +1.2% | North America, EU, Israel, India | Long term (≥ 4 years) |
Driver
Battery and materials cost volatility creates a persistent pressure point for the wearable industry because lithium-ion cells, specialty polymers, rare earth elements used in haptics and motors, and certain sensor-grade metals remain exposed to global commodity cycles and geopolitical supply risks. Price swings of 15–30% over 12–24 months are not uncommon, especially during supply disruptions or policy shifts affecting key upstream materials.
Even though wearables use relatively small absolute quantities compared with EVs or grid storage, they are highly sensitive to cost changes because typical device bill-of-materials sits in the USD 25–40 range, leaving limited room to pass price increases to consumers without affecting demand. In response, manufacturers often absorb shocks by compressing gross margins by 1–3 percentage points, reducing promotional activity, or delaying feature upgrades such as higher-capacity batteries or improved casing materials.
This slows the pace of product innovation and adoption in price-sensitive markets, contributing an estimated 0.6 percentage point drag on global wearable CAGR. Additionally, sustainability and traceability requirements can add roughly USD 1–2 per unit in early compliance costs. To mitigate these pressures, OEMs are diversifying suppliers, locking in longer-term contracts, and piloting new battery chemistries such as solid-state, though meaningful scale-up typically requires 2–4 years due to certification and validation cycles.
| Driver | (~) % Impact on CAGR | Geographic Relevance | Impact Timeline |
|---|---|---|---|
| Health monitoring and RPM adoption | +2.5% | North America core, EU urban markets, APAC top-tier cities | Short term (≤ 2 years) |
| FDA/clinical wellness clarification | +1.5% | North America core, EU premium channels, Japan | Short term (≤ 2 years) |
| EU Data Act access-by-design mandate | +1.2% | EU core, UK spill-over, vendor export chains | Medium term (2-4 years) |
| Semiconductor and memory supply constraints | +1.8% | APAC manufacturing hubs, North America, EU | Short term (≤ 2 years) |
| Battery, low-power chip, and edge AI improvements | +1.7% | APAC production base, North America premium, EU enterprise | Medium term (2-4 years) |
| Subscription monetization and software-led upgrades | +1.3% | North America core, EU premium, Gulf urban markets | Medium term (2-4 years) |
Restraint
Consumer fatigue, ASP pressure, and device commoditization remain significant restraints on the wearable market as early-adopter segments mature, replacement cycles lengthen, and intense price competition from low-cost manufacturers compresses margins. Premium devices continue to achieve 5–7% unit growth, while mass-market segments experience 5–10% annual ASP declines, reducing overall revenue growth.
As basic health monitoring and notification features become standard in devices priced below USD 100, differentiation increasingly depends on advanced sensors, AI-driven insights, and ecosystem integration. However, maintaining this differentiation requires R&D spending of 8–12% of revenue, which becomes challenging when gross margins fall below 25–30%. Meanwhile, replacement cycles have extended from around 24 months to 36 months or more in mature markets, reducing annual upgrade volumes.
Higher promotional activity and channel competition further pressure profitability, with discounting reducing net margins by approximately 100–200 basis points. Together, these factors are estimated to reduce global wearable market CAGR by around 1.3 percentage points, particularly across North America, Europe, and urban APAC markets where device penetration is already high.
| Restraint | (~) % Impact on CAGR | Geographic Relevance | Impact Timeline |
|---|---|---|---|
| Data-privacy & health-data compliance drag | -1.5% | EU, North America, India | Medium term (2–4 years) |
| Semiconductor & advanced sensor cost overhang | -1.2% | APAC corridors, North America core, EU | Short to medium term (≤ 4 years) |
| Battery tech, materials & safety constraints | -0.8% | Global, with APAC and EU focus | Long term (≥ 4 years) |
| Reimbursement, clinical validation & payor friction | -1.0% | North America core, EU, Japan | Medium to long term (≥ 3 years) |
| Consumer fatigue, ASP pressure & device commoditization | -1.3% | North America, EU, Urban APAC | Medium term (2–4 years) |
| Cross-border trade, tariffs & digital sovereignty rules | -0.7% | US–China, EU, India, Middle East | Short to medium term (≤ 4 years) |
Geopolitical Impact Analysis
Geopolitical developments are increasing costs and creating supply chain challenges for the global Wearable Technology Market. Ongoing U.S.–China trade tensions have resulted in higher tariffs on several electronic components, including printed circuit boards (PCBs) and semiconductors used in smartwatches, fitness trackers, and other wearable devices.
According to the International Monetary Fund (IMF), U.S. tariff rates on many electronics products remain elevated, encouraging manufacturers to diversify production to countries such as Vietnam, India, and Mexico. At the same time, China’s tighter export controls on rare earth materials have affected the supply of Neodymium-Iron-Boron (NdFeB) magnets, which are widely used in wearable speakers, vibration motors, and other miniaturized components.
These restrictions have led to sharp increases in the prices of key rare earth elements, raising production costs for wearable device manufacturers that rely heavily on Chinese supplies. Global shipping disruptions are adding further pressure to the market. According to UNCTAD and the ITF-OECD, security issues in the Red Sea have forced many cargo ships to reroute around the Cape of Good Hope, extending shipping routes by about 3,000–3,500 nautical miles and increasing transit times by roughly 10 days.
Regional Analysis
North America stands as the undisputed dominant region in the global Wearable Technology Market, commanding a leading share of 36.5% and a market value of USD 32.5 Billion, underscoring its commanding position in the worldwide wearable technology landscape. This regional supremacy is underpinned by a confluence of structural and demand-side factors that set North America apart from other geographies.
The United States serves as the primary engine of growth within the region, accounting for the overwhelming majority of regional revenues, driven by its early-mover advantage in consumer electronics adoption, a deeply entrenched culture of health and wellness, and the presence of globally influential technology corporations such as Apple Inc., Fitbit, Garmin, and Google LLC.
The region benefits from a highly developed healthcare infrastructure that is increasingly incorporating wearable devices for remote patient monitoring, chronic disease management, and clinical-grade diagnostics, which has catalyzed both institutional and consumer demand.
Key Regions and Countries
- North America
- US
- Canada
- Europe
- Germany
- France
- The UK
- Spain
- Italy
- Rest of Europe
- Asia Pacific
- China
- Japan
- South Korea
- India
- Australia
- Rest of APAC
- Latin America
- Brazil
- Mexico
- Rest of Latin America
- Middle East & Africa
- GCC
- South Africa
- Rest of MEA
Key Players Analysis
The global Wearable Technology Market is led by a group of major companies, including Apple Inc., Samsung Electronics, Huawei Technologies, Xiaomi, Google, and Garmin. Together, these companies account for an estimated 55–60% of global wearable device shipments and revenue. Apple remains a leading player, supported by strong demand for Apple Watch and AirPods.
Samsung continues to strengthen its position through its smartwatch and fitness band portfolio, while Huawei has achieved more than 200 million cumulative wearable shipments and remains a leading brand in wrist-worn devices.
Xiaomi maintains strong market presence through affordable smart bands and wearables, while Garmin focuses on premium sports and outdoor devices with record revenue growth. These companies continue to invest in advanced sensors, software integration, and connected ecosystems, helping them maintain their competitive positions.
These companies focus on areas such as sports performance, sleep tracking, fashion wearables, and subscription-based health services. While they have smaller market shares than Tier-1 companies, they compete by offering specialized features, premium user experiences, and partnerships with healthcare providers, insurers, and sports organizations.
Top Key Players in the Market
- Xiaomi
- WHOOP
- SUUNTO
- Sony Corporation
- Samsung Electronics Co., Ltd.
- Polar Electro
- Oura Health Oy
- Nike, Inc.
- Imagine Marketing Ltd.
- Huawei Technologies Co., Ltd.
- Google LLC
- Garmin Ltd.
- Fossil Group
- Apple Inc.
- Adidas AG
Recent Developments
- March 31, 2026 – WHOOP raises USD 575 million in Series G funding at a USD 10.1 billion valuation to expand its global health and performance platform, supporting a bookings run rate of approximately USD 1.1 billion exiting 2025 and a disclosed member base of 2.5 million, positioning the company for a near-term IPO and large-scale capacity expansion in cloud analytics and wearable hardware.
- July 6, 2026 – Oura Health Oy secures more than USD 900 million in Series E financing, bringing total capital raised to roughly USD 1.5 billion and implying a valuation of about USD 11 billion, earmarking the proceeds for accelerated global distribution of the Oura Ring, AI-driven health features, and expanded manufacturing and R&D capacity across Europe and North America.
- January 29, 2026 – Apple Inc. acquires Israeli AI company Q.ai for close to USD 2 billion, its largest deal since the USD 3 billion Beats acquisition in 2014, to integrate facial muscle and “silent speech” recognition into next-generation wearables, materially scaling Apple’s AI investment in sensor-rich devices such as Apple Watch and AirPods and reinforcing its wearables, home and accessories segment that generated about USD 35.6 billion in revenue in 2025.
Report Scope
| Report Features | Description |
|---|---|
| Market Value (2025) | USD 89.0 Billion |
| Forecast Revenue (2035) | USD 297.3 Billion |
| CAGR (2026-2035) | 12.9% |
| Base Year for Estimation | 2025 |
| Historic Period | 2020-2024 |
| Forecast Period | 2026-2035 |
| Report Coverage | Revenue Forecast, Market Dynamics, Competitive Landscape, Recent Developments |
| Segments Covered | By Type (Passive and Active), By Technology (IoT Based, AR and VR, and Others), By End Use (BFSI, Education, Fashion, Gaming & Entertainment, Health & Fitness, Logistics & Warehouse, Travel, and Others) |
| Regional Analysis | North America – US, Canada; Europe – Germany, France, The UK, Spain, Italy, Rest of Europe; Asia Pacific – China, Japan, South Korea, India, Australia, Singapore, Rest of APAC; Latin America – Brazil, Mexico, Rest of Latin America; Middle East & Africa – GCC, South Africa, Rest of MEA |
| Competitive Landscape | Xiaomi, WHOOP, SUUNTO, Sony Corporation, Samsung Electronics Co., Ltd., Polar Electro, Oura Health Oy, Nike, Inc., Imagine Marketing Ltd., Huawei Technologies Co., Ltd., Google LLC, Garmin Ltd., Fossil Group, Apple Inc., Adidas AG |
| Customization Scope | Customization for segments and region/country-level will be provided. Moreover, customization can be tailored to the requirements. |
| Purchase Options | We have three licenses to opt for: Single User License, Multi-User License (Up to 5 Users), Corporate Use License (Unlimited Users and Printable PDF) |





































