


Report Overview
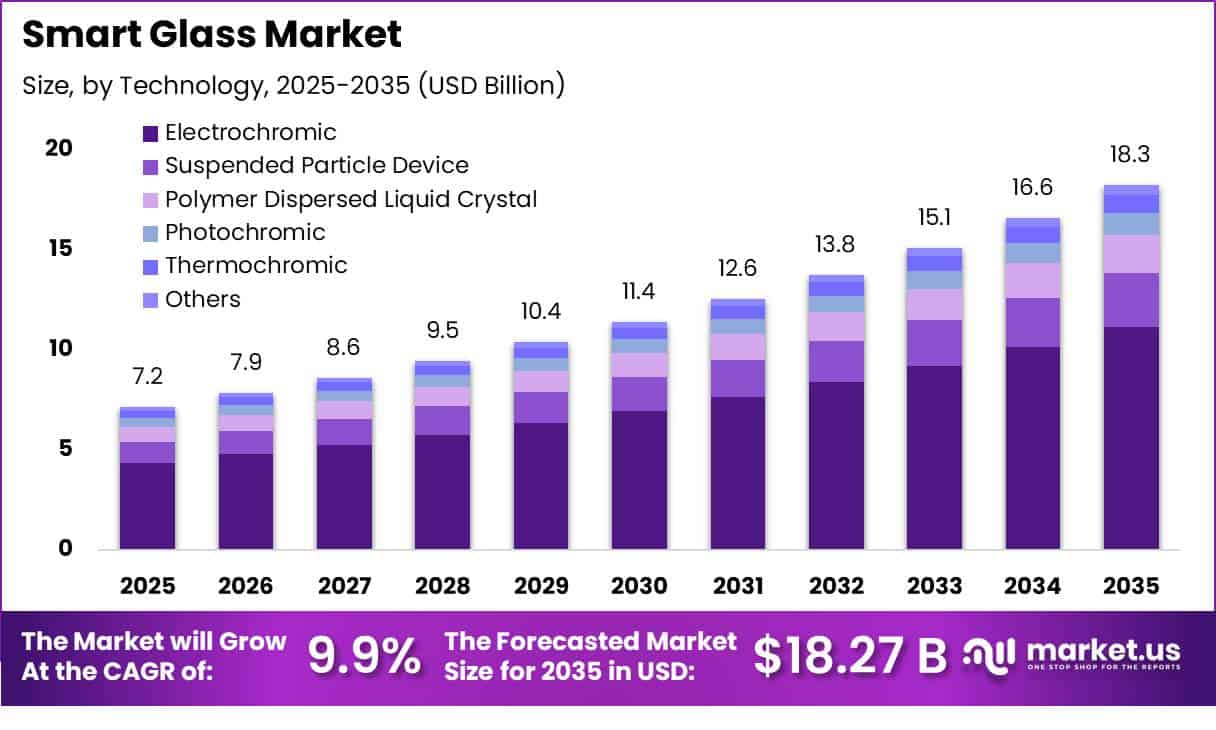
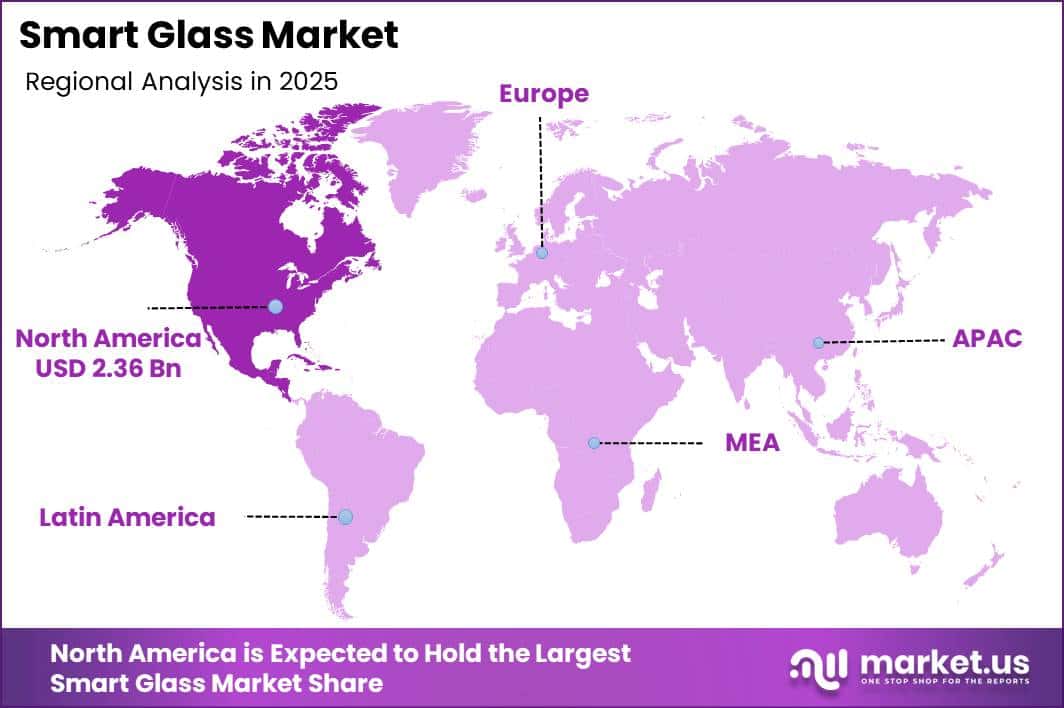
In 2025, the Global Smart Glass Market was valued at USD 7.1 billion. The market is projected to grow at a CAGR of 9.9% during 2026–2035, reaching approximately USD 18.2 billion by 2035. North America dominated the global market in 2025, accounting for more than 33.0% of the total market share and generating approximately USD 2.3 billion in revenue.
The addition of nearly 4 million vehicles within one year creates measurable demand for smart glass sunroofs, dimmable windows, privacy glass, and other advanced glazing systems. China further supported this trend by producing 34.53 million vehicles in 2025, an increase of 10.4%. The construction sector also offers strong growth opportunities.
UNEP reports that buildings and construction represent more than 34% of global energy demand and 37% of energy-related carbon dioxide emissions. In addition, 50% of the total building floor space expected to exist by 2050 has not yet been constructed. This creates significant demand for energy-efficient building materials, including electronically controlled glass that manages heat and daylight. The World Bank states that global building floor area is expanding by 2.3% annually.
Key Takeaway
- The Smart Glass Market was valued at USD 7.1 billion in 2025 and is projected to reach USD 18.2 billion by 2035, growing at a CAGR of 9.9%.
- Electrochromic technology holds around 61.0% of demand, while Suspended Particle Device glass is the fastest-growing technology at roughly 9.8% CAGR.
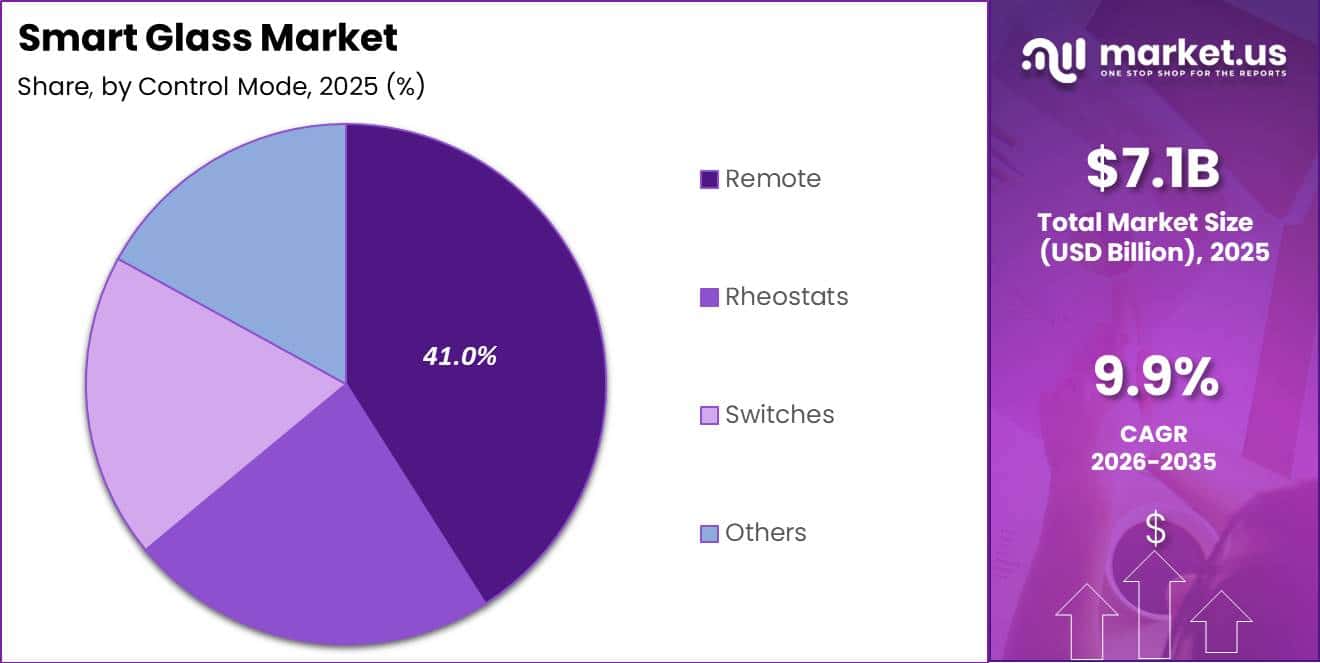
- Remote control mode dominates with around 41.0% share, while Rheostat control mode is the fastest-growing control segment.
- Transportation leads application share at around 48.5%, while power generation is the fastest-growing application.
- Buildings account for more than 34% of global energy demand, reinforcing regulatory-driven demand for dynamic glazing.
- North America led the market in 2025 with more than a 33.0% share and approximately USD 2.3 billion in revenue.
By Technology
Electrochromic technology accounts for around 61.0% of smart glass demand, supported by rising pressure to reduce energy use in buildings and transportation. The global buildings sector consumes more than one-third of total energy and generates nearly 37% of energy- and process-related carbon dioxide emissions. Constructed floor space has also exceeded 260 billion square metres and continues to expand by around 2% per year, creating strong demand for energy-efficient glazing solutions.
Electrochromic glass contains a thin electrochemical layer that changes light transmission when a small electrical voltage is applied. This allows windows and façades to control sunlight, heat, and glare without mechanical blinds. The technology helps lower cooling and lighting requirements in offices, hospitals, airports, and transport hubs.
Suspended Particle Device glass is the fastest-growing technology segment, expanding at around 9.8% CAGR. Its particle-based film can switch from clear to dark within milliseconds. This rapid response makes it suitable for vehicle sunroofs, aircraft windows, and railway glazing, where changing light conditions require fast shading, improved passenger comfort, and better temperature control.
By Control Mode
Remote control mode holds around 41.0% of the Smart Glass Market, supported by its simple design, low cost, and reliable manual dimming performance. It is widely used in commercial and institutional buildings where facility managers prefer wired, panel-based systems connected to existing electrical networks. This creates a large demand base, as global constructed building floor area has already exceeded 260 billion square metres and is expected to expand by another 15% by 2030.
Meanwhile, Rheostat mode is the fastest-growing segment because it allows users to adjust smart glass through wireless remotes, mobile devices, or room-level systems. This flexibility is increasingly valued in premium offices, hotels, and hospitality projects that focus on comfort and dynamic space management. Demand is also supported by efforts to reduce energy costs in a building sector that consumes roughly one-third of global final energy.
By Application
Transportation accounts for around 48.5% of the Smart Glass Market application share, supported by its growing use across automobiles, trains, and aircraft. Glazing is an important functional component in these transport systems, where passenger comfort, energy efficiency, and climate control remain key priorities.
Power generation is the fastest-growing application segment. Solar plants, control rooms, and energy facilities increasingly use advanced glazing to control glare and protect electronic equipment. As renewable energy projects add hundreds of gigawatts of solar and wind capacity, smart glass demand is expected to grow alongside new power infrastructure.
Globally, passenger and freight transport represent nearly 29% of final energy consumption and more than 37% of energy-related carbon dioxide emissions. In addition, the global road vehicle fleet exceeded 1.4 billion units by the early 2020s, creating a large potential market for advanced glazing technologies.
Key Market Segments
By Technology
- Electrochromic
- Suspended Particle Device (SPD)
- Polymer Dispersed Liquid Crystal (PDLC)
- Photochromic
- Thermochromic
- Others
By Control Mode
- Rheostats
- Switches
- Remote
- Others
By Application
- Architectural
- Residential Buildings
- Commercial Buildings
- Transportation
- Automotive
- Aircraft
- Marine
- Consumer Electronics
- Power Generation
Geopolitical Impact Analysis
Geopolitical tensions have become an important cost factor in the Smart Glass Market because production depends on glass substrates, indium-tin-oxide coatings, polymer films, specialty chemicals, and electronic controllers sourced from several countries. WTO tariff profiles show that average applied most-favoured-nation tariffs on industrial products in several major economies have reached the mid-single-digit range, while selected product categories face duties of more than 10%. These measures increase the import cost of float glass, coatings, and chemicals used in electrochromic and Suspended Particle Device smart glass.
Trade disputes between the United States and China have created additional pressure. Tariffs on certain Chinese industrial products have increased from the low single digits to between 10% and more than 25%. Smart glass manufacturers sourcing Chinese glass, indium-tin-oxide materials, polymer films, or electronic parts may therefore experience similar increases in landed costs.
Shipping disruptions are also affecting supply chains. UNCTAD reports that rerouting vessels around conflict-affected maritime corridors has extended Asia-Europe container transit times by 10–20 days. At peak disruption levels, average container freight rates increased by more than 200% compared with pre-disruption levels. This raises transportation expenses and delays deliveries of coated glass panels and laminated units.
Energy price volatility creates further production risks. Brent crude prices have moved between approximately USD 70 and USD 120 per barrel in recent years. Since glass manufacturing requires continuous high-temperature melting and coating processes, fuel and electricity generally represent 15–25% of total production costs. Rising energy, tariff, and freight expenses can therefore increase smart glass prices and encourage manufacturers to develop regional supply networks.
Regional Analysis
North America remains the leading regional market for smart glass, accounting for around 33.0% of global revenue and reaching an estimated value of USD 2.3 billion in 2025. Growth is supported by strict building energy standards, advanced construction practices, and strong adoption of premium vehicle technologies.
Commercial building space in the United States has exceeded 100 billion square feet, creating a large opportunity for electrochromic and Suspended Particle Device glass in offices, hospitals, public buildings, and institutional facilities. Federal and state efficiency rules also encourage the use of high-performance glazing to reduce heat gain, glare, and cooling requirements.
The region further benefits from a strong automotive industry, with the United States producing more than 10 million vehicles annually. Many vehicles fall within mid-range and premium categories that increasingly include panoramic roofs, dimmable windows, and advanced glazing systems.
Asia Pacific is the fastest-growing regional market, with smart glass demand expected to expand at a CAGR of around 10.9% through 2030. Regional revenue is projected to more than double from approximately USD 1.6–1.7 billion in the early 2020s to over USD 3.4 billion by 2030. Growth is driven by rapid urban development, expanding construction activity, and stronger green building standards across China, India, and Southeast Asia.
Key Regions and Countries
North America
- US
- Canada
Europe
- Germany
- France
- The UK
- Spain
- Italy
- Rest of Europe
Asia Pacific
- China
- Japan
- South Korea
- India
- Australia
- Rest of APAC
Latin America
- Brazil
- Mexico
- Rest of Latin America
Middle East & Africa
- GCC
- South Africa
- Rest of MEA
Market Dynamics
Drivers
| Driver | (~) % CAGR | Geographic Relevance | Impact Timeline |
|---|---|---|---|
| Regulated building energy efficiency | +3.0% | North America, Europe, Asia Pacific | Medium term (2 to 4 years) |
| Premium automotive glazing adoption | +2.0% | Global | Short term (2 years or less) |
| Aerospace cabin comfort upgrades | +1.5% | North America, Europe, Middle East | Medium term (2 to 4 years) |
| Localization of advanced glass manufacturing | +1.2% | North America, Asia Pacific | Long term (4 years or more) |
| Integration with building automation systems | +1.0% | Global urban hubs | Medium term (2 to 4 years) |
Regulated building energy efficiency
Regulated building energy-efficiency standards could add around +3.0% to the baseline smart glass CAGR by changing façade and glazing specifications. The buildings sector accounts for more than 34% of global energy consumption and nearly 37% of energy-related carbon dioxide emissions. Governments are therefore introducing stricter building codes, including minimum requirements for solar heat gain and visible light transmission. More than 60% of new commercial floor space added since 2020 across OECD economies is now covered by energy-performance regulations.
Rising electricity costs are also supporting adoption. Commercial power prices in several major economies have increased by around 15–25% since 2021, strengthening demand for solutions that reduce cooling requirements. Smart glass can improve operating margins by approximately 1–3 percentage points in offices, healthcare facilities, and transit hubs. These regulations and measurable energy savings are shifting smart glass from an optional upgrade to a compliance-focused component in high-performance buildings.
Restraints
| Restraint | (~) % CAGR | Geographic Relevance | Impact Timeline |
|---|---|---|---|
| High upfront installation & integration costs | -2.5% | Global | Short term (2 years or less) |
| Interest rate & financing constraints | -1.8% | North America, Europe | Short term (2 years or less) |
| Limited retrofit compatibility in legacy stock | -1.5% | Europe, Asia Pacific | Medium term (2 to 4 years) |
| Supply concentration in key materials | -1.2% | Global | Medium term (2 to 4 years) |
| Conservative procurement practices | -1.0% | Global institutional buyers | Long term (4 years or more) |
High upfront installation & integration costs
High upfront installation and integration costs could reduce the effective smart glass CAGR by around -2.5% by extending return-on-investment periods for building owners and vehicle manufacturers. European Commission case studies indicate that advanced façade upgrades can raise project capital costs by 10–20% compared with conventional double glazing. U.S. Department of Energy data also show that high-performance glazing can require 7 to 12 years to recover its cost in many climates.
Financing pressure further limits adoption, as policy rates in the United States, United Kingdom, and euro area remained around 4–6% during 2024–2026. Higher borrowing and installation costs can cause developers to delay projects or reduce smart glass specifications. In the automotive sector, dimmable glazing may add a few hundred dollars per vehicle, creating challenges for manufacturers operating with margins of only 5–8%. These cost pressures restrict immediate adoption, particularly across mass-market buildings and vehicles.
Challenges
| Challenge | (~) % CAGR | Geographic Relevance | Mitigation Horizon |
|---|---|---|---|
| Complex multi-layer manufacturing yields | -2.0% | Global | Medium term (2 to 4 years) |
| Skilled workforce & installer gaps | -1.7% | North America, Europe | Medium term (2 to 4 years) |
| Long qualification cycles with OEMs | -1.5% | Automotive & aerospace globally | Long term (4 years or more) |
| Limited interoperability with legacy controls | -1.3% | Global buildings | Medium term (2 to 4 years) |
| Durability & warranty risk perception | -1.2% | Global | Long term (4 years or more) |
Complex multi-layer manufacturing yields
Complex multi-layer manufacturing could create around -2.0% friction drag on the attainable smart glass CAGR. Yield losses in electrochromic and SPD stack production raise costs and limit available capacity. Industry data indicate that first-pass yields can fall from above 95% for standard coatings to the mid-80% range for advanced functional layers during early production stages. As a result, nearly 10–15% of output may require rework or disposal.
Specialty coating lines often require investments of several hundred million dollars per facility and typically need utilization rates above 80% to meet return targets. Yield problems can therefore reduce plant margins by around 2–3 percentage points. Manufacturing benchmarks also suggest that lowering defect rates by 5 percentage points can improve productivity by approximately 3–4%. Wider use of automated inspection, sputtering controls, and stable coating chemistries will be necessary to improve throughput, reduce waste, and support affordable smart glass production.
Opportunities
| Opportunity | (~) % CAGR | Geographic Relevance | Execution Window |
|---|---|---|---|
| Smart-retrofit programs for existing buildings | +2.8% | Global, with focus on urban clusters | Medium term (2 to 4 years) |
| Grid-interactive glazing with solar & storage | +2.2% | North America, Europe | Long term (4 years or more) |
| Data-driven comfort & wellness monetization | +1.8% | Global premium assets | Medium term (2 to 4 years) |
| Emerging-market transit infrastructure | +1.5% | Asia Pacific, Middle East, Latin America | Long term (4 years or more) |
| Performance-based service contracts | +1.3% | Global | Medium term (2 to 4 years) |
Smart-retrofit programs for existing buildings
Smart-retrofit programs for existing buildings could add around +2.8% to the baseline smart glass CAGR by opening a large, underused installed market. UNEP and the Global Alliance for Buildings and Construction estimate that more than 70% of the building stock expected to remain in use in 2050 already exists. Much of this stock was developed before modern energy-efficiency standards. Building retrofit investment has grown by around 8–10% annually since 2020, although advanced glazing still receives a limited share compared with insulation and HVAC upgrades.
Allocating even 10–15% of retrofit budgets to dynamic glazing in offices, hospitals, schools, and transport facilities could significantly increase smart glass installations. Façade improvements can deliver verified cooling-energy savings of around 15–25%, allowing utilities to provide incentives that may reduce net installation costs by 20–30%. These savings improve project returns and support performance-based contracts and shared-savings models. However, the opportunity depends on suitable financing, targeted government programs, skilled installers, and stronger awareness among building owners.
Key Players Analysis
The Smart Glass Market has a two-tier competitive structure based on company size, financial strength, and vertical integration. Tier-1 companies include Corning Incorporated, Saint-Gobain S.A., PPG Industries, AGC Inc., and Gentex Corporation. These companies operate through multi-billion-dollar glass, construction-material, and automotive-electronics businesses, providing strong funding for research, production, and global expansion.
Corning reported full-year 2025 core sales of USD 16.4 billion, representing 13% year-over-year growth. Its Specialty Materials segment generated USD 2.2 billion in net sales, an increase of 10%, while net income reached USD 367 million, rising 41%. Saint-Gobain recorded 2025 group revenue of EUR 46.5 billion. It also completed acquisitions representing nearly EUR 860 million in annualized revenue at an average valuation of 8.5 times EBITDA, supporting further expansion in building materials and glazing.
Gentex remains a leading supplier of electrochromic glass and auto-dimming mirrors. Its engineering and research and development spending increased from USD 181.5 million in 2024 to USD 203.3 million in 2025. This investment supported product development despite a 2% quarter-over-quarter decline in light-vehicle production across North America, Europe, and Japan/Korea.
Tier-2 companies include View Inc., Gauzy Ltd., Halio Inc., ChromoGenics, Kinestral Technologies, Research Frontiers Inc., RavenWindow, and Smartglass International. These specialized firms compete through electrochromic and SPD technology, licensing, and application partnerships. Xinyi Glass Holdings, Nippon Sheet Glass, and Guardian Industries strengthen upstream substrate supply, giving larger integrated companies cost and production-scale advantages.
Top Key Players in the Market
- AGC Inc.
- ChromoGenics
- Kinestral Technologies, Inc.
- PPG Industries, Inc.
- RavenWindow
- Research Frontiers Inc.
- Saint-Gobain S.A.
- Showa Denko Materials Co., Ltd.
- Smartglass International Limited
- VELUX Group
- View, Inc.
- Vision Systems
- Corning Incorporated
- Gauzy Ltd.
- Gentex Corporation
- Guardian Industries Holdings, LLC
- Halio Inc.
- Merck KGaA
- Nippon Sheet Glass Co., Ltd.
- Polytronix, Inc.
- Smart Glass Technologies LLC
- Xinyi Glass Holdings Limited
- Diamond Switchable Glass Ltd.
Recent Developments
- In 2025, Gauzy Ltd. introduced its first prefabricated, ready-to-laminate smart glass stack for automotive Tier-1 suppliers and original equipment manufacturers. The product combines dimmable film, conductive components, and adhesive layers into one unit, reducing post-processing requirements and supporting faster vehicle-glass integration.
- In 2025, NSG Group announced a PLN 160 million investment in an advanced architectural glass coating line at its Sandomierz facility in Poland. The fully automated line will apply thin functional coatings that improve energy efficiency and light transmission. Production is scheduled to begin in the first quarter of 2027, while the project is expected to create more than 30 jobs and expand Pilkington’s high-performance coated-glass capacity in Europe.
- In 2025, Corning Incorporated committed up to USD 315 million to expand its Canton, New York, manufacturing facility, supported by up to USD 32 million in CHIPS Act funding. The project is expected to create 130 manufacturing jobs and 175 construction jobs while increasing High-Purity Fused Silica and Ultra-Low Expansion glass output.
Report Scope
| Report Features | Description |
|---|---|
| Market Value (2025) | USD 7.1 Billion |
| Forecast Revenue (2035) | USD 18.2 Billion |
| CAGR (2026-2035) | 9.9% |
| Base Year for Estimation | 2025 |
| Historic Period | 2020-2024 |
| Forecast Period | 2026-2035 |
| Report Coverage | Revenue Forecast, Market Dynamics, Competitive Landscape, Recent Developments |
| Segments Covered | By Technology (Electrochromic, Suspended Particle Device (SPD), Polymer Dispersed Liquid Crystal (PDLC), Photochromic, Thermochromic, Others); By Control Mode (Rheostats, Switches, Remote, Others); By Application (Architectural – Residential Buildings, Commercial Buildings; Transportation – Automotive, Aircraft, Marine; Consumer Electronics; Power Generation) |
| Regional Analysis | North America – US, Canada; Europe – Germany, France, The UK, Spain, Italy, Rest of Europe; Asia Pacific – China, Japan, South Korea, India, Australia, Singapore, Rest of APAC; Latin America – Brazil, Mexico, Rest of Latin America; Middle East & Africa – GCC, South Africa, Rest of MEA |
| Competitive Landscape | AGC Inc., ChromoGenics, Kinestral Technologies, Inc., PPG Industries, Inc., RavenWindow, Research Frontiers Inc., Saint-Gobain S.A., Showa Denko Materials Co., Ltd., Smartglass International Limited, VELUX Group, View, Inc., Vision Systems, Corning Incorporated, Gauzy Ltd., Gentex Corporation, Guardian Industries Holdings, LLC, Halio Inc., Merck KGaA, Nippon Sheet Glass Co., Ltd., Polytronix, Inc., Smart Glass Technologies LLC, Xinyi Glass Holdings Limited, Diamond Switchable Glass Ltd. |
| Customization Scope | Customization for segments, region/country-level will be provided. Moreover, additional customization can be done based on the requirements. |
| Purchase Options | We have three licenses to opt for: Single User License, Multi-User License (Up to 5 Users), Corporate Use License (Unlimited Users and Printable PDF) |





























