
Quick Navigation
Report Overview
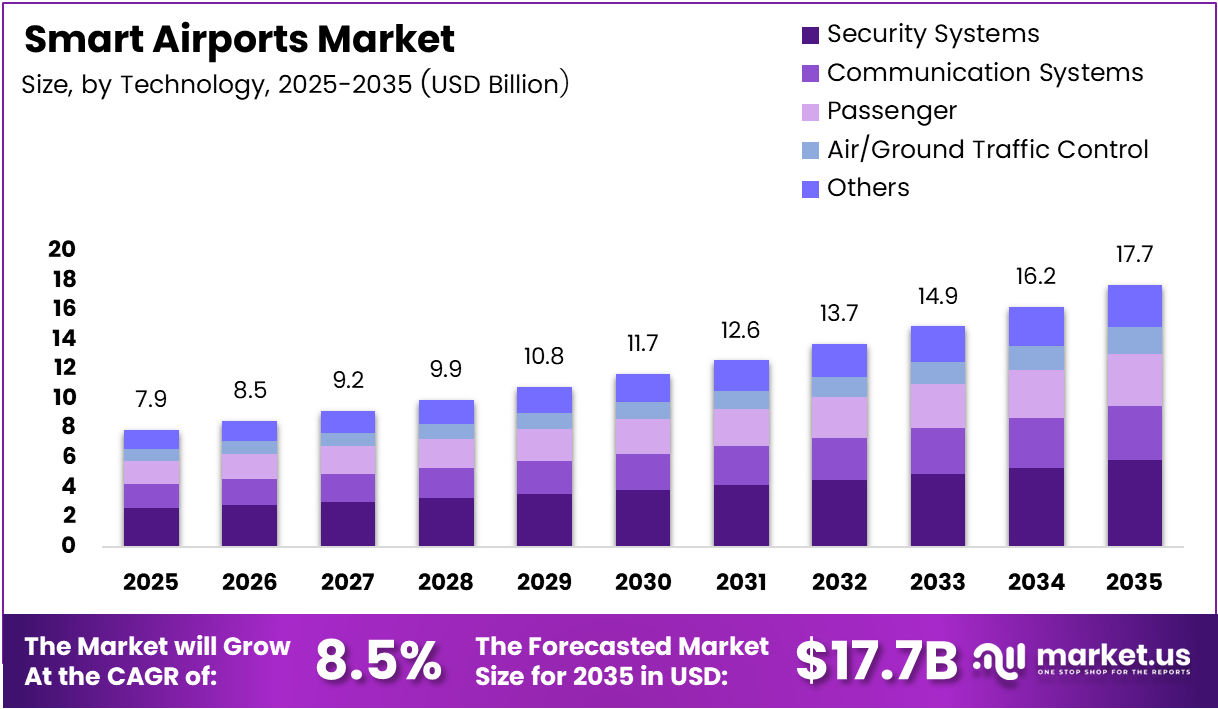
Global Smart Airports Market size is expected to be worth around USD 17.7 Billion by 2035 from USD 7.9 Billion in 2025, growing at a CAGR of 8.5% during the forecast period 2026 to 2035.
Smart airports integrate digital technologies — including IoT sensors, AI analytics, biometric systems, and automated ground handling — into airport operations. This convergence transforms airports from passive transit hubs into data-driven infrastructure assets. Operators gain real-time visibility across airside, terminal, and landside functions simultaneously.
The business case for smart airport investment rests on measurable operational gains. Airports face structural pressure from rising passenger volumes, constrained physical capacity, and tightening emission targets. Digital infrastructure allows operators to process more passengers through existing terminals without proportional capital expansion — a compelling efficiency argument for airport authorities worldwide.
Government-backed modernization programs accelerate technology adoption across both greenfield and retrofit airport projects. National aviation authorities in Asia, the Middle East, and Europe now embed smart infrastructure mandates into new terminal procurement frameworks. This regulatory push converts discretionary capital spending into obligatory upgrades for airport operators.
Security, passenger flow management, and energy optimization represent the three pillars driving technology investment decisions. Airports allocate capital toward biometric identification, automated baggage tracking, and AI-assisted traffic control because these systems directly reduce per-passenger operating costs. The return on investment becomes measurable within two to three operational years for most deployments.
Ezhou Huahu International Airport deployed 255 new energy vehicles on the tarmac with an electrification rate exceeding 80% for ground support equipment — a benchmark that signals the operational standard emerging airports must meet to remain competitive in sustainability-linked airport ratings and regulatory compliance frameworks.
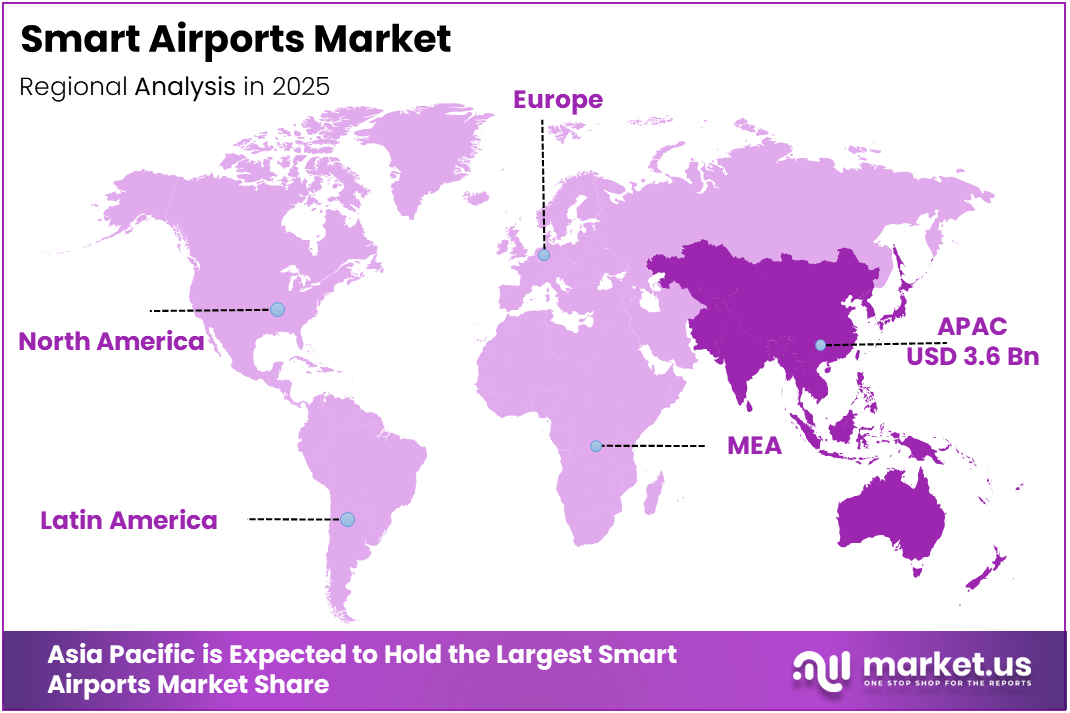
Asia Pacific holds 45.70% of global smart airport market value, equivalent to USD 3.6 Billion in 2025. This concentration reflects the region’s structural advantage: greenfield airport construction in China, India, and Southeast Asia allows developers to embed smart systems from the foundation up, avoiding the costly retrofit complexity that slows adoption in mature Western markets.
The 8.5% CAGR sustained over a decade signals that airport technology vendors face a long procurement cycle with predictable contract renewal patterns. Buyers prioritize interoperability and vendor continuity over lowest-price selection — creating durable revenue streams for established technology integrators and raising barriers for new entrants without proven airport-scale deployments.
Key Takeaways
- The global Smart Airports Market was valued at USD 7.9 Billion in 2025 and is forecast to reach USD 17.7 Billion by 2035.
- The market grows at a CAGR of 8.5% during the forecast period 2026 to 2035.
- By Technology, Security Systems leads with a market share of 32.6%.
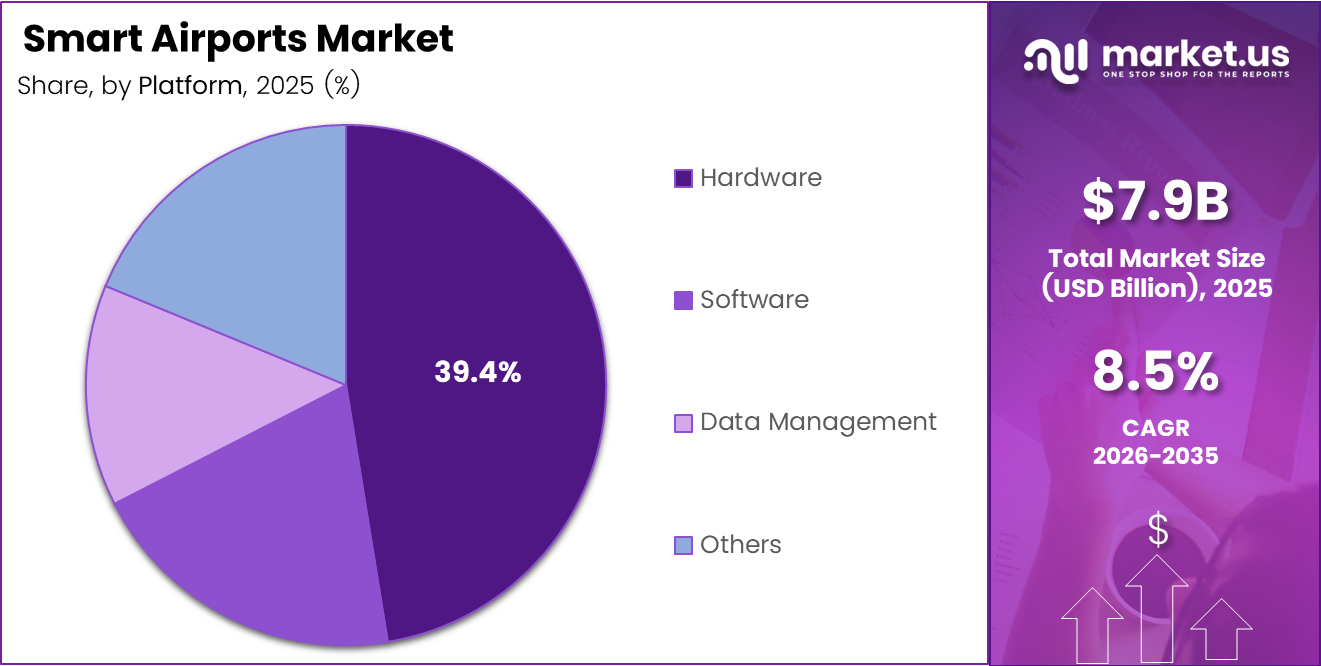
- By Platform, Hardware holds the dominant share at 37.9%.
- By Airport Model, Airport 3.0 holds a 34.1% share.
- By Application, Aeronautical Operations accounts for 65.1% of market revenue.
- By Location, Airside captures 44.5% of market share.
- Asia Pacific dominates globally with 45.70% market share, valued at USD 3.6 Billion in 2025.
Technology Analysis
Security Systems dominates with 32.6% due to mandatory compliance and threat management investment.
In 2025, Security Systems held a dominant market position in the By Technology segment of the Smart Airports Market, with a 32.6% share. Airport operators treat security technology as non-discretionary capital — regulatory mandates from civil aviation authorities require continuous system upgrades, which locks in recurring procurement cycles independent of broader budget pressures.
Communication Systems serve as the operational backbone connecting airside controllers, ground crews, terminal staff, and airline operations centers. Without reliable communication infrastructure, every other smart system — from baggage tracking to biometric boarding — loses its real-time coordination capability. Consequently, communication system contracts typically anchor larger integrated technology deployments.
Passenger, Cargo, and Baggage Ground Handling Control technology addresses one of the costliest operational failure points in airport management. Mishandled baggage and cargo delays generate direct airline compensation costs and erode passenger satisfaction scores. Airports investing in automated handling control reduce these liability exposures while simultaneously improving aircraft turnaround efficiency.
Air/Ground Traffic Control systems sit at the intersection of safety regulation and capacity optimization. Modern traffic control platforms integrate radar data, flight scheduling feeds, and weather analytics to sequence aircraft movements with greater precision. This directly reduces runway idle time — a metric that determines an airport’s effective annual passenger throughput capacity.
Others within the technology segment includes environmental monitoring systems, energy management platforms, and smart lighting controls. These technologies increasingly attract capital as airports face carbon reporting obligations. Ezhou Huahu Airport’s deployment of over 12,000 LED fixtures with smart controls reduced lighting electricity consumption by 36.74% — demonstrating that energy technology delivers financially quantifiable returns alongside compliance benefits.
Platform Analysis
Hardware dominates with 37.9% due to physical sensor and device deployment at scale.
In 2025, Hardware held a dominant market position in the By Platform segment of the Smart Airports Market, with a 37.9% share. Physical infrastructure — including sensors, cameras, biometric scanners, and communication devices — forms the data collection layer that all software and analytics platforms depend upon. Hardware contracts precede and generate downstream software procurement, which explains its leading revenue position.
Software platforms translate hardware-collected data into actionable operational intelligence for airport managers. In April 2025, Amadeus collaborated with Vancouver International Airport to implement a cloud-based passenger handling platform — an example of how software deployments now extend beyond on-premise installations into scalable cloud architectures that reduce long-term IT infrastructure costs for airport operators.
Data Management represents the fastest-shifting layer in the platform stack. Airports generate enormous volumes of structured and unstructured data from security cameras, passenger flow counters, baggage sensors, and aircraft positioning systems. The ability to store, process, and query this data in near-real-time determines how quickly airport operations teams can respond to disruptions — a capability that separates high-performing airports from congestion-prone ones.
Others in the platform segment covers integration middleware, API management tools, and legacy system connectors. Many established airports operate on decades-old IT infrastructure that cannot natively communicate with modern smart systems. Middleware vendors occupy a structurally advantaged position — every major airport modernization project requires integration services regardless of which primary technology vendor wins the core contract.
Airport Model Analysis
Airport 3.0 dominates with 34.1% due to widespread semi-digital operational readiness.
In 2025, Airport 3.0 held a dominant market position in the By Airport Model segment of the Smart Airports Market, with a 34.1% share. Airport 3.0 represents the operational maturity level where digital systems partially automate passenger processing, security, and ground handling. The majority of currently active international airports fall within this category, making it the largest addressable segment for technology vendors today.
Airport 1.0 describes traditional, manually operated airports with limited digital infrastructure. These facilities represent the conversion opportunity — the segment where modernization investment enters at the foundational level. Regional airports in developing economies predominantly occupy this tier, and national aviation infrastructure programs in South and Southeast Asia are systematically upgrading these facilities.
Airport 2.0 airports have adopted selective digital tools — primarily passenger check-in kiosks, basic security screening, and digital flight information displays — without full operational integration. The transition from 2.0 to 3.0 generates the largest individual upgrade contracts because it requires simultaneous hardware, software, and network investment across multiple airport functions.
Airport 4.0 represents fully autonomous, AI-driven airport operations with predictive maintenance, real-time adaptive capacity management, and end-to-end biometric passenger journeys. Currently, only a small number of greenfield projects actively target this specification. However, Airport 4.0 sets the competitive benchmark that shapes procurement specifications across all airport tiers — vendors who cannot demonstrate a credible 4.0 roadmap increasingly struggle in large airport RFP processes.
Application Analysis
Aeronautical Operations dominates with 65.1% due to direct revenue, safety, and regulatory dependency.
In 2025, Aeronautical Operations held a dominant market position in the By Application segment of the Smart Airports Market, with a 65.1% share. Aeronautical functions — runway management, air traffic control, aircraft ground handling, and fuel systems — are operationally mandatory and subject to continuous regulatory oversight. Technology investment here is not discretionary; it directly determines whether an airport maintains its operating license and airline service agreements.
Non-Aeronautical Operations encompasses retail management, parking systems, hotel integrations, and passenger amenity services within the terminal. While this segment currently holds the smaller revenue share, it carries higher margin potential for technology vendors because airports actively seek commercial revenue diversification. Smart retail analytics and dynamic parking pricing systems offer airports a direct revenue uplift beyond aeronautical fee structures.
Location Analysis
Airside dominates with 44.5% due to concentrated safety and operational technology density.
In 2025, Airside held a dominant market position in the By Location segment of the Smart Airports Market, with a 44.5% share. Airside zones — encompassing runways, taxiways, aprons, and aircraft gates — require the highest density of precision sensing, communication, and control technology. Every airside system failure carries direct safety and regulatory consequences, which drives disproportionately high technology investment per square meter compared to other airport zones.
Landside technology serves the passenger-facing entry and exit zones — parking structures, ground transport interfaces, and curbside management systems. Smart landside solutions reduce vehicle congestion, improve pick-up and drop-off flow, and feed real-time occupancy data to navigation applications. Airports with dense surrounding road networks treat landside technology as a critical tool for managing passenger experience before travelers enter the terminal building.
Terminal Side technology spans the interior passenger processing environment — check-in zones, security lanes, retail areas, gate lounges, and baggage claim halls. Terminal-side systems generate the most passenger-visible smart airport experiences: biometric boarding gates, interactive wayfinding, automated retail, and real-time baggage tracking displays. Consequently, terminal-side investment decisions carry both operational and brand differentiation implications for airport operators.
Key Market Segments
By Technology
- Security Systems
- Communication Systems
- Passenger, Cargo, & Baggage Ground Handling Control
- Air/Ground Traffic Control
- Others
By Platform
- Hardware
- Software
- Data Management
- Others
By Airport Model
- Airport 1.0
- Airport 2.0
- Airport 3.0
- Airport 4.0
By Application
- Aeronautical Operations
- Non-Aeronautical Operations
By Location
- Airside
- Landside
- Terminal Side
Drivers
Air Passenger Growth and Digital Transformation Mandates Force Airport Technology Investment
Global air passenger volumes place direct capacity pressure on airport operators who cannot expand physical infrastructure fast enough to match traffic. IoT sensors, automation platforms, and AI-driven traffic control allow airports to increase throughput within existing footprints. This operational math — more passengers without proportional construction spending — is the primary investment rationale behind smart airport procurement decisions.
In October 2024, Adani Airport Holdings partnered with Thales to deploy biometric Fly to Gate systems and cloud-based operations centers across multiple Indian airports. This deployment illustrates how passenger experience mandates now translate directly into biometric and cloud infrastructure contracts. Airports that fail to implement seamless passenger journeys risk losing airline route allocations to competing facilities that offer better connection performance metrics.
Smart mobility solutions — including automated check-in, robotic baggage handling, and real-time wayfinding — reduce per-passenger labor costs while improving schedule adherence rates. Airport operators measure technology ROI through metrics like gate turn time, security queue length, and baggage delivery accuracy. These are the commercial outcomes driving capital allocation decisions at airport boards worldwide, not technology adoption for its own sake.
Restraints
High Capital Costs and Cybersecurity Vulnerabilities Constrain Smart Airport Deployment Speed
Smart airport infrastructure requires simultaneous investment across network, hardware, software, and integration layers — an upfront capital commitment that creates budget approval bottlenecks, particularly for mid-sized airport authorities operating under constrained government funding cycles. The phased procurement model that results from budget limitations often produces fragmented digital environments with interoperability gaps that reduce system efficiency.
Digitally connected airport systems create expanded cybersecurity attack surfaces. Every IoT sensor, biometric database, and cloud-connected operations platform represents a potential entry point for threat actors. In July 2024, Cochin International Airport launched smart gates to accelerate self-immigration processing — a deployment that simultaneously highlights the efficiency gain and the data sensitivity risk of biometric systems handling government-issued identity verification at scale.
Data privacy regulations add legal compliance costs that technology vendors must incorporate into product architecture and service agreements. Airports operating across multiple regulatory jurisdictions — the norm for international gateway facilities — face overlapping and sometimes conflicting data handling requirements. This compliance complexity extends procurement timelines and increases total cost of ownership for connected airport systems beyond initial capital estimates.
Growth Factors
Biometric Identification, AI Optimization, and Smart Energy Systems Open New Revenue and Efficiency Frontiers
Biometric passenger identification removes the paper and card-based friction points from every airport touchpoint — check-in, security, lounge access, and boarding. Airports that implement end-to-end biometric journeys reduce staffing costs at each touchpoint while simultaneously generating higher passenger satisfaction scores. This dual benefit — cost reduction and experience improvement — makes biometric investment one of the highest-priority growth areas in airport technology procurement.
In March 2025, Honeywell launched its Edge-as-a-Service solution for airports to enable real-time data analysis and operational optimization. This product launch signals a market shift toward outcome-based technology contracts where vendors absorb infrastructure investment in exchange for recurring service revenue. For airport operators, this model reduces upfront capital requirements and transfers performance risk to the technology provider — a structural change that accelerates deployment timelines.
A 42.5 MW photovoltaic solar matrix at Ezhou Huahu Airport provides 19.6% of the airport’s electricity needs, generating 40 million kWh annually and reducing carbon emissions by nearly 6,000 tons per year. This performance data reframes smart energy systems from sustainability initiatives into core infrastructure investments — airports that reduce energy costs by nearly one-fifth create a permanent operating cost advantage over facilities without equivalent energy management capabilities.
Emerging Trends
5G Connectivity, Autonomous Systems, and Digital Twin Technology Redefine Airport Operational Architecture
Facial recognition and biometric boarding systems are now entering the mainstream procurement pipeline — no longer pilot programs but full-terminal deployment projects. Airports adopting these systems reduce boarding times per flight by eliminating manual document verification steps. The competitive implication is direct: airlines prioritize scheduling slots at airports that demonstrate faster gate turnaround, creating a measurable commercial incentive for biometric infrastructure investment.
In January 2025, Siemens and Amadeus announced a strategic partnership to integrate airport technology solutions with travel IT platforms for enhanced operations. This cross-sector collaboration signals a convergence trend — airport operators, airlines, and ground handlers increasingly demand unified data environments rather than siloed vendor systems. Technology vendors who cannot demonstrate cross-platform integration capability face displacement by partnership-led integrated solution providers.
Digital twin technology enables airport operators to simulate capacity scenarios, maintenance schedules, and emergency response plans before implementing changes in live operations. The practical value is risk reduction — airports can test new terminal configurations, security lane arrangements, or ground traffic routing patterns in a virtual environment. Early movers in digital twin adoption build institutional data assets that compound in value as the simulation models accumulate operational history.
Regional Analysis
Asia Pacific Dominates the Smart Airports Market with a Market Share of 45.70%, Valued at USD 3.6 Billion
Asia Pacific holds 45.70% of the global Smart Airports Market, valued at USD 3.6 Billion in 2025. This position reflects the region’s structural advantage in greenfield airport development — China, India, and Southeast Asian nations build new airports with smart infrastructure embedded from the design stage, bypassing the retrofit costs that constrain adoption in older, established markets.
North America Smart Airports Market Trends
North America commands a substantial share of global smart airport revenue, supported by large hub airports with high passenger volumes and mature technology procurement infrastructure. Federal aviation investment programs drive security and air traffic control upgrades at major facilities. However, aging terminal infrastructure across many legacy hubs creates integration complexity that slows the pace of full-scale smart system deployment.
Europe Smart Airports Market Trends
Europe’s smart airport investment concentrates at major international gateway airports where passenger volumes justify high technology capital expenditure. EU sustainability mandates and carbon reduction targets push airports toward smart energy management and electric ground handling equipment. The November 2025 Royal Schiphol Group long-term investment program — including new terminals and smart infrastructure upgrades — reflects this dual driver of capacity expansion and regulatory compliance.
Middle East and Africa Smart Airports Market Trends
The Middle East combines greenfield airport construction with national vision programs to position regional hub airports as global transfer centers. Saudi Arabia, the UAE, and Qatar lead technology-intensive airport investments, with multiple biometric, AI, and smart operations contracts awarded across the region in 2024 and 2025. Africa’s smart airport adoption remains nascent but attracts investment in security and communication infrastructure at regional gateway airports.
Latin America Smart Airports Market Trends
Latin America’s smart airport market develops unevenly, with Brazil and Mexico concentrating the majority of technology investment at their largest international facilities. Infrastructure funding gaps constrain broader national rollouts, but private airport concession models are introducing smart technology requirements into new operating agreements. Digital passenger processing and security system upgrades represent the primary entry points for technology vendors in the region.
Key Regions and Countries
North America
- US
- Canada
Europe
- Germany
- France
- The UK
- Spain
- Italy
- Rest of Europe
Asia Pacific
- China
- Japan
- South Korea
- India
- Australia
- Rest of APAC
Latin America
- Brazil
- Mexico
- Rest of Latin America
Middle East & Africa
- GCC
- South Africa
- Rest of MEA
Key Company Insights
SITA occupies a structurally unique position in the smart airports market as a technology provider owned by the air transport industry itself. This cooperative ownership model gives SITA direct access to airline and airport operational data that independent vendors cannot match. In December 2024, SITA partnered with Red Sea International Airport to implement innovative systems in its new main terminal — a deployment that expands its presence in the high-growth Middle East greenfield segment.
Thales S.A. positions itself at the intersection of security, biometrics, and air traffic management — the three highest-spend technology categories in smart airport procurement. This multi-domain footprint gives Thales a competitive advantage in large integrated airport contracts where buyers prefer fewer vendors managing interconnected systems. In October 2025, Thales secured a contract for biometric border control systems with e-gates featuring facial recognition and iris scanning at a new airport project.
Siemens AG leverages its industrial automation heritage to deliver building management, energy optimization, and operational technology systems that other pure-play airport technology vendors cannot replicate at scale. Siemens targets the infrastructure layer beneath the passenger-facing application stack — power management, HVAC automation, and facility control systems. In January 2025, Siemens and Amadeus announced a strategic partnership, combining operational technology depth with passenger IT capability.
Amadeus IT Group approaches the smart airport market from the travel IT side, translating its airline reservation and passenger service system expertise into airport operations platforms. In April 2025, Schiphol Group announced a major investment plan focused on smart technologies, sustainability, and capacity expansion — a market environment directly aligned with Amadeus’s cloud-based passenger handling and airport management product portfolio, where operational software integration drives recurring contract value.
Key Players
- SITA
- Thales S.A.
- Siemens AG
- Amadeus IT Group
- IBM Corporation
- Cisco Systems, Inc.
- Indra Sistemas, S.A.
- Honeywell International Inc.
- L3Harris Technologies, Inc.
- Huawei Technologies Co., Ltd.
Recent Developments
- December 2025 — Abu Dhabi Airport signed an agreement with SITA to develop an Intelligent Total Airport Management platform, bringing AI-driven operational coordination to one of the region’s fastest-growing international gateways and marking a significant integrated smart operations contract for both parties.
- November 2025 — Royal Schiphol Group outlined a long-term investment program covering new terminals and smart infrastructure upgrades at Amsterdam Airport Schiphol, targeting improvements in passenger experience and operational efficiency across one of Europe’s busiest transfer hubs.
- October 2025 — Thales secured a contract for biometric border control systems featuring e-gates with facial recognition and iris scanning at a new airport project, reinforcing its position as a lead provider of identity verification infrastructure for greenfield airport developments.
- June 2025 — Airbus Defence and Space signed an agreement to deploy smart airport digital solutions, including turnaround management platforms, across multiple airports in Saudi Arabia, supporting the Kingdom’s national aviation expansion program under Vision 2030 infrastructure targets.
- November 2024 — Collins Aerospace secured a contract for an advanced airport operational database and resource management system at a major Middle East airport, adding a technology integration capability to one of the region’s high-throughput international facilities.
- 2025–2026 — Ezhou Huahu International Airport installed 82 ground power units replacing aircraft auxiliary power units, achieving 35,000 hours of usage and saving airlines approximately ¥50 million (around USD 7 million) in fuel and maintenance costs — establishing a measurable financial benchmark for electrified ground support equipment adoption.
Report Scope
| Report Features | Description |
|---|---|
| Market Value (2025) | USD 7.9 Billion |
| Forecast Revenue (2035) | USD 17.7 Billion |
| CAGR (2026-2035) | 8.5% |
| Base Year for Estimation | 2025 |
| Historic Period | 2020-2024 |
| Forecast Period | 2026-2035 |
| Report Coverage | Revenue Forecast, Market Dynamics, Competitive Landscape, Recent Developments |
| Segments Covered | By Technology (Security Systems, Communication Systems, Passenger/Cargo/Baggage Ground Handling Control, Air/Ground Traffic Control, Others), By Platform (Hardware, Software, Data Management, Others), By Airport Model (Airport 1.0, Airport 2.0, Airport 3.0, Airport 4.0), By Application (Aeronautical Operations, Non-Aeronautical Operations), By Location (Airside, Landside, Terminal Side) |
| Regional Analysis | North America (US and Canada), Europe (Germany, France, The UK, Spain, Italy, and Rest of Europe), Asia Pacific (China, Japan, South Korea, India, Australia, and Rest of APAC), Latin America (Brazil, Mexico, and Rest of Latin America), Middle East & Africa (GCC, South Africa, and Rest of MEA) |
| Competitive Landscape | SITA, Thales S.A., Siemens AG, Amadeus IT Group, IBM Corporation, Cisco Systems Inc., Indra Sistemas S.A., Honeywell International Inc., L3Harris Technologies Inc., Huawei Technologies Co. Ltd. |
| Customization Scope | Customization for segments, region/country-level will be provided. Moreover, additional customization can be done based on the requirements. |
| Purchase Options | We have three licenses to opt for: Single User License, Multi-User License (Up to 5 Users), Corporate Use License (Unlimited User and Printable PDF) |
Frequently Asked Questions (FAQ)
The smart airports market is expected to reach a value of USD 36.2 billion by 2032.
The smart airports market is estimated to register the highest CAGR of 8.8% during the forecast period from 2023 to 2032.
The growth of the smart airports market is being driven by technological advancements and the focus on green initiatives in the aviation industry.
The passenger-cargo baggage control segment is the dominant technology type in the smart airports market, accounting for the majority share of 34.6%.
The growing air passenger travelling is the biggest opportunity for the smart airports market, as air travel has become an increasingly popular option for tourists, resulting in significant growth in the tourism sector.


