Global Security Safes Market By Type (Cash Management Safes, Gun Safes, Media Safes, and Other Types), By Technology (Mechanical Locks, Digital/Electronic Locks, and Smart Locks), By End-User (Residential Commercial, Industrial, Government and Public Institutions), By Region and Companies - Industry Segment Outlook, Market Assessment, Competition Scenario, Trends, and Forecast 2023-2032
- Published date: Nov. 2023
- Report ID: 16489
- Number of Pages: 210
- Format:
-
keyboard_arrow_up
Quick Navigation
Report Overview
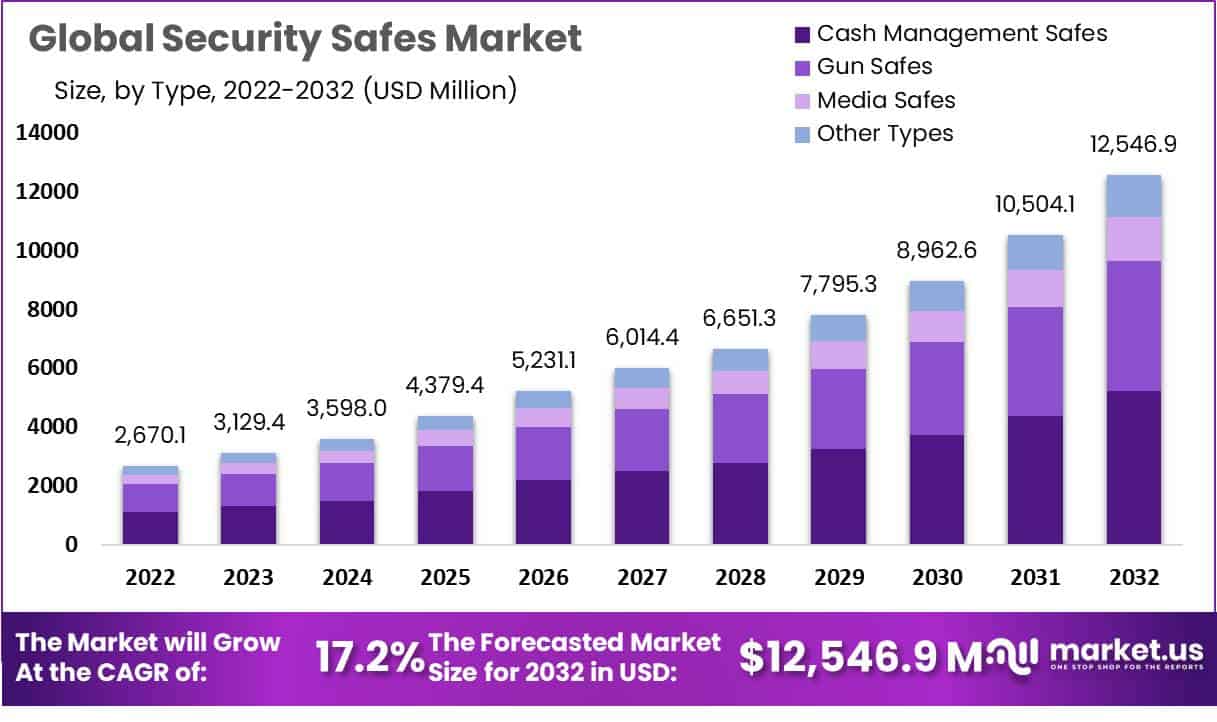
According to a Market.us report, the global security safe market is projected to expand at 17.2% CAGR during the forecast period 2023 to 2032. Valuation is poised to be worth USD 3,129.4 Million in 2023. By 2032, the global market is set to witness a total of USD 12,546.9 Million. The market stood at a total of USD 2,670.1 Million at the end of 2022.
A security safe is a sturdy and locked container designed to safeguard valuable items from theft, damage, or unauthorized access. These safes come in various sizes and designs, catering to diverse needs, such as protecting cash, jewelry, important documents, or firearms. Security safes are typically constructed with robust materials like steel and equipped with advanced locking mechanisms, such as combination locks, electronic keypads, or biometric scanners.
They offer peace of mind by providing a secure storage solution for sensitive or valuable belongings in homes, businesses, and financial institutions. Investing in a reliable security safe is essential for protecting assets and ensuring privacy and security.

Note: Actual Numbers Might Vary In The Final Report
Key Takeaways
- In 2022, the Global Security Safes Market was valued at US$ 2,670.1 Million.
- The Market is estimated to register the highest CAGR of 17.2% between 2023 and 2032.
- Increasing Concerns Over Theft and Burglary Drives the Market Growth.
- Increasing Technological Advancements are expected to have a negative impact on the market.
- Based on type, the Cash management safes segment dominates the market with a massive revenue share in 2022.
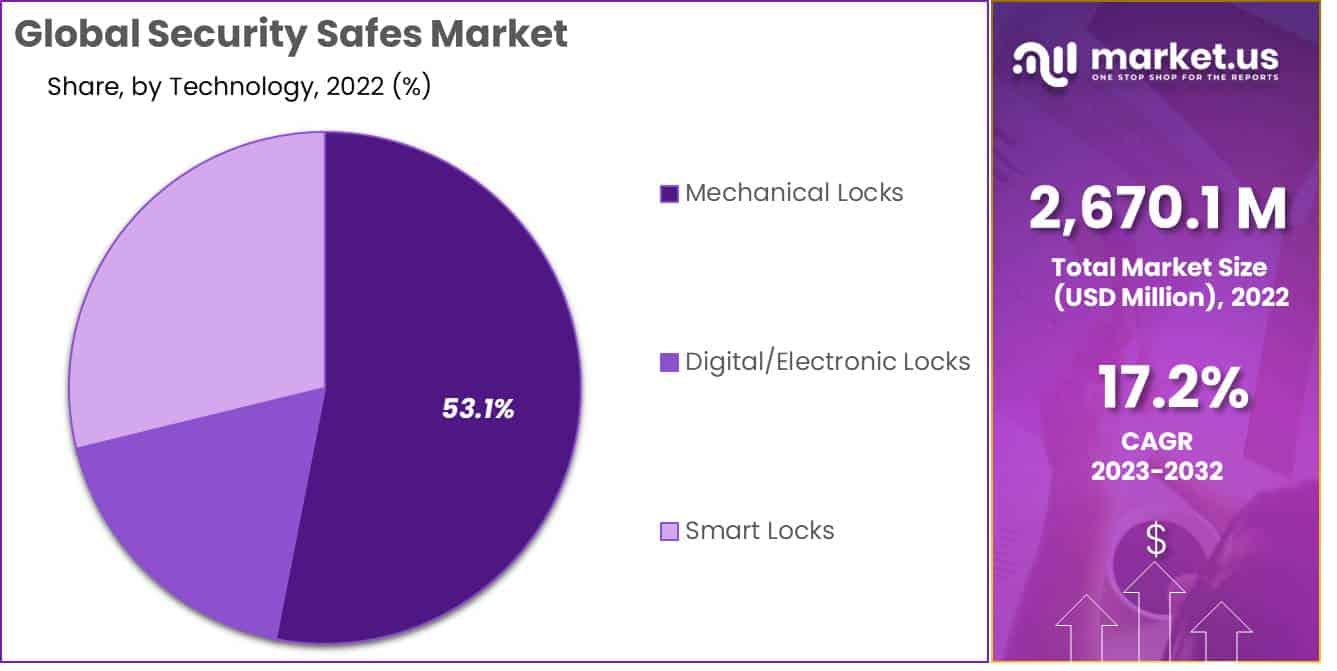
- Based on technology, Smart Locks dominates the market in 2022 with a major revenue share.
- Based on End-User, the Commercial Segment dominates the market.
- Increasing Concerns about Personal and Corporate Security Expected to Create Many Lucrative Opportunities over the Forecast Period.
- Biometric Authentication Integration is the latest trend in the market.
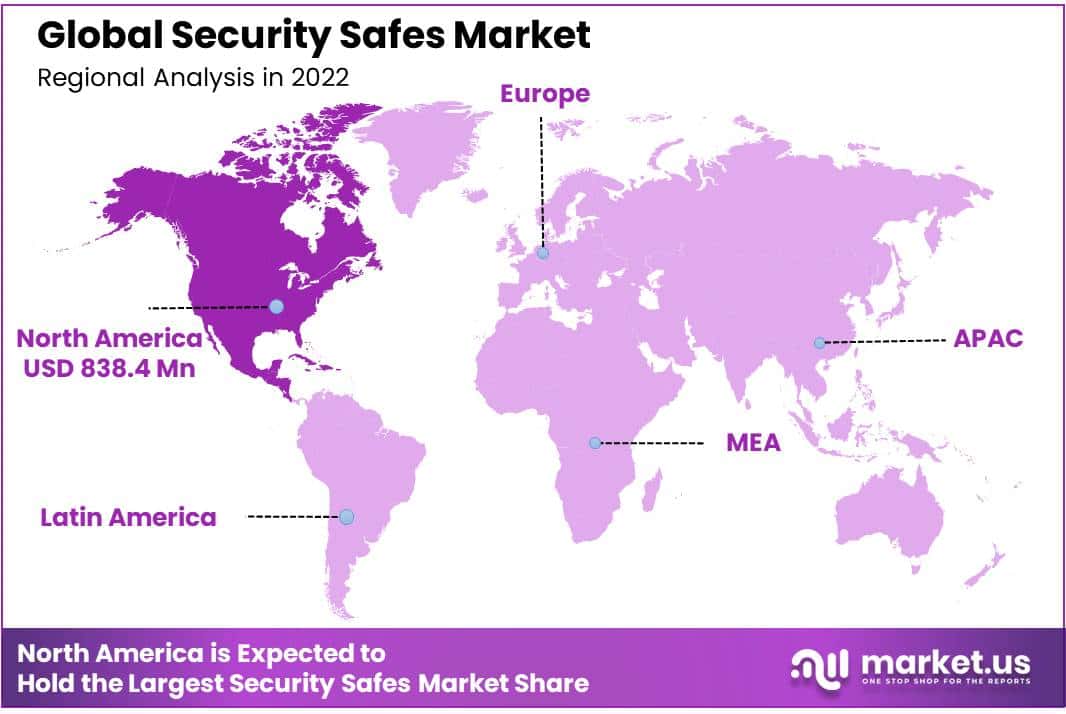
- Based on Region, North America dominates the market with a major revenue share of 31.4%.
- Some of the key players in the market are American Security Products Company, Liberty Safe and Security Products, Godrej & Boyce Manufacturing Company Limited, Gunnebo AB, Access Security Products Ltd., Alpha Bravo Holdings Company Inc., and Others.
Driving Factor
Increasing Concerns Over Theft and Burglary Drives the Market Growth.
The increasing concerns related to theft and burglaries have played a crucial role in driving the growth of the Global Security Safes Market. In a world where crime rates vary widely, individuals, businesses, and institutions are placing a higher emphasis on safeguarding their valuable possessions. This heightened focus on security has led to a notable surge in the demand for secure storage solutions, particularly security safes. These safes are purpose-built to provide a robust defense against unauthorized access, ensuring the protection of essential documents, cash, jewelry, and firearms. Furthermore, as security threats continue to evolve and adapt, the market anticipates a growing need for advanced safes equipped with features like biometric authentication and fire resistance, further propelling market expansion.
Restraining Factor
Increasing Technological Advancements Hinder the Market Growth in 2022.
While technology has brought about many innovations in the security industry, it has also posed challenges for traditional security-safe manufacturers. Advanced electronic security systems, biometric authentication, and smart home automation have gained popularity, providing consumers with alternative methods of safeguarding their valuables. These technological alternatives can divert potential customers away from traditional security safes. Additionally, as technology evolves, it can lead to shorter product lifecycles for safes, requiring manufacturers to invest in research and development to stay competitive, which can be costly.
Growth Opportunity
Increasing Concerns about Personal and Corporate Security Expected to Create Many Lucrative Opportunities over the Forecast Period.
Safes equipped with biometric authentication, IoT connectivity, and remote monitoring capabilities are in high demand. Capitalizing on this trend by developing cutting-edge security solutions can be lucrative. Additionally, there is a growing need for eco-friendly safes. Manufacturing environmentally sustainable safes using recycled materials and energy-efficient processes can meet this demand and appeal to conscious consumers. These opportunities allow businesses to tap into a burgeoning market while addressing evolving customer needs.
Latest Trends
Biometric Authentication Integration
One of the latest trends in the Global Security Safes Market is the widespread integration of biometric authentication technology. Traditional safes typically rely on combination locks or keys for access, which can be vulnerable to theft or misplacement. In response, manufacturers incorporate biometric features such as fingerprint recognition, retinal scanning, or facial recognition into their safes. These advanced authentication methods offer a higher level of security by ensuring that only authorized individuals can access the contents of the safe. This trend enhances security and adds convenience for users, making it a popular choice in residential and commercial applications.
By Type Analysis
Cash management safes Segment Dominated in the market in 2022.
In 2022, Cash management safes have emerged as a dominant force in the Global Security Safes Market with a major revenue share, and their prominence can be attributed to their extensive utility across various industries. These safes are an indispensable asset for enterprises involved in frequent cash transactions, from financial institutions and retail establishments to restaurants and households. The crux of their dominance stems from the paramount necessity to safeguard cash and other invaluable assets against the peril of theft and unauthorized intrusion.
By Technology Analysis
Smart Locks Segment Leads the Market with Major Revenue Share in 2022.
The global smart safes market presents three distinct lock segments: Mechanical, Digital/Electronic, and Smart Locks. Among these, Smart Locks emerge as the dominant segment. This ascendancy is attributable to the relentless march of technology, which has ushered in a new era of security and convenience. Smart Locks have won over residential and commercial users with their remote access capabilities, real-time monitoring, and seamless integration with mobile apps and smart home systems. The ever-increasing emphasis on security and ease of use in our interconnected world places Smart Locks at the forefront of the market, eclipsing the older mechanical and digital lock technologies.

Note: Actual Numbers Might Vary In The Final Report
By End-User Analysis
Commercial Segment Leads the Market with Major Revenue Share in 2022.
The Commercial sector emerges as the dominant global smart safes market segment. This predominance is underpinned by the escalating need for advanced cash management and secure monetary handling solutions within the corporate landscape, encompassing retail establishments, eateries, and financial institutions. Commercial entities seek smart safes to streamline cash operations, mitigate theft risks, and optimize overall operational efficacy.
Furthermore, the prevailing shift towards cashless transactions has heightened the demand for smart safes among enterprises still reliant on physical currency. Consequently, the commercial segment commands a substantial share of the smart safes market, chiefly driven by its pivotal role in bolstering cash security and operational efficiency.
Key Market Segmentation
Based on Type
- Cash Management Safes
- Gun Safes
- Media Safes
- Other Types
Based on Technology
- Mechanical Locks
- Digital/Electronic Locks
- Smart Locks
Based on End-User
- Residential
- Commercial
- Industrial
- Government and Public Institutions
Geopolitics and Recession Impact Analysis
- Supply Chain Disruptions: Certainly, geopolitical instability, like conflicts or sanctions on certain nations, can indeed disrupt the supply chains for materials needed in safe production. Such disruptions often result in delays, shortages, or higher manufacturer costs. These challenges can significantly impact the safe industry, making it essential for companies to navigate these complex geopolitical dynamics carefully and diversify their supply sources to ensure a stable production process.
- Market Expansion: Geopolitical factors, like stability or instability, can significantly impact the expansion strategies of security-safe manufacturers. These companies often make decisions to enter or exit specific markets after conducting thorough assessments of political risks and uncertainties. Such assessments are critical in shaping their global business strategies.
- Consumer Demand: During economic downturns, people often become more cautious and focus on safeguarding their assets. This can result in a higher demand for security safes as individuals seek to protect their valuable possessions during uncertain times.
- Construction and Real Estate: Recessions can substantially impact the construction and real estate industries, which are closely tied to the demand for security safes. When economic downturns occur, there are several ways in which these industries can be affected, ultimately leading to a slowdown in the installation of safes in new buildings.
Regional Analysis
North America Dominates the Market with a Major Revenue Share of 31.4%.
In 2022, North America asserted its dominance in the global market, accounting for a significant revenue share of over 31.4%. North America region is supreme in the Global Security Safes Market due to several compelling factors. Firstly, the region’s economic prowess generates substantial demand for secure storage solutions, attracting both businesses and individuals. Secondly, the stringent security regulations enforced here and the rising awareness of asset protection reinforce this market’s growth.
Moreover, North America hosts key industry players and remains at the forefront of security-safe technology, bolstering its dominant position in the global market. These factors collectively establish North America’s unassailable dominance in security safes.

Note: Actual Numbers Might Vary In The Final Report
Key Regions and Countries Covered in this Report
- North America
- The US
- Canada
- Europe
- Germany
- France
- The UK
- Spain
- Italy
- Russia
- Netherland
- Rest of Europe
- APAC
- China
- Japan
- South Korea
- India
- Australia
- New Zealand
- Singapore
- Thailand
- Vietnam
- Rest of APAC
- Latin America
- Brazil
- Mexico
- Rest of Latin America
- Middle East & Africa
- South Africa
- Saudi Arabia
- UAE
- Rest of MEA
Key Player Analysis
The global security safes market is characterized by intense competition among key players. Market leaders like Chubb, Gunnebo, and Godrej dominate with substantial market share due to their strong brand presence and innovative product offerings. Regional players, including AMSEC and Hollon, also play a significant role, particularly in North America. Market growth is driven by rising security concerns, increased adoption of digital safes, and expanding commercial sectors.
Emerging economies like China and India are witnessing a surge in demand, creating growth opportunities. The market is expected to continue its upward trajectory, with key players focusing on technological advancements and strategic partnerships to maintain their competitive edge.
Market Key Players
- American Security Products Company
- Liberty Safe and Security Products
- Godrej & Boyce Manufacturing Company Limited
- Gunnebo AB
- Access Security Products Ltd
- Alpha Bravo Holdings Company Inc.
- SentrySafe
- Honeywell International Inc
- First Alert Inc.
- Gardall Safe Corporation
- BARSKA Optics
- Dormakaba Holding AG
- Deere & Company
- Other Key Players
Recent Developments
- In November of 2021, Godrej Security Solutions unveiled a new product called Godrej INTELI-ACCESS, specifically designed to enhance the security of safe deposit lockers.
Report Scope
Report Features Description Market Value (2023) US$ 3,129.4 Mn Forecast Revenue (2032) US$ 12,546.9 Mn CAGR (2023-2032) 17.2% Base Year for Estimation 2022 Historic Period 2016-2022 Forecast Period 2023-2032 Report Coverage Revenue Forecast, Market Dynamics, COVID-19 Impact, Competitive Landscape, Recent Developments Segments Covered By Type (Cash Management Safes, Gun Safes, Media Safes, and Other Types), By Technology (Mechanical Locks, Digital/Electronic Locks, and Smart Locks), By End-User (Residential Commercial, Industrial, Government and Public Institutions) Regional Analysis North America – The U.S. & Canada; Europe – Germany, France, The UK, Spain, Italy, Russia, Netherlands & Rest of Europe; APAC- China, Japan, South Korea, India, Australia, New Zealand, Singapore, Thailand, Vietnam & Rest of APAC; Latin America- Brazil, Mexico & Rest of Latin America; Middle East & Africa- South Africa, Saudi Arabia, UAE & Rest of MEA Competitive Landscape American Security Products Company, Liberty Safe and Security Products, Godrej & Boyce Manufacturing Company Limited, Gunnebo AB, Access Security Products Ltd, Alpha Bravo Holdings Company Inc., SentrySafe, Honeywell International Inc, First Alert Inc., Gardall Safe Corporation, BARSKA Optics, Dormakaba Holding AG, Deere & Company Customization Scope Customization for segments, region/country-level will be provided. Moreover, additional customization can be done based on the requirements. Purchase Options We have three licenses to opt for Single User License, Multi-User License (Up to 5 Users), Corporate Use License (Unlimited User and Printable PDF) Frequently Asked Questions (FAQ)
What are security safes, and what are they used for?Security safes are specially-made containers designed to safeguard valuable items against theft, damage and unauthorised access. They are often used to store cash, jewelry, important documents and other important valuables.
How big is security safe market?According to a Market.us report, the global security safe market is projected to expand at 17.2% CAGR during the forecast period 2023 to 2032. Valuation is poised to be worth USD 3,129.4 Million in 2023. By 2032, the global market is set to witness a total of USD 12,546.9 Million. The market stood at a total of USD 2,670.1 Million at the end of 2022.
How do I choose the right security safe for my needs?When selecting a security safe, consider factors such as the size, level of security (fireproof, waterproof, etc.), locking mechanism, and the type of items you intend to store. It is also important to consider the location where the safe will be placed, such as a home, office, or retail store.
What are the key drivers of Security Safes Market growth?Key factors driving Security Safes Market growth:
- Rise in Crime Rates: Soaring global crime rates have contributed to an upsurge in demand for security safes. People increasingly seek ways to protect their valuables against theft and burglaries.
- Growing awareness about security: Security Safes Are Becoming More Popular: There has been an increased concern for security among people. More individuals now understand the risks involved with leaving valuables exposed, leading to greater demand for safes.
- Technological Advancements: Technological advancements have led to more sophisticated and secure security safes, making them more appealing to consumers.
Which region has the highest demand for Security Safes Market?North America: North America has the highest demand for security safes. This is due to a number of factors, including high crime rates, growing awareness about security, and high disposable incomes.
What are the latest innovations in Security Safes Market?Latest Trends in Security Safes Market:
- Biometric Safes: Biometric safes are more secure than traditional safes that utilize keys or combinations, due to using biometric authentication methods like fingerprint scanning, facial recognition and voice recognition to open them. This makes biometric safes an increasingly popular solution.
- Smart safes: Connected to the internet and accessible remotely using a smartphone app, smart safes enable users to monitor their safe remotely and receive alerts should any discrepancies arise.
- Fireproof and waterproof safes: Fireproof and waterproof safes offer valuables a measure of protection from fire, water, and other dangers, which is becoming more popular as people become aware of natural disasters and emergencies.

-
-
- American Security Products Company
- Liberty Safe and Security Products
- Godrej & Boyce Manufacturing Company Limited
- Gunnebo AB
- Access Security Products Ltd
- Alpha Bravo Holdings Company Inc.
- SentrySafe
- Honeywell International Inc
- First Alert Inc.
- Gardall Safe Corporation
- BARSKA Optics
- Dormakaba Holding AG
- Deere & Company


