


Report Overview
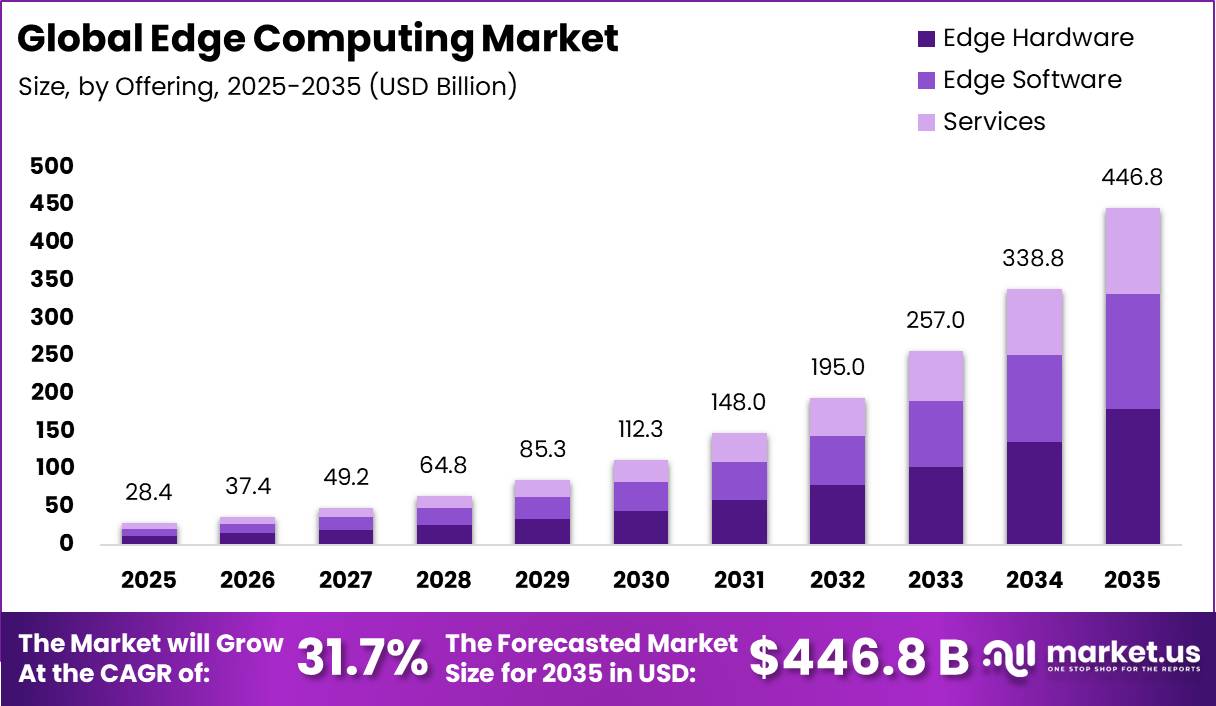
The Global Edge Computing Market size is expected to reach around USD 28.4 billion by 2035, up from USD 446.8 billion in 2025, growing at a CAGR of 31.7% during the forecast period from 2025 to 2035. North America held a dominant market position, capturing more than 34.2% share and generating USD 97 billion in revenue.
The GSMA reported 5G connections crossed 2 billion in 2024, while the International Telecommunication Union said global internet users reached 5.5 billion in 2024. These connected users and devices create large real-time workloads. The IEA also reported that data centers and data transmission networks used about 460 TWh of electricity in 2022, which pushes firms to process more data closer to end users and devices. Edge computing helps cut latency, reduce backhaul traffic, and support AI inference at industrial sites, retail stores, vehicles, telecom nodes, and healthcare facilities.
The U.S. Census Bureau reported U.S. manufacturing shipments of computers and electronic products above USD 400 billion in 2023, which supports local demand for industrial edge hardware and embedded systems. The Federal Communications Commission also reported more than 330 million wireless subscriber connections in the U.S., creating a large base for low-latency edge services. Canada adds demand through cloud adoption, smart manufacturing, and 5G network upgrades. Together, these factors give North America a dense base of hyperscale providers, enterprise buyers, telecom operators, and device makers that can deploy edge infrastructure at scale.
Key Takeaways
- The Edge Computing Market stood at USD 28.4 billion in 2025 and will reach USD 446.8 billion by 2035.
- The market will grow at a 31.7% CAGR during 2026 to 2035.
- By offering, Edge Hardware leads with a 40.3% share.
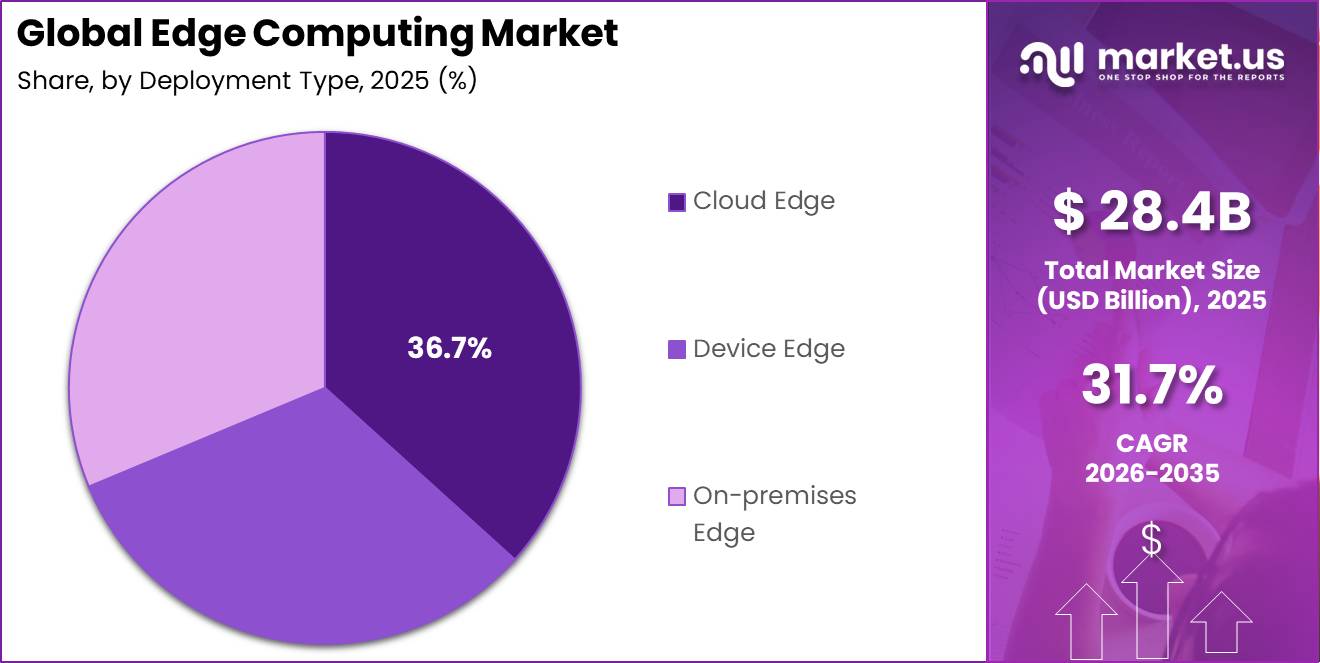
- By deployment type, Cloud Edge leads with a 36.7% share.
- By organization size, Large Enterprises lead with a 70.4% share.
- By application, IoT & Industrial Automation leads with a 27.3% share.
- By industry vertical, Manufacturing leads with a 20.7% share.
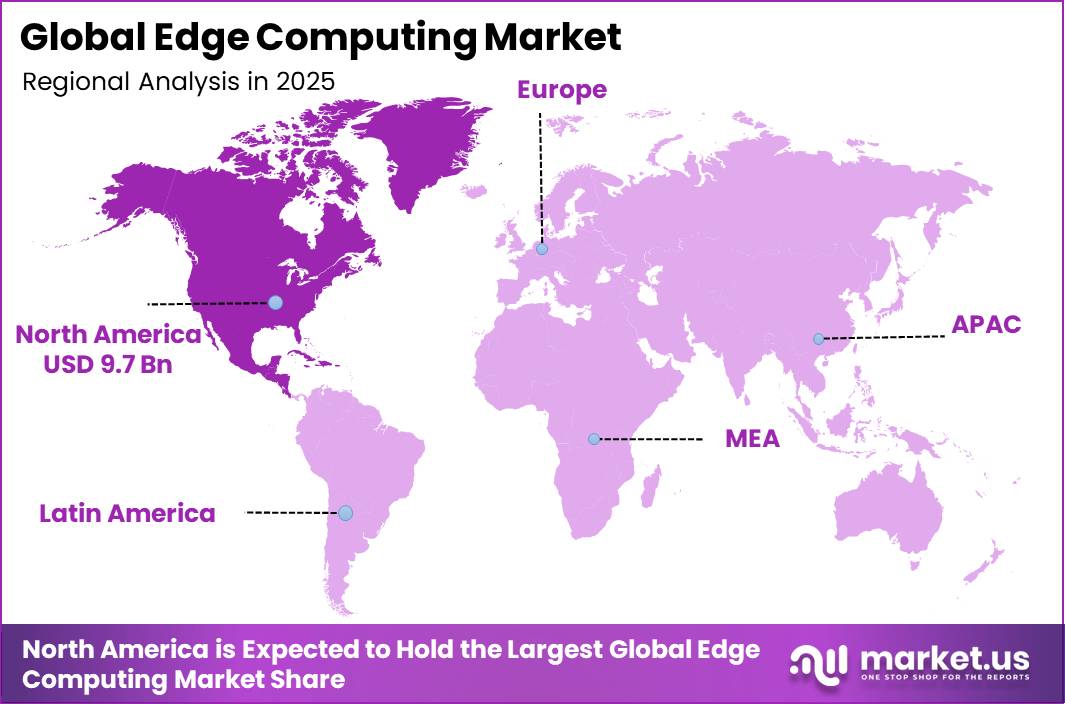
- North America leads the market with a 34.2% share and USD 9.7 billion in revenue.
By Offering
Edge Hardware leads the Edge Computing Market with a 40.3% share because companies still need physical systems close to machines, stores, towers, vehicles, and sensors before they can run edge workloads. Servers, gateways, routers, storage units, and rugged devices give firms the local compute power that low-latency work needs.
Dell reported Infrastructure Solutions Group revenue of $43.6 billion in fiscal 2025, up 29%, which shows strong enterprise spending on servers, storage, and networking systems that support distributed computing. Cisco also reported fiscal 2025 revenue of $56.7 billion, reflecting the scale of network equipment demand that edge sites require.
By Deployment Type
Cloud Edge holds the top position with 36.7% share because enterprises already use public cloud platforms and want a simple way to extend cloud tools closer to users and devices. This model lets teams manage edge apps, data, and security through familiar cloud consoles while reducing delays for local workloads.
Microsoft reported Intelligent Cloud revenue of $29.9 billion in the quarter ended June 30, 2025, up 26%, showing strong demand for cloud platforms that can support edge-linked workloads. In another quarter, Microsoft reported Intelligent Cloud revenue of $32.9 billion, up 29%, which points to continued cloud-led expansion.
Device Edge grows fastest because cameras, robots, vehicles, medical tools, and smart retail systems now need decisions on the device itself. Firms use device-level processing when they cannot wait for cloud response or cannot send all data to a data center. This need grows as more AI models run on local chips and as firms try to cut bandwidth cost.
By Organization Size
Large Enterprises dominate the Edge Computing Market with 70.4% share because they run many sites, carry more data, and need stronger control over latency, security, and uptime. Large banks, factories, telecom firms, retailers, and logistics groups can fund edge servers, private networks, software teams, and long-term service contracts.
The OECD states that small and medium-sized enterprises represent 99% of all businesses, which also means large enterprises form a much smaller group with far higher average technology spend per firm. OECD data also shows SMEs employ about two out of three workers, yet large firms often hold deeper capital budgets for multi-site digital programs.
By Application
IoT & Industrial Automation leads with a 27.3% share because factories, utilities, warehouses, and transport networks already use connected sensors, controllers, cameras, and machines that need fast local processing. These systems create constant data, and plants cannot wait for distant cloud systems when they need to stop a machine, adjust a line, or detect a fault.
The International Federation of Robotics reported 542,000 industrial robots installed worldwide in 2024, showing the large base of automated equipment that can use edge computing. It also reported 4,664,000 industrial robots in operation worldwide in 2024, up 9%, which strengthens the case for local compute near production assets. Edge AI & Inference grows fastest because firms want AI decisions where events happen.
By Industry Vertical
Manufacturing leads the Edge Computing Market with a 20.7% share because plants need fast, stable control across machines, robots, sensors, quality systems, and safety tools. Edge systems help manufacturers inspect products, predict machine issues, reduce downtime, and keep lines running even when cloud links slow down. IFR data for 2023 showed 4,281,585 robots operating in factories worldwide, proving that factories already have a large connected asset base that needs local computing.
The same source reported that 276,288 industrial robots were installed in China in 2023, equal to 51% of global installations, which shows how large manufacturing hubs drive edge demand. Retail & Consumer Goods grows fastest because stores now compete on real-time stock, checkout speed, price changes, video analytics, and personalized offers.
The U.S. Census Bureau reported first-quarter 2026 retail e-commerce sales of $326.7 billion, up 2.7% from the prior quarter, while total retail sales reached $1,929.0 billion. Retailers use edge to link online and store data faster, so growth accelerates as shopping becomes more digital and more local at the same time.
Key Market Segments
By Offering
- Edge Hardware
- Edge Software
- Services
By Deployment Type
- Cloud Edge
- Device Edge
- On-premises Edge
By Organization Size
- Large Enterprises
- Small and Medium-Sized Enterprises
By Application
- IoT and Industrial Automation
- Edge AI and Inference
- Content Delivery and Media
- Immersive and Interactive Experiences
- Real-time Processing and Control
- Others
By Industry Vertical
- Manufacturing
- Retail and Consumer Goods
- Automotive
- Energy and Utilities
- Healthcare and Life Sciences
- Media and Entertainment
- Software and IT Services
- Telecommunications
- Transportation and Logistics
- Other
Geopolitical Impact Analysis
Geopolitical tension raises costs for edge servers, gateways, chips, storage systems, and networking equipment because the market depends on semiconductors, memory, power systems, and cross-border electronics trade. The WTO reported that world merchandise trade volume fell 1.1% in 2023, which reduced slack in electronics supply chains and increased lead-time risk for hardware buyers.
U.S. Section 301 tariffs still apply to many China-origin electronics at rates of 7.5% to 25%, and these rates affect printed circuit assemblies, routers, industrial computers, and related equipment used in edge deployments. The World Bank reported that energy prices fell 29.9% in 2023 after the 2022 shock, but fuel volatility still affects air freight, ocean shipping, and data center backup power costs.
Shipping disruption also affects deployment schedules for distributed edge sites. UNCTAD reported that rerouting around the Cape of Good Hope can add 10 to 14 days to Asia-Europe voyages, while longer routes increase fuel use and container costs. The World Shipping Council reported that the Red Sea crisis cut Suez Canal transits and shifted vessel capacity to longer lanes, which delayed electronics cargo and spare parts.
Regional Analysis
North America leads with a 34.2% share and a USD 9.7 Billion market value.
North America dominates the Edge Computing Market, holding a 34.2% share and generating USD 9.7 billion in revenue. The region leads because enterprises deploy cloud, AI, 5G, and automation together across factories, stores, hospitals, telecom networks, and media platforms. The United States gives the region its largest demand base.
Asia Pacific is the fastest-growing region in the Edge Computing Market. China, Japan, South Korea, India, and Australia drive growth through 5G, smart factories, online retail, digital payments, gaming, and AI use. China leads in industrial IoT scale, while India adds fast demand from cloud regions, telecom expansion, and startup-led software services. Japan and South Korea use edge systems in robotics, automotive electronics, and advanced manufacturing.
Europe holds a strong position in edge computing because manufacturers, automakers, utilities, telecom operators, and public agencies invest in secure local data processing. Germany drives industrial demand through automation and machine vision, while France and the UK support cloud and telecom edge projects. The European Commission targets 10,000 climate-neutral edge nodes by 2030 under its digital infrastructure goals.
Key Regions and Countries
North America
- US
- Canada
Europe
- Germany
- France
- The UK
- Spain
- Italy
- Rest of Europe
Asia Pacific
- China
- Japan
- South Korea
- India
- Australia
- Rest of APAC
Latin America
- Brazil
- Mexico
- Rest of Latin America
Middle East and Africa
- GCC
- South Africa
- Rest of MEA
Market Dynamics
Challenge
Capex-heavy edge buildouts remain a structural constraint because dense micro-edge deployments typically require USD 0.5-1.5 million per site for ruggedized compute, power conditioning, and connectivity, creating a meaningful upfront burden for many industrial and mid-market enterprises.
Although global edge spending continues to grow at roughly 13-14% CAGR through 2028, higher financing costs and integration risk have increased internal hurdle rates by 150-250 basis points since 2022. Projects that previously cleared a 12% IRR threshold now often require 14-15%, especially for brownfield deployments involving complex OT-IT integration.
This has slowed execution timelines, with deployments often taking 9-18 months and initial rollouts limited to 10-30 sites instead of the larger 100-300 site footprints assumed in planning. To counter this, vendors are shifting toward edge-as-a-service and outcome-based pricing models, with monthly per-node fees in the low four figures, improving affordability and reducing payback horizons to 24-36 months versus the traditional 48-60 months.
| Challenge | (~) % CAGR | Geographic Relevance | Mitigation Horizon |
|---|---|---|---|
| Capex-heavy edge buildouts | -1.2% | North America, EU, East Asia | Medium term (2–4 years) |
| Fragmented edge standards | -0.8% | EU regulatory hubs, APAC telcos | Long term (≥ 4 years) |
| Cybersecurity talent deficit | -1.0% | Global metro hubs | Long term (≥ 4 years) |
| Edge supply chain volatility | -0.9% | APAC logistics corridors, NA/EU data centers | Medium term (2–4 years) |
| Latency–reliability trade-offs | -0.7% | Global ultra-low-latency sites | Medium term (2–4 years) |
| Data sovereignty complexity | -0.6% | EU, Middle East, India, LATAM | Long term (≥ 4 years) |
Opportunity
Verticalized sovereign and regulated edge infrastructure is a distinct opportunity because most edge growth forecasts still focus on latency, bandwidth, and general IoT demand, while regulatory drivers such as data sovereignty, sector-specific compliance, and public-sector digitalization are only partially reflected in baseline models.
As governments in regions like the EU, India, the Middle East, and parts of Latin America tighten rules around cross-border data flows in healthcare, finance, utilities, and critical infrastructure, demand is emerging for compliance-certified sovereign edge zones. These offerings can command a 20-30% pricing premium by bundling in-country processing, auditability, and secure key management.
If regulated sectors such as public services, BFSI, healthcare, and utilities capture even approximately 5% of edge workloads by 2032, this could generate an additional USD 8-12 billion annually, assuming 25-35% ARPU uplift versus standard edge services. Because providers can layer compliance and software on existing infrastructure rather than building new capacity, this model can also improve ROIC by 2-4 percentage points, contributing roughly 1.8 percentage points of CAGR upside through 2035 as sovereign requirements become more embedded in procurement cycles.
| Opportunity | (~) % Potential
CAGR |
Geographic Relevance | Execution Window |
|---|---|---|---|
| Telco edge–as-a-platform for ISVs | +2.5% | North America, EU, APAC developed | Short–Medium term |
| Industrial & energy OT edge platforms | +2.2% | APAC emerging, North America, Middle East | Medium term |
| AI inference at the edge monetization | +2.0% | Global tier-1 metros, APAC developed | Short–Medium term |
| Verticalized sovereign & regulated edge | +1.8% | EU, Middle East, India, Latin America | Medium–Long term |
| Edge data center M&A roll-ups | +1.5% | North America core, Western Europe | Short term |
| Consumer & automotive edge services | +1.3% | North America, EU, China, India | Medium–Long term |
Driver
Vertical adoption in manufacturing and healthcare under Industry 4.0 is moving from pilot programs into scaled deployments, particularly in 2024-25, as enterprises begin to realize measurable ROI from edge-enabled AI use cases such as predictive maintenance, real-time quality inspection, and clinical imaging inference.
Enterprises are increasingly justifying investment in integrated edge plus private 5G plus AI stacks, especially in advanced manufacturing corridors across APAC and in healthcare systems in North America and Europe. This vertical expansion is contributing approximately 2.0 percentage points to edge computing CAGR, as demand shifts toward high-value, low-latency, and regulated compute environments.
| Driver | (~) % Impact on CAGR | Geographic Relevance | Impact Timeline |
|---|---|---|---|
| Private 5G + MEC deployments driving industrial edge | +3.5% | APAC corridors (India, China), North America core, EU industrial clusters | Short term (≤ 2 years) |
| On-device / edge AI chips (energy-efficient inference) | +2.2% | North America core, APAC corridors (China, Taiwan), EU spill-over | Medium term (2–4 years) |
| Data-localization & sovereignty regulations | +1.6% | India core, EU core, LATAM & MENA spill-over | Short–Medium (≤ 4 years) |
| Cloud-to-edge commercial model shift (SaaS/Managed Edge) | +2.0% | North America core, EU, APAC corridors | Medium term (2–4 years) |
| Vertical adoption in manufacturing & healthcare (Industry 4.0) | +2.0% | APAC manufacturing belts, North America, EU healthcare clusters | Short term (≤ 2 years) |
| Power / energy cost and sustainability constraints | +0.9% | Global (supply chain nodes), APAC data center regions | Long term (≥ 4 years) |
Restraint
Advanced semiconductor and memory constraints are becoming a structural bottleneck for edge and distributed computing because wafer capacity, DRAM, and HBM supply are increasingly redirected toward hyperscaler AI accelerators and high-margin data center workloads.
This shift creates a supply gap for mature-node SoCs and commodity DRAM used in edge gateways and micro-data centers, extending procurement lead times from 12-16 weeks to 20-32 weeks for key components. At the same time, memory pricing is seeing modeled pass-through increases of 12-28%, tightening cost structures across edge hardware stacks.
The resulting delays and cost inflation lead to higher inventory buffers, with inventory-to-sales rising by 30-60 days, and push many deployments beyond acceptable payback thresholds of 24-36 months. Combined, these pressures compress OEM margins by 200-450 basis points and are estimated to create a 3.0 percentage point drag on baseline edge computing CAGR, primarily through delayed rollouts and deferred capital expenditure.
| Restraint | (~) % Impact on CAGR | Geographic Relevance | Impact Timeline |
|---|---|---|---|
| Advanced semiconductor & memory squeeze | -3.0% | Global (APAC core, NA hyperscalers) | Short–Medium term (≤4 years) |
| Advanced packaging capacity bottleneck | -1.5% | Taiwan, South Korea, China fabs | Medium term (2–4 years) |
| Data-sovereignty / localization rules | -1.2% | EU core, India, China, LATAM pockets | Medium–Long term (2–≥4 years) |
| Telecom 5G rollout & funding lag | -1.0% | APAC corridors, Latin America, parts of Africa | Short–Medium term (≤4 years) |
| High BOM costs from memory & power | -1.8% | Global (device OEMs, edge DCs) | Short term (≤2 years) |
| Talent & systems integration shortage | -0.8% | NA, EU, APAC enterprise clusters | Medium term (2–4 years) |
Key Players Analysis
Tier 1 market leaders include AWS, Microsoft, Google, Nvidia, Dell Technologies, Cisco, HPE, Intel, IBM, Oracle, and Huawei because they combine global cloud platforms, enterprise accounts, processors, networking, and edge software. Amazon reported AWS segment sales of USD 128.7 billion in 2025, which gives it major scale in hybrid cloud and edge workloads. Microsoft reported fiscal 2025 revenue of USD 281.7 billion and Azure revenue above USD 75 billion, while R&D expense reached USD 32.5 billion.
Nvidia reported fiscal 2025 revenue of USD 130.5 billion and data center revenue of USD 115.2 billion, which strengthens its role in edge AI inference and accelerated computing. Dell Technologies, Cisco, HPE, Intel, and IBM compete through enterprise hardware, industrial servers, private cloud, networking, and managed infrastructure. Dell generated fiscal 2025 revenue of USD 95.6 billion, with Infrastructure Solutions Group revenue of USD 43.6 billion.
Cisco reported fiscal 2025 revenue of USD 56.7 billion and completed the Splunk acquisition for USD 28 billion, adding observability and security depth for distributed edge environments. HPE reported fiscal 2025 revenue of USD 30.1 billion and closed its Juniper Networks acquisition at about USD 14 billion, increasing its AI-native networking reach.
Tier 2 challengers include ADLINK, Fastly, Nokia, Semtech, VMware, and selected regional units of Huawei and Oracle in specific countries. ADLINK focuses on embedded boards, rugged edge systems, industrial gateways, and Edge AI hardware. Fastly reported 2025 revenue of USD 554 million, giving it a niche position in content delivery and edge cloud services. Nokia reported 2025 net sales of EUR 19.2 billion and R&D expenses of EUR 4.4 billion, which supports private wireless, telecom edge, and industrial automation use cases.
Top Key Players in the Market
- ADLINK
- AWS
- Cisco
- Dell Technologies
- Fastly
- HPE
- Huawei
- IBM
- Intel
- Microsoft
- Nokia
- Nvidia
- Oracle
- Semtech
- VMware
Recent Developments
- In June 2026, Accenture launched Accenture Edge as a dedicated business targeting mid-market companies with annual revenues of $300 million to $3 billion, positioning the unit to commercialize AI and edge-enabled technology services for a defined enterprise revenue band.
- In June 2025, Amazon announced a planned $10 billion investment in North Carolina to expand AWS cloud and AI data-center infrastructure, creating at least 500 high-skilled jobs and supporting thousands of additional roles across the AWS data-center supply chain.
- In September 2025, NVIDIA and OpenAI announced a strategic partnership to deploy at least 10 gigawatts of NVIDIA systems for next-generation AI infrastructure, with NVIDIA intending to invest up to $100 billion as each gigawatt is deployed and the first 1-gigawatt phase targeted for the second half of 2026 on the NVIDIA Vera Rubin platform.
Report Scope
| Report Features | Description |
|---|---|
| Market Value (2025) | USD 28.4 Billion |
| Forecast Revenue (2035) | USD 446.8 Billion |
| CAGR (2026-2035) | 31.7% |
| Base Year for Estimation | 2025 |
| Historic Period | 2020-2024 |
| Forecast Period | 2026-2035 |
| Report Coverage | Revenue Forecast, Market Dynamics, Competitive Landscape, Recent Developments |
| Segments Covered | By Offering (Edge Hardware, Edge Software, Services); By Deployment Type (Cloud Edge, Device Edge, On-premises Edge); By Organization Size (Large Enterprises, Small and Medium-Sized Enterprises); By Application (IoT & Industrial Automation, Edge AI & Inference, Content delivery & Media, Immersive & Interactive Experiences, Real time Processing & Control, Others); By Industry Vertical (Manufacturing, Retail & Consumer Goods, Automotive, Energy & Utilities, Healthcare & Life Sciences, Media & Entertainment, Software & IT Services, Telecommunications, Transportation & Logistics, Other) |
| Regional Analysis | North America – US, Canada; Europe – Germany, France, The UK, Spain, Italy, Rest of Europe; Asia Pacific – China, Japan, South Korea, India, Australia, Singapore, Rest of APAC; Latin America – Brazil, Mexico, Rest of Latin America; Middle East & Africa – GCC, South Africa, Rest of MEA |
| Competitive Landscape | ADLINK, AWS, Cisco, Dell Technologies, Fastly, Google, HPE, Huawei, IBM, Intel, Microsoft, Nokia, Nvidia, Oracle, Semtech, VMware |
| Customization Scope | Customization for segments and region/country-level will be provided. Moreover, additional customization can be done based on the requirements. |
| Purchase Options | We have three licenses to opt for: Single User License, Multi-User License (Up to 5 Users), Corporate Use License (Unlimited Users and Printable PDF) |





























