


Report Overview
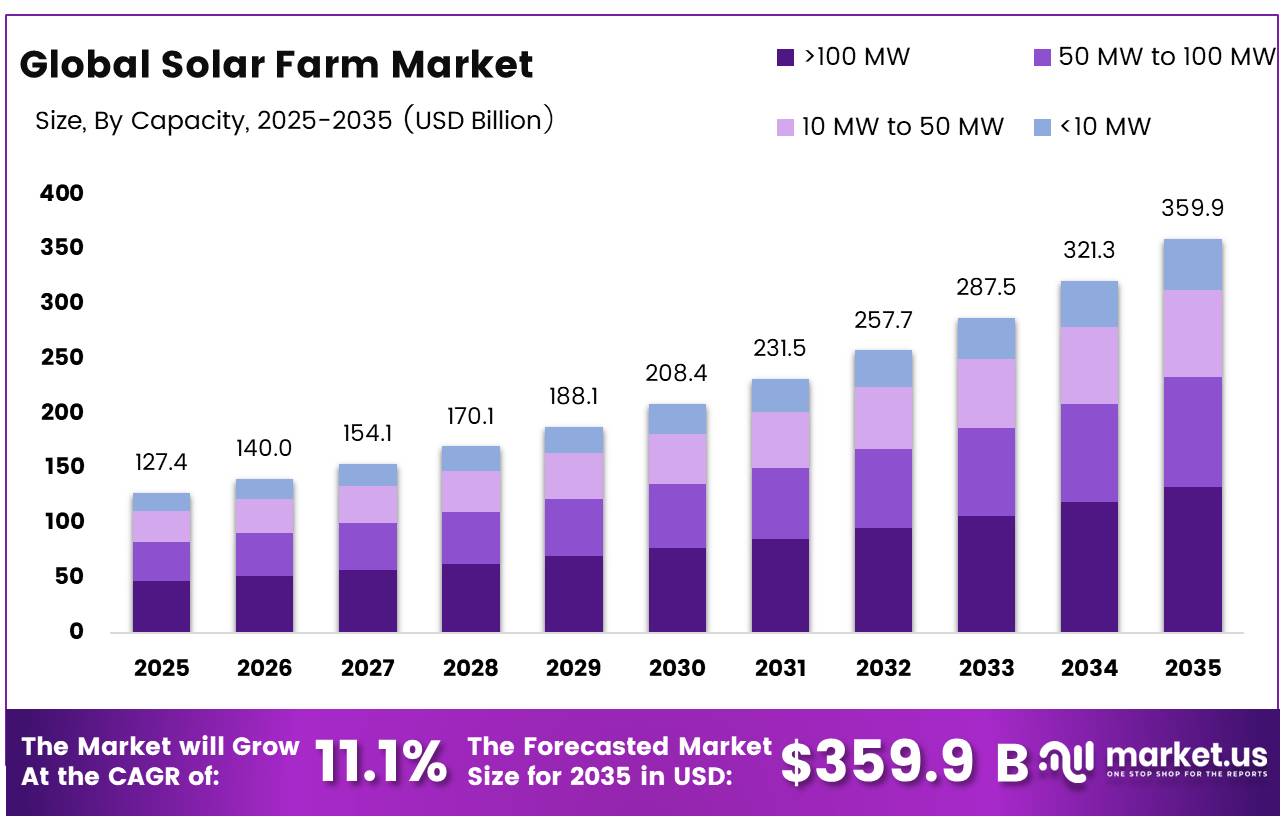
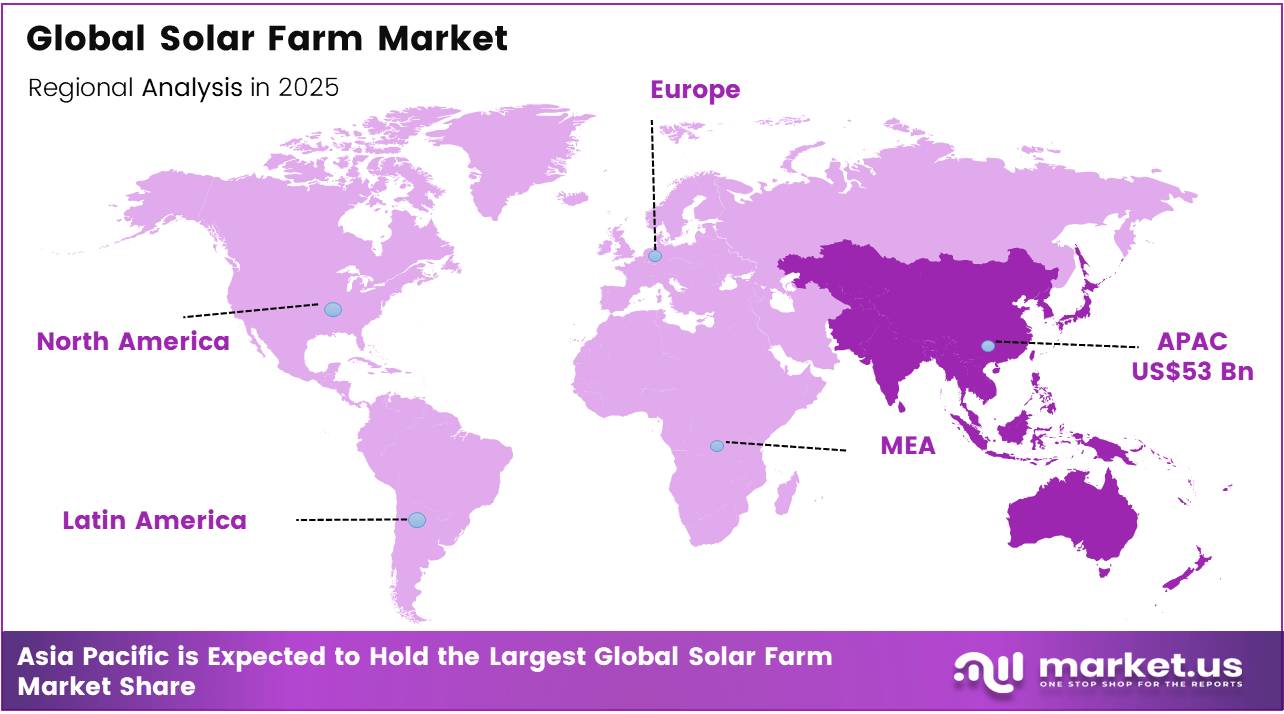
In 2025, the Global Solar Farm Market was valued at USD 127.4 billion, and between 2026 and 2035, this market is estimated to register a CAGR of 11.1%, reaching about USD 359.9 billion by 2035. In 2025, Asia Pacific led the market, achieving over 41.6% share with a revenue of USD 53.0 Billion.
Solar farms are a core part of the renewable-power value chain, converting large land areas into grid-connected electricity through photovoltaic modules, inverters, trackers and substations. Demand is supported by rising electricity consumption, energy-security planning and policies encouraging lower-emission generation.
- Solar farms are becoming a major part of global power infrastructure as utilities seek scalable, low-emission electricity. In 2025, solar photovoltaic generation increased by 620 TWh, compared with 450 TWh in 2024, lifting solar’s contribution to around 8% of worldwide electricity.
Key Takeaways
- The global Solar Farm market was valued at USD 127.4 billion in 2025.
- The global market is projected to grow at a CAGR of 11.1% and is estimated to reach USD 359.9 billion by 2035.
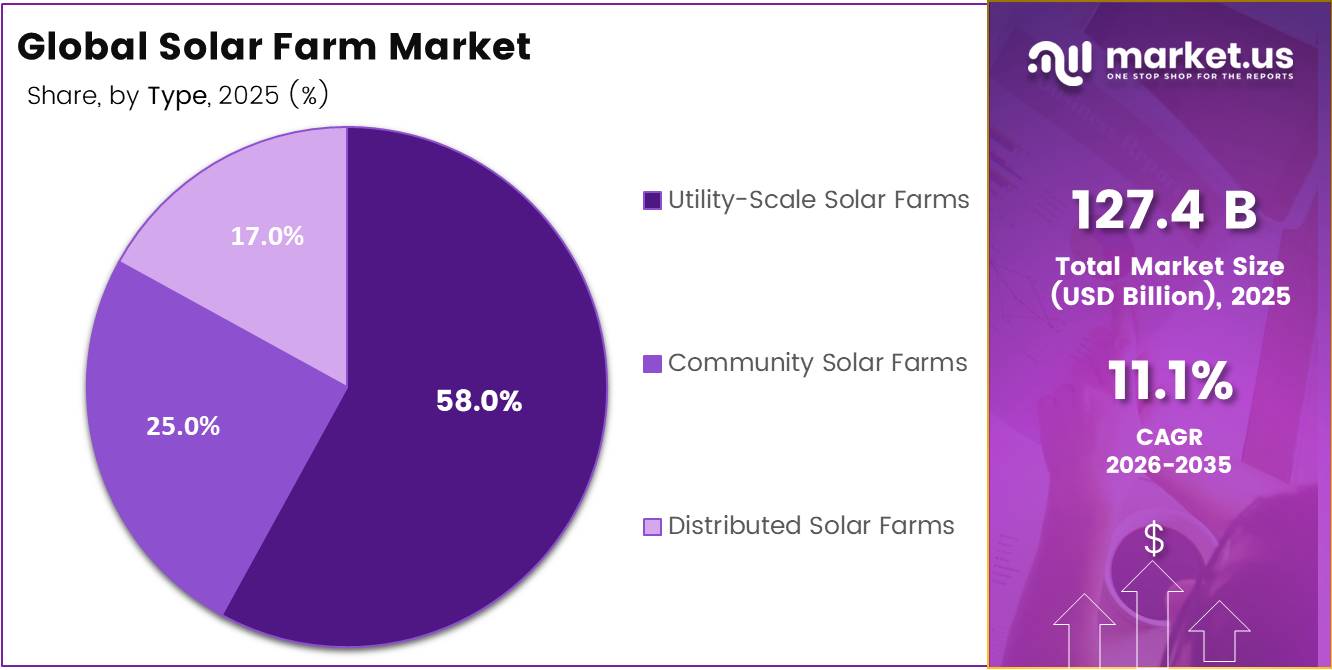
- On the basis of type, the Utility-Scale Solar Farms dominated the market, constituting 58.0% of the total market share.
- Based on the technology, the Photovoltaic (PV) dominated the Solar Farm market, with a substantial market share of around 84.0%.
- Among the By Capacity, the >100 MW held a major share in the Solar Farm market, 37.0% of the market share.
- Among the end user, the Utilities is the most considerable within the market, accounting for around 55.0% of the revenue.
- In 2025, the Asia Pacific was the most dominant region in the Solar Farm market, accounting for 41.6% of the total global consumption.
Industrial development is being supported by manufacturing investment, technical research and grid-integration programmes. The U.S. Department of Energy lists $217 million for its solar laboratory call, $44 million for thin-film photovoltaic development and $27 million for silicon manufacturing and dual-use PV projects.
Future opportunities will centre on solar-plus-storage, agrivoltaics, recycling, repowering and digital plant controls. Renewable electricity generation is projected to rise 60%, from 9,900 TWh in 2024 to 16,200 TWh by 2030, with solar PV contributing more than half of the increase. Renewables may also satisfy over 90% of worldwide electricity-demand growth during 2025–2030.
Operationally, future competitiveness will depend on more than module availability. Developers that secure grid connections early, integrate flexible storage, maintain community support, and establish stable power-purchase agreements will be better positioned to reduce curtailment, approval delays, and revenue uncertainty.
Type Analysis
Utility-Scale Solar Farms represents dominant Segment in the Market.
Utility-Scale Solar Farms held the leading market position, capturing more than a 58.00% share, based on the provided market segmentation. Their leadership is supported by the ability to deliver large volumes of electricity through centralized grid connections.
- U.S. utility-scale solar photovoltaic capacity reached 149,798.5 MW in 2025, compared with 122,060.1 MW in 2024. Utility-scale solar also generated 296,000 GWh of electricity during 2025, representing a 34% annual increase.
Community Solar Farms represent the growing segment because shared projects allow households and businesses that cannot install rooftop panels to access solar electricity. As of June 2024, approximately 7.87 GW of community solar capacity was operating across 44 states and localities, including the District of Columbia. The median capacity-weighted net present value of residential subscriptions was approximately +$0.27 per watt through mid-2024, indicating potential long-term electricity-bill savings for participating consumers.
Technology Analysis
Photovoltaic (PV) a significant technology.
Photovoltaic technology held the leading market position, capturing more than an 84.00% share, based on the provided segmentation. PV continues to lead because modular systems can be installed across large sites and combined with battery storage to support dependable power delivery.
- In January 2025, the U.S. Department of Energy finalized a $289.7 million loan guarantee supporting the deployment of up to 1,000 PV and battery systems across as many as 27 states. These deployments demonstrate the technology’s scalability across commercial and industrial electricity applications.
Concentrated Solar Power is the growing technology, particularly for projects requiring dispatchable renewable heat and electricity. A U.S. Department of Energy-supported CSP pilot received $25 million to develop a multi-megawatt thermal system capable of storing energy for six hours and operating at temperatures above 700°C. This high-temperature capability creates opportunities in long-duration storage and heat-intensive industrial processes.
Capacity Analysis
>100 MW Are the Most Widely Used Separators.
Above 100 MW solar farms held the leading market position, capturing more than a 37.00% share, based on the supplied segmentation. Large projects benefit from centralized construction, grid-scale power delivery and stronger integration with storage.
- In January 2025, the Bureau of Land Management approved a 400 MW solar facility covering approximately 2,469 acres in Nevada, illustrating the development scale supported by this category.
The 50 MW to 100 MW category is the growing segment, as developers increasingly use this range for projects requiring manageable land, grid connections and integrated storage. A U.S. Department of Energy-reviewed project includes an 80 MW photovoltaic facility paired with a 110 MW battery system and a 1,000-meter transmission line. This balanced design highlights how mid-sized solar farms can improve power availability without requiring the footprint of the largest developments.
End User Analysis
Utilities Held a Major Share of the Solar Farm Market.
Utilities held the leading market position, capturing more than a 55.00% share, based on the supplied segmentation. Utilities remain the primary solar-farm customers because they procure electricity at grid scale and integrate large projects into centralized power networks.
- In 2024, the U.S. electric power sector generated 216,715 thousand MWh from solar PV, while independent power producers contributed 185,257 thousand MWh, showing the strong role of utility-oriented projects.
Commercial and Industrial users represent the growing segment, as businesses increasingly adopt solar to manage electricity expenses, strengthen energy security and support operational sustainability targets. U.S. small-scale commercial PV capacity reached 16,031.4 MW in 2025, while industrial installations reached 2,999.3 MW. These figures indicate widening solar adoption across offices, warehouses, factories and other business facilities.
Key Market Segments
By Type
- Utility-Scale Solar Farms
- Community Solar Farms
- Distributed Solar Farms
By Technology
- Photovoltaic (PV)
- Monocrystalline Silicon
- Polycrystalline Silicon
- Thin-Film
- Concentrated Solar Power (CSP)
- Parabolic Trough
- Solar Power Tower
- Linear Fresnel
- Dish Stirling
By Capacity
- <10 MW
- 10 MW to 50 MW
- 50 MW to 100 MW
- >100 MW
By End User
- Utilities
- Commercial and Industrial
- Government and Municipalities
- Residential Communities
- Agricultural Sector
Driver Analysis
Low-LCOE utility-scale solar replacing new thermal builds
Solar remains the cheapest scalable new-build power source in a growing number of markets, and that is the core reason the solar farm market keeps compounding in 2026. The IEA states solar PV is expected to contribute 80% of global renewable-capacity growth from 2024 to 2030, with growth coming from both large solar plants and rooftop systems, confirming that utility-scale solar is still the anchor technology for new renewable buildout.
- The same medium-term IEA outlook projects almost 4,600 GW of global renewable additions between 2025 and 2030, roughly double the previous five-year deployment, and notes that utility-scale and distributed solar together account for nearly 80% of renewable electricity expansion, which implies continued capex preference for solar farms in utility procurement decisions.
Commercially, this shifts developer strategy from “build when subsidized” to “build when bankable under merchant-plus-contracted blends,” because lower module prices and shorter construction cycles improve IRR sensitivity even when interest rates stay elevated. For market forecasting, that supports the largest single uplift to baseline CAGR because it improves bid competitiveness, widens addressable geographies, and allows utilities to replace planned peaker or imported-fuel capacity with cheaper solar-led portfolios rather than treating solar as only a policy-driven technology.
Drivers Impact Analysis
| Driver | (~) % Impact on CAGR Forecast | Geographic Relevance | Impact Timeline |
|---|---|---|---|
| Low-LCOE utility-scale solar replacing new thermal builds | +2.4% | North America core, EU, India, MENA, Australia, LatAm | Short term (≤ 2 years) |
| Solar-plus-storage improving dispatchability and capture prices | +1.9% | India, US Sun Belt, Australia, Southern Europe, GCC | Short term (≤ 2 years) |
| Policy auctions, tax credits, and decarbonization mandates expanding bankable pipeline | +1.6% | US, EU, India, China spill-over, MENA tenders | Medium term (2-4 years) |
| Electrification and data-center load growth increasing utility procurement | +1.4% | US, Nordics, Ireland, India, Gulf states | Medium term (2-4 years) |
| Emerging-market capacity targets and low-capex execution scaling new corridors | +1.2% | India, MENA, Sub-Saharan Africa, Southeast Asia, LatAm | Medium term (2-4 years) |
| Grid reform and interconnection modernization unlocking delayed projects | +0.9% | US ISO/RTO markets, UK, EU corridors, Australia | Medium term (2-4 years) |
Restraint Analysis
Grid queue delays
Interconnection remains the single largest value-destructive bottleneck because the market can finance and physically build more solar farms than transmission systems can absorb, creating a mismatch between equipment readiness and energization readiness. In the US, solar installations fell to 7.8 GWdc in Q1 2026, down 27% year over year and 42% versus Q4 2025, while industry commentary continues to describe queue durations stretching for years, implying that revenue start dates are slipping by 12 to 36 months even when module procurement and EPC mobilization are complete.
That delay materially erodes project returns: for a utility-scale asset under a typical leveraged structure, each 6- to 12-month COD slippage can shave roughly 80 to 180 basis points from levered IRR through interest carry, IDC accumulation, liquidated-damages exposure, and deferred tax-equity monetization, while developers also absorb repeated study costs, upgrade uncertainty, and higher bid bonds.
Restraint Impact Analysis
| Restraint | (~) % Impact on CAGR | Geographic Relevance | Impact Timeline |
|---|---|---|---|
| Grid queue delays | -2.3% | North America core, UK, EU, Australia | Short term (≤ 2 years) |
| Curtailment risk | -1.8% | California, Texas, SPP, Iberia, Australia | Short term (≤ 2 years) |
| Tariff cost shock | -1.6% | US core, India, APAC trade corridors | Short term (≤ 2 years) |
| High cost of capital | -1.4% | North America, EU, LatAm, Africa | Medium term (2-4 years) |
| Permitting and land conflict | -1.1% | EU, US, India, UK | Medium term (2-4 years) |
| Labor and BOS inflation | -0.9% | US, EU, Australia, GCC | Short term (≤ 2 years) |
Opportunity Analysis
Data-center energy parks
Industry reporting in 2026 points to energy parks that combine solar and battery storage behind the meter specifically to bypass slow interconnection queues, while data-center buyers are increasingly moving from annual renewable matching to hourly or 24/7 clean-energy structures; one source notes signatories to the Climate Neutral Data Centre Pact target 75% renewable matching by 2025 and 100% by 2030 on an hourly basis, materially raising the value of shaped solar supply.
The monetization uplift comes from replacing commodity energy pricing with long-duration take-or-pay structures, resilience premiums, and capacity-style payments: even if only 15% to 20% of new utility-scale solar pipeline is redirected into data-center-linked parks, realized EBITDA per MW can plausibly rise 20% to 35% versus plain grid export due to stronger offtaker credit, lower merchant exposure, and battery-backed evening delivery.
Opportunity Impact Analysis
| Opportunity | (~) % Potential CAGR Upside | Geographic Relevance | Execution Window |
|---|---|---|---|
| Data-center energy parks | +2.2% | US core, Nordics, Ireland, India, GCC | Short term (≤ 2 years) |
| Repowering old solar sites | +1.8% | US, EU, Japan, India, Australia | Medium term (2-4 years) |
| Agrivoltaics land unlock | +1.5% | EU, US, Japan, India | Medium term (2-4 years) |
| Solar-plus-flex revenue stack | +1.4% | California, Texas, Australia, UK, Iberia | Short term (≤ 2 years) |
| Transmission-ready land roll-up | +1.2% | US ISO/RTOs, UK, EU corridors, India | Medium term (2-4 years) |
| Behind-the-meter industrial hybrids | +1.0% | India, MENA, Southeast Asia, LatAm | Short term (≤ 2 years) |
Challenges Analysis
Transformer supply bottleneck
Transformer availability has become a chronic operational challenge because it sits at the intersection of grid expansion, renewable buildout, electrification, and limited heavy-electrical manufacturing capacity, meaning solar developers are competing with utilities, data centers, and industrial loads for the same constrained equipment pool. Wood Mackenzie-referenced reporting shows average transformer lead times rose from around 50 weeks in 2021 to about 120 weeks in 2024, while 2025–2026 updates indicate standard power transformers averaging roughly 128 weeks, generator step-up units around 144 weeks, and specialized orders extending toward four years; prices are also reported up 77% since 2019 for some transformer categories.
This is a challenge rather than a restraint because projects still move forward, but procurement strategy now requires earlier ordering, working-capital lockup, alternate specs, refurbished units, and tighter substation design standardization, all of which raise development overhead and reduce schedule flexibility; on a large solar farm, a transformer slip can consume most float in the critical path and convert a manageable 3% to 5% EPC contingency into a 7% to 10% all-in cost variance. The long-run implication is that developers need supply-chain partnerships, frame agreements, and equipment-bank strategies more akin to utility infrastructure players than traditional renewable EPC buyers.
Challenges Impact Analysis
| Challenge | (~) % CAGR Friction Drag | Geographic Relevance | Mitigation Horizon |
|---|---|---|---|
| Transformer supply bottleneck | -1.7% | North America core, EU, LatAm, GCC | Medium term (2-4 years) |
| Cybersecurity control gaps | -1.1% | EU regulatory hubs, North America, APAC grids | Medium term (2-4 years) |
| Extreme weather exposure | -1.0% | US Sun Belt, Australia, India, MENA | Long term (≥ 4 years) |
| Skilled labor scarcity | -0.9% | US, EU, Australia, GCC | Medium term (2-4 years) |
| Grid integration complexity | -0.8% | California, Texas, EU corridors, UK, Australia | Medium term (2-4 years) |
| Degradation and fire risk | -0.6% | Global utility-scale markets | Long term (≥ 4 years) |
Geopolitical Impact Analysis
Geopolitical Trade Enforcement and Manufacturing Localization Reshaping Solar-Farm Supply Chains
Solar-farm procurement is being reshaped by enforcement against supply-chain circumvention. The U.S. Department of Commerce investigated 8 solar manufacturers operating through 4 Southeast Asian countries and found that 5 were circumventing existing duties, while 3 were not. The inquiry covered products routed through Cambodia, Malaysia, Thailand and Vietnam after components originated in China. Such decisions can change supplier eligibility, equipment costs, contract schedules and inventory planning for developers dependent on imported cells and modules.
Manufacturing localization is becoming the main strategic response. The U.S. Department of Energy reported that solar employed more than 340,000 people in 2023 and could support between 500,000 and 1.5 million workers by 2035. Government incentives have been associated with nearly 50 GWdc of announced annual module-assembly capacity, more than 35 newly operational factories, over $3 billion in investment and 9,500 jobs. Domestic module-manufacturing capacity was estimated to reach about 40 GW by 2026. This expansion can reduce exposure to shipping delays and trade disputes while creating opportunities in wafers, cells, inverters, trackers and electrical equipment.
Regional Analysis
Asia Pacific Held the Largest Share of the Global Solar Farm Market.
Asia Pacific held the leading solar-farm market position, capturing more than a 41.60% share, based on the supplied segmentation. The region benefits from large utility projects, expanding transmission networks and strong manufacturing depth. China’s solar power capacity reached 1.2 billion kW by the end of 2025, while annual additions totaled 317 million kW, showing the scale of project commissioning supporting regional leadership.
Europe represents the growing regional market, supported by energy-security policies, competitive renewable procurement and efforts to reduce reliance on imported fossil fuels. Solar electricity generation across the European Union reached a record 275 TWh in 2025, increasing by 18% from the previous year. The region also installed 56 GW of new solar capacity during the year, indicating a strong pipeline for utility-scale developments, grid upgrades and energy-storage integration.
Key Regions and Countries Covered
- North America
- The US
- Canada
- Europe
- Germany
- France
- The UK
- Spain
- Italy
- Russia & CIS
- Rest of Europe
- APAC
- China
- Japan
- South Korea
- India
- ASEAN
- Rest of APAC
- Latin America
- Brazil
- Mexico
- Rest of Latin America
- Middle East & Africa
- GCC
- South Africa
- Rest of MEA
Key Players Analysis
Solar farm developers focus on improving project efficiency, power output, and grid integration to maintain competitiveness. A major priority is continuous technology improvement, including the use of high-efficiency modules, single-axis trackers, advanced inverters, and intelligent monitoring systems that raise electricity generation and reduce operating losses. Companies also invest in automated construction, predictive maintenance, and energy storage integration to improve project reliability and support power delivery after sunset.
Strong relationships with equipment suppliers, utilities, and transmission operators help secure components, grid access, and long-term project stability. Strategic expansion into high-irradiance locations enables developers to improve plant performance and serve growing electricity demand. In addition, companies emphasize land-use planning, environmental compliance, cybersecurity, and standardized engineering practices to reduce development risks. Long-term power purchase agreements with utilities, commercial users, and public agencies further improve revenue visibility, strengthen customer relationships, and support financing for new solar farm projects.
The Major Players In The Industry
- TotalEnergies
- Adani Green Energy Ltd.
- Brookfield Renewable Partners
- Enel Green Power
- Lightsource bp
- GCL New Energy
- NextEra Energy Resources
- Canadian Solar Inc.
- Engie
- Iberdrola
- EDF Renewables
- ACWA Power
- Recurrent Energy
- First Solar, Inc.
- Neoen
Key Development
- In May 2025, TotalEnergies inaugurated five solar projects near Seville with 263 MW capacity, 400,000 bifacial panels, and expected annual generation of 515 GWh, enough for over 150,000 households while avoiding 245,000 tonnes of CO₂ each year.
- In September 2025, Iberdrola commissioned a 316 MW photovoltaic plant in Salamanca using more than 460,000 modules; the €200 million project can supply approximately 155,000 homes and avoid 75,000 tonnes of CO₂
Report Scope
| Report Features | Description |
|---|---|
| Market Value (2025) | USD 127.4 Bn |
| Forecast Revenue (2035) | USD 359.9 Bn |
| CAGR (2026-2035) | 11.1% |
| Base Year for Estimation | 2025 |
| Historic Period | 2020-2024 |
| Forecast Period | 2026-2035 |
| Report Coverage | Revenue Forecast, Market Dynamics, Competitive Landscape, Recent Developments |
| Segments Covered | By Type (Utility-Scale Solar Farms, Community Solar Farms, and Distributed Solar Farms), By Technology (Photovoltaic (PV) and Concentrated Solar Power (CSP)), By Capacity (Less than 10 MW, 10 MW to 50 MW, 50 MW to 100 MW, and Above100 MW), By End Use (Utilities, Commercial and Industrial, Government and Municipalities, Residential Communities, and Agricultural Sector) |
| Regional Analysis | North America – The US & Canada; Europe – Germany, France, The UK, Spain, Italy, Russia & CIS, Rest of Europe; APAC– China, Japan, South Korea, India, ASEAN & Rest of APAC; Latin America– Brazil, Mexico & Rest of Latin America; Middle East & Africa– GCC, South Africa, & Rest of MEA |
| Competitive Landscape | TotalEnergies, Adani Green Energy Ltd., Brookfield Renewable Partners, Enel Green Power, Lightsource bp, GCL New Energy, NextEra Energy Resources, Canadian Solar Inc., Engie, Iberdrola, EDF Renewables, ACWA Power, Recurrent Energy, First Solar, Inc., Neoen. |
| Customization Scope | Customization for segments, region/country-level will be provided. Moreover, additional customization can be done based on the requirements. |
| Purchase Options | We have three licenses to opt for: Single User License, Multi-User License (Up to 5 Users), Corporate Use License (Unlimited Users and Printable PDF) |





































