


Report Overview
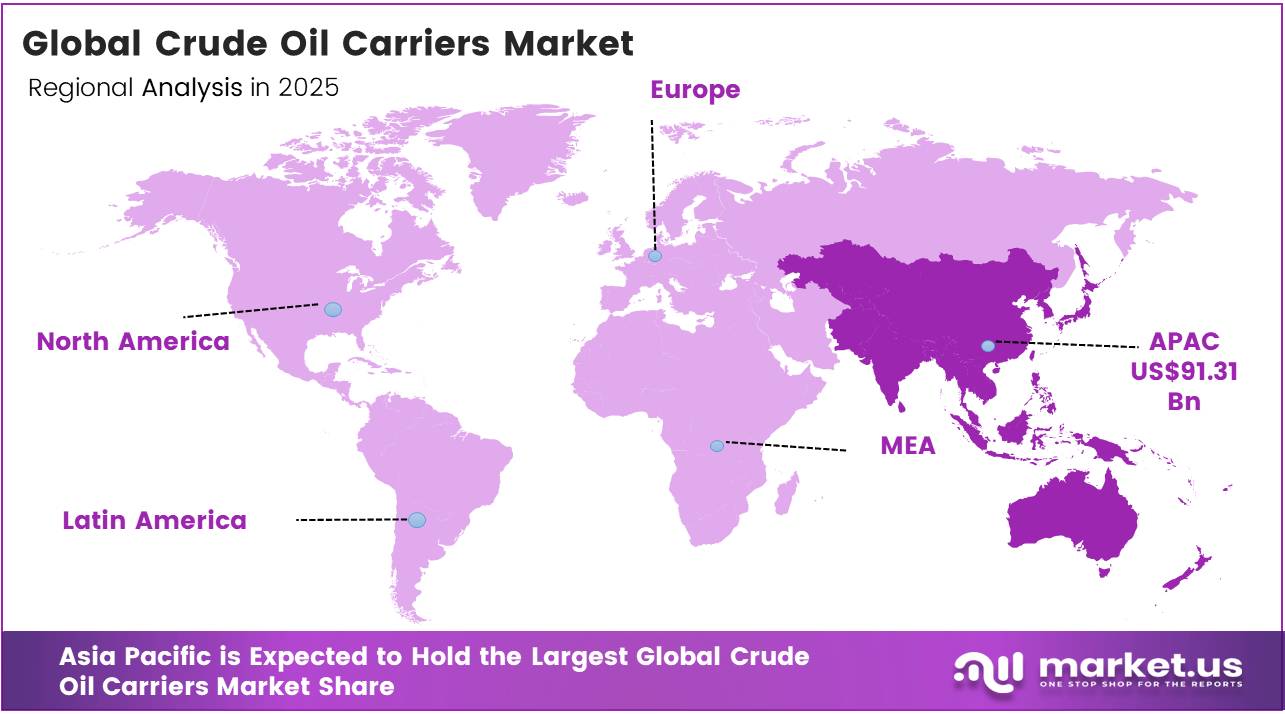
In 2025, the Global Crude Oil Carriers Market was valued at USD 263.4 billion, and between 2026 and 2035, this market is estimated to register a CAGR of 4.0%, reaching about USD 391.6 billion by 2035. In 2025, Asia Pacific held a dominant market position, capturing more than a 37.0% share, holding USD 91.31 Billion revenue.
Crude oil carriers are specialised tankers that transport unrefined petroleum from export terminals and offshore loading points to refineries and storage hubs. The industry includes regional tankers, Suezmax vessels and very large crude carriers used on long-haul routes. Performance depends on cargo volumes, voyage distance, fleet availability, bunker costs, port access, insurance and environmental compliance. Around 80% of international merchandise trade by volume moves by sea, making tanker transport essential to energy security and refinery supply chains.
- The International Energy Agency projected global oil demand to rise by about 700,000 barrels per day in 2025 and reach nearly 105.5 million barrels per day by 2030. The United States exported an average of 3.987 million barrels of crude oil per day in 2025, including 3.852 million barrels per day from the Gulf Coast.
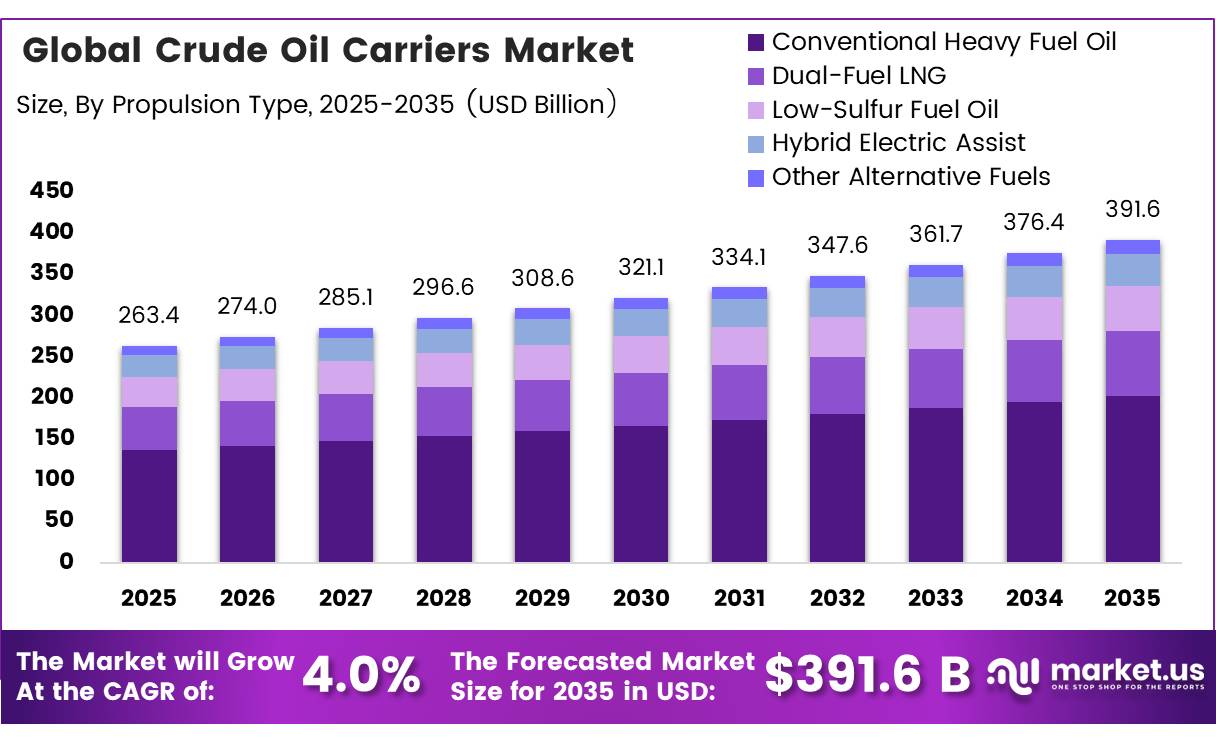
The crude oil carriers industry links producing regions, storage hubs and refineries, with vessel demand shaped by refinery locations, export availability and voyage distances. In 2025, global liquid-fuel consumption averaged 104.0 million barrels per day, while production reached 106.1 million barrels per day. Brent crude averaged USD 69 per barrel, influencing cargo schedules, chartering activity and fleet utilisation.
The industrial scenario is supported by the scale of international shipping and the importance of tanker transport. UNCTAD reported that the commercial fleet comprised 112,500 vessels in January 2025, with carrying capacity of 2.44 billion deadweight tons. Greece, China and Japan together controlled more than 40% of fleet capacity, highlighting concentrated ownership and the importance of maritime finance and operating networks.
Future growth opportunities will centre on fleet renewal, efficient hull designs, corrosion-resistant coatings, digital monitoring and cleaner propulsion. The IMO requires international shipping carbon intensity to fall by at least 40% by 2030 compared with 2008. OECD data show that alternative-fuel-capable ships represent more than 52% of global orderbook tonnage, but only around 7% of the operating fleet can use these technologies, creating scope for dual-fuel tankers and advanced retrofit solutions.
Key Takeaways
- The global Crude Oil Carriers market was valued at USD 263.4 billion in 2025.
- The global market is projected to grow at a CAGR of 4.0% and is estimated to reach USD 391.6 billion by 2035.
- On the basis of type, the Very Large Crude Carrier (Above 200,000 DWT) dominated the market, constituting 41.23% of the total market share.
- Based on the Propulsion Type, Conventional Heavy Fuel Oil led the market, comprising 51.80% of the total market.
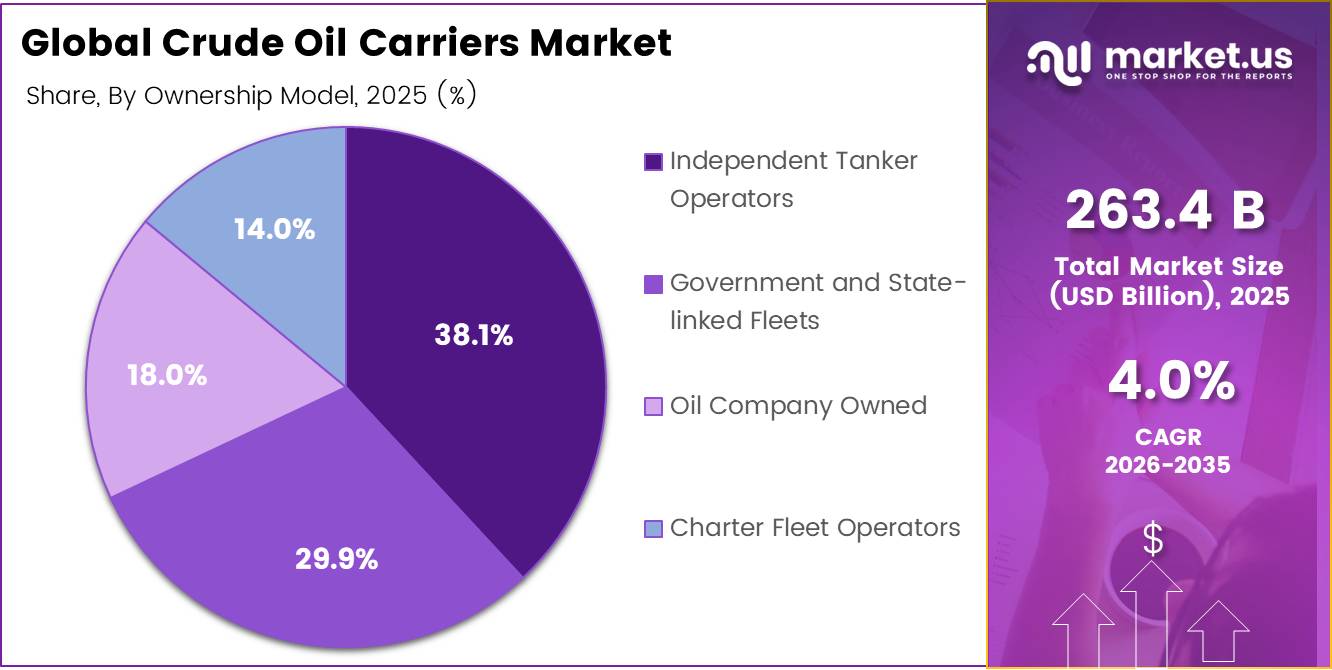
- Among the Ownership Model, the Independent Tanker Operators held a major share in the Crude Oil Carriers market, 38.10% of the market share.
- In 2025, the Asia Pacific was the most dominant region in the Crude Oil Carriers market, accounting for 34.67% of the total global consumption.
Type Analysis
Very Large Crude Carrier (Above 200,000 DWT) represents dominant Segment in the Market.
Very Large Crude Carriers lead with a 41.23% market share due to superior long-haul economics. These vessels typically transport 1.9 million to 2.2 million barrels of crude oil per voyage, reducing the cost per barrel across major intercontinental routes. In late 2025, VLCC freight rates increased by 118%, supported by longer voyages, changing trade routes and stronger competition for available ships. Their scale makes them particularly suitable for transporting high-volume cargoes between the Middle East, Asia, Europe and the Americas.
Aframax is the growing segment because it combines meaningful cargo capacity with wider port accessibility. Most U.S. Gulf Coast petroleum ports can accommodate Aframax vessels carrying approximately 500,000 barrels, while access for fully loaded larger tankers remains limited. Around four Aframax vessels can transport cargo equivalent to one VLCC, making the category useful for shorter routes, smaller terminals and flexible regional deliveries.
Propulsion Type Analysis
Conventional Heavy Fuel Oil a significant Propulsion type.
Conventional Heavy Fuel Oil leads with a 51.80% market share, supported by established bunkering infrastructure, high energy density and compatibility with large marine engines. The U.S. Energy Information Administration identifies residual oil as the largest traditional fuel component used by ocean-going vessels, while marine transport represents about 4% of global oil demand. Environmental rules have nevertheless changed fuel handling, as the permitted sulfur level was reduced from 3.5% to 0.5%, encouraging operators to use compliant blends or exhaust-cleaning systems.
Dual-Fuel LNG is the growing propulsion segment, as shipowners seek cleaner operation without giving up fuel flexibility. A U.S. Maritime Administration study found that LNG dual-fuel engines reduced particulate matter by 93% and nitrogen oxide emissions by 92% compared with diesel operation. In February 2025, the U.S. Department of Energy also removed regulatory barriers affecting ship-to-ship LNG bunkering, supporting wider marine-fuel availability.
Ownership Model Analysis
Independent Tanker Operators Are the Most Widely Used Ownership Model.
Independent Tanker Operators lead with a 38.10% market share, supported by their freedom to reposition vessels across customers, charter contracts and international routes. During the first half of 2025, around 79.8 million barrels per day of petroleum and other liquids moved through seaborne trade, representing 76% of the global supply of 104.4 million barrels per day. This broad cargo flow creates regular chartering opportunities and allows independent operators to respond quickly to changing refinery demand and freight conditions.
Government and State-linked Fleets are the growing segment, as energy security and emergency fuel transportation receive greater policy attention. At the end of 2025, the U.S. Strategic Petroleum Reserve held 411 million barrels against an authorised capacity of 714 million barrels. The U.S. Tanker Security Program also gives the government assured access to 10 registered product tankers during conflict or national emergencies.
Key Market Segments
By Type
- Panamax (55,000-84,000 DWT)
- Aframax (85,000-124,999 DWT)
- Suezmax (125,000- 199,999 DWT)
- Very Large Crude Carrier (Above 200,000 DWT)
By Propulsion Type
- Conventional Heavy Fuel Oil
- Dual-Fuel LNG
- Low-Sulfur Fuel Oil
- Hybrid Electric Assist
- Other Alternative Fuels
By Ownership Model
- Oil Company Owned
- Independent Tanker Operators
- Charter Fleet Operators
- Government and State-linked Fleets
Driver Analysis
Oil demand growth sustains seaborne crude flows
Even after downward revisions, OPEC still projected 2026 global oil demand growth at about 1.17 million barrels per day in its May 2026 update, while the IEA also indicated continuing 2026 demand growth, albeit below prior expectations. That still implies a large base of seaborne crude movement because incremental Asian refinery demand and export basin balancing continue to require long-haul tanker deployment rather than purely local pipeline absorption.
Drivers Impact Analysis
| Driver | (~) % Impact on CAGR Forecast | Geographic Relevance | Impact Timeline |
|---|---|---|---|
| Red Sea rerouting lifts ton-mile demand | +2.4% | Middle East-Europe core, Asia-Europe, Atlantic spill-over | Short term (≤ 2 years) |
| IMO carbon rules force slow steaming and retrofit cycles | +1.8% | Global fleet, Asia yards, EU charter-heavy trades | Medium term (2-4 years) |
| Oil demand growth sustains seaborne crude flows | +1.5% | Asia core, Middle East export basins, Atlantic Basin | Short term (≤ 2 years) |
| EU ETS and FuelEU raise voyage costs and favor efficient tonnage | +1.2% | EU ports core, Mediterranean, North Sea, trans-Atlantic | Medium term (2-4 years) |
| Aging fleet and replacement cycle tighten vessel availability | +1.6% | Global, with strongest effect in VLCC/Suezmax lanes | Medium term (2-4 years) |
| Canal and chokepoint constraints reshape trade economics | +0.9% | Americas, Atlantic-Pacific rebalancing, Panama-linked routes | Short term (≤ 2 years) |
Restraint Analysis
Volatile bunker and carbon cost inflation
Marine fuel costs remain one of the largest components of voyage opex for crude carriers, and in a context of elevated crude prices and tight refining capacity, very low sulfur fuel oil (VLSFO) and marine gasoil (MGO) have seen multi-year price volatility with spikes above 700–800 USD per tonne at key hubs during recent disruptions. At 25–60 tonnes of fuel consumption per day for a large crude carrier depending on speed and age, such spikes can add 15,000–30,000 USD per day to voyage cost, squeezing time-charter equivalents whenever spot freight cannot adjust immediately, and this is before layering on EU Emissions Trading System exposure where CO₂ allowance prices have often oscillated in the 60–90 EUR per tonne corridor.
FuelEU Maritime, which applies to ships of at least 5,000 GT calling at EU ports and targets a 2% reduction in GHG intensity by 2025 with steeper cuts afterward, effectively forces owners and charterers to internalize an incremental carbon cost per tonne-mile on EU-linked trades, amplifying bunker cost inflation and increasing the complexity of optimizing speed, routing, and fuel choice.
Restraint Impact Analysis
| Restraint | (~) % Impact on CAGR Forecast | Geographic Relevance | Impact Timeline |
|---|---|---|---|
| Geopolitical supply disruption and demand destruction | -2.3% | Middle East core, Europe, Asia importers | Short term (≤ 2 years) |
| Volatile bunker and carbon cost inflation | -1.7% | Global, EU-linked trades, major bunkering hubs | Short term (≤ 2 years) |
| Energy-transition policy caps long-run oil demand | -1.9% | OECD core, EU, selected APAC corridors | Long term (≥ 4 years) |
| Sanctions, compliance, and “shadow fleet” distortions | -1.5% | Russia-linked, Iran-linked, cross-Atlantic routes | Medium term (2–4 years) |
| Port, canal, and security bottlenecks | -1.3% | Red Sea, Gulf, Panama-related lanes | Short term (≤ 2 years) |
| Financing, newbuild cost, and yard-capacity constraints | -1.1% | Global, Asia yards, owner clusters | Medium term (2–4 years) |
Opportunity Analysis
Digital freight platforms and data monetization
The opportunity here is not basic voyage optimization—already a baseline operational driver—but the creation of multi-tenant digital freight marketplaces and data products that directly monetize chartering, route, and performance data for the crude carrier segment, where digital penetration still lags container shipping. A platform capturing even 10–15% of annual crude fixtures, in a market that moves many billions of barrels per year, could intermediate tens of billions of USD in freight value and skim 1–2% in platform, analytics, and decision-support fees, implying a 1–2 billion USD annual revenue pool by early 2030s if scaled globally.
Unit economics improve because customer acquisition costs per ship and per charterer fall sharply once a critical mass of counterparties is on-platform, while incremental margins on data products can exceed 50–60% given low marginal cost of data replication.
Opportunity Impact Analysis
| Opportunity | (~) % Potential CAGR Upside | Geographic Relevance | Execution Window |
|---|---|---|---|
| Digital freight platforms and data monetization | +1.6% | Global, North America, EU, APAC hubs | Short term (≤ 2 years) |
| Transition-linked green crude and ESG charter pools | +1.8% | EU, OECD Asia, North America core | Medium term (2-4 years) |
| Mid-size fleet repositioning and segment arbitrage | +1.5% | Atlantic Basin, Med, Asia coastal | Short term (≤ 2 years) |
| Integrated crude logistics and storage-as-a-service | +1.7% | Middle East export hubs, Asia importers | Medium term (2-4 years) |
| M&A roll-ups and fleet rationalization platforms | +1.4% | Global, Greece/Norway/Singapore clusters | Medium term (2-4 years) |
| Dual-fuel newbuilds and carbon-credit monetization | +1.9% | EU, East Asia yards, global blue-chip charterers | Long term (≥ 4 years) |
Challenges Analysis
Persistent route and security volatility
The IEA estimated global oil supply would fall by around 8% of demand as Hormuz was blocked and Gulf producers collectively shut in roughly 10 million barrels per day, forcing large-scale rerouting and temporary floating storage that extended average voyage durations by 10–20 days on some flows and drove the Baltic Dirty Tanker Index to record levels above 3,700 points, more than 200% above 2023 levels.
This volatility is a friction drag because it inflates war-risk premia, reinsurance costs, and operating expenses by tens of thousands of USD per day per voyage while increasing schedule variance and idle time due to convoying, diversions, or port congestion, which can shave 1–2 percentage points off achievable fleet utilization versus a stable routing environment even when headline rates are high.
Challenges Impact Analysis
| Challenge | (~) % CAGR Friction Drag | Geographic Relevance | Mitigation Horizon |
|---|---|---|---|
| Persistent route and security volatility | -1.4% | Middle East, Red Sea, EU–Asia lanes | Medium term (2-4 years) |
| Regulatory complexity and reporting burden | -1.2% | EU regulatory hubs, OECD routes | Long term (≥ 4 years) |
| Talent, crewing, and skills constraints | -0.9% | Global, Asia crewing centers | Long term (≥ 4 years) |
| Digital fragmentation and cyber exposure | -1.0% | Global blue-water trades | Medium term (2-4 years) |
| Yard, retrofit, and drydock congestion | -1.1% | East Asia yards, global drydocks | Medium term (2-4 years) |
| Capital cost volatility and risk appetite cycles | -1.0% | Global owner and lender clusters | Medium term (2-4 years) |
Geopolitical Impact Analysis
Geopolitical Chokepoint Volatility and Route Diversification Reshaping Crude Oil Carrier Deployment
Crude oil carrier deployment is becoming increasingly sensitive to political tension around the Strait of Malacca and Strait of Hormuz. In the fourth quarter of 2025, Malacca handled 24.0 million barrels per day, including 17.4 million barrels per day of crude oil and condensate. Hormuz carried 20.7 million barrels per day, of which 15.2 million barrels per day consisted of crude and condensate. This concentration leaves tanker operators exposed to sanctions, conflict and naval disruption, encouraging flexible fleet positioning.
Route fragmentation is also changing voyage distances and vessel availability. During the same quarter, the Suez Canal and SUMED system handled 5.1 million barrels per day, while Bab el-Mandeb carried 5.2 million barrels per day and Cape of Good Hope traffic reached 9.6 million barrels per day. By the first quarter of 2026, Hormuz flows had declined to 14.6 million barrels per day, showing how geopolitical shocks can redirect cargoes, strengthen ton-mile demand and increase fuel, insurance and scheduling risks.
Regional Analysis
Asia Pacific Held the Largest Share of the Global Crude Oil Carriers Market.
Asia-Pacific leads with a 34.67% market share, supported by major crude-importing economies, extensive refining networks and strong energy-security requirements. In December 2025, Japan held 263 million barrels in government-controlled strategic oil inventories. Japanese law also requires industry to maintain stocks equal to 70 days of demand, or roughly 220 million barrels, alongside a separate 90-day government reserve. These large storage obligations support recurring crude deliveries and sustained demand for long-distance tanker services across the region.
North America is emerging as the growing regional market, driven by expanding U.S. crude production and rising export availability. Government data show that U.S. output reached a record 13.6 million barrels per day in 2025, increasing by 350,000 barrels per day from the previous year. Production in the Permian Basin alone climbed to 6.6 million barrels per day, strengthening cargo availability at Gulf Coast export terminals and supporting tanker deployment on Atlantic and Pacific routes.
Key Regions and Countries Covered
- North America
- The US
- Canada
- Europe
- Germany
- France
- The UK
- Spain
- Italy
- Russia & CIS
- Rest of Europe
- APAC
- China
- Japan
- South Korea
- India
- ASEAN
- Rest of APAC
- Latin America
- Brazil
- Mexico
- Rest of Latin America
- Middle East & Africa
- GCC
- South Africa
- Rest of MEA
Key Players Analysis
Crude Oil Carrier operators focus on strengthening fleet efficiency, route flexibility, and regulatory compliance to maintain competitiveness. A key priority is continuous vessel modernization, including the use of fuel-efficient hull designs, advanced propulsion systems, and digital navigation technologies that reduce bunker consumption and improve voyage performance. Companies further invest in fleet renewal and retrofit programs, as newer vessels offer better operating reliability and help meet stricter emission standards. Close coordination with oil producers, refiners, port authorities, and charterers helps secure cargo availability and improve fleet utilization during periods of volatile freight rates.
Strategic vessel deployment across major export corridors enables operators to respond quickly to changing trade patterns, sanctions, and geopolitical disruptions. Additionally, operators emphasize predictive maintenance, real-time vessel tracking, cybersecurity, and crew safety to ensure dependable operations at scale, while forming long-term charter agreements and strategic shipping partnerships to stabilize revenue, strengthen customer relationships, and improve positioning across high-volume crude oil transportation routes.
The Major Players In The Industry
- China Cosco Shipping Corporation Limited
- China Merchants Group Ltd
- National Iranian Oil Company (NIOC)
- The National Shipping Co. Saudi Arabia
- Euronav NV
- Angelicoussis Shipping Group Ltd
- Teekay Corporation
- Tsakos Energy N/SH
- Minerva Marine Inc.
- Petroliam Nasional Berhad (PETRONAS)
- Other Key Players
Key Development
- In September 2025, The National Shipping Co. Saudi Arabia completed a USD 1 billion acquisition of nine VLCCs, raising its crude-carrier fleet to 50 vessels and strengthening long-distance oil transportation capacity.
- In December 2025, China COSCO Shipping Corporation Limited reported 1,660 vessels totaling 135 million DWT, including 261 tankers with 7 million DWT, reinforcing its global oil-shipping scale and fleet flexibility.
Report Scope
| Report Features | Description |
|---|---|
| Market Value (2025) | USD 263.4 Bn |
| Forecast Revenue (2035) | USD 391.6 Bn |
| CAGR (2026-2035) | 4.0% |
| Base Year for Estimation | 2025 |
| Historic Period | 2020-2024 |
| Forecast Period | 2026-2035 |
| Report Coverage | Revenue Forecast, Market Dynamics, Competitive Landscape, Recent Developments |
| Segments Covered | By Type (Panamax (55,000-84,000 DWT), Aframax (85,000-124,999 DWT), Suezmax (125,000- 199,999 DWT) and Very Large Crude Carrier (Above 200,000 DWT)), By Propulsion Type (Conventional Heavy Fuel Oil, Dual-Fuel LNG, Low-Sulfur Fuel Oil, Hybrid Electric Assist and Other Alternative Fuels), By Ownership Model (Oil Company Owned, Independent Tanker Operators, Charter Fleet Operators and Government and State-linked Fleets) |
| Regional Analysis | North America – The US & Canada; Europe – Germany, France, The UK, Spain, Italy, Russia & CIS, Rest of Europe; APAC– China, Japan, South Korea, India, ASEAN & Rest of APAC; Latin America– Brazil, Mexico & Rest of Latin America; Middle East & Africa– GCC, South Africa, & Rest of MEA |
| Competitive Landscape | China Cosco Shipping Corporation Limited, China Merchants Group Ltd, National Iranian Oil Company (NIOC), The National Shipping Co. Saudi Arabia, Euronav NV, Angelicoussis Shipping Group Ltd, Teekay Corporation, Tsakos Energy N/SH, Minerva Marine Inc., Petroliam Nasional Berhad (PETRONAS), Other Key Players. |
| Customization Scope | Customization for segments, region/country-level will be provided. Moreover, additional customization can be done based on the requirements. |
| Purchase Options | We have three licenses to opt for: Single User License, Multi-User License (Up to 5 Users), Corporate Use License (Unlimited Users and Printable PDF) |





































