


Report Overview
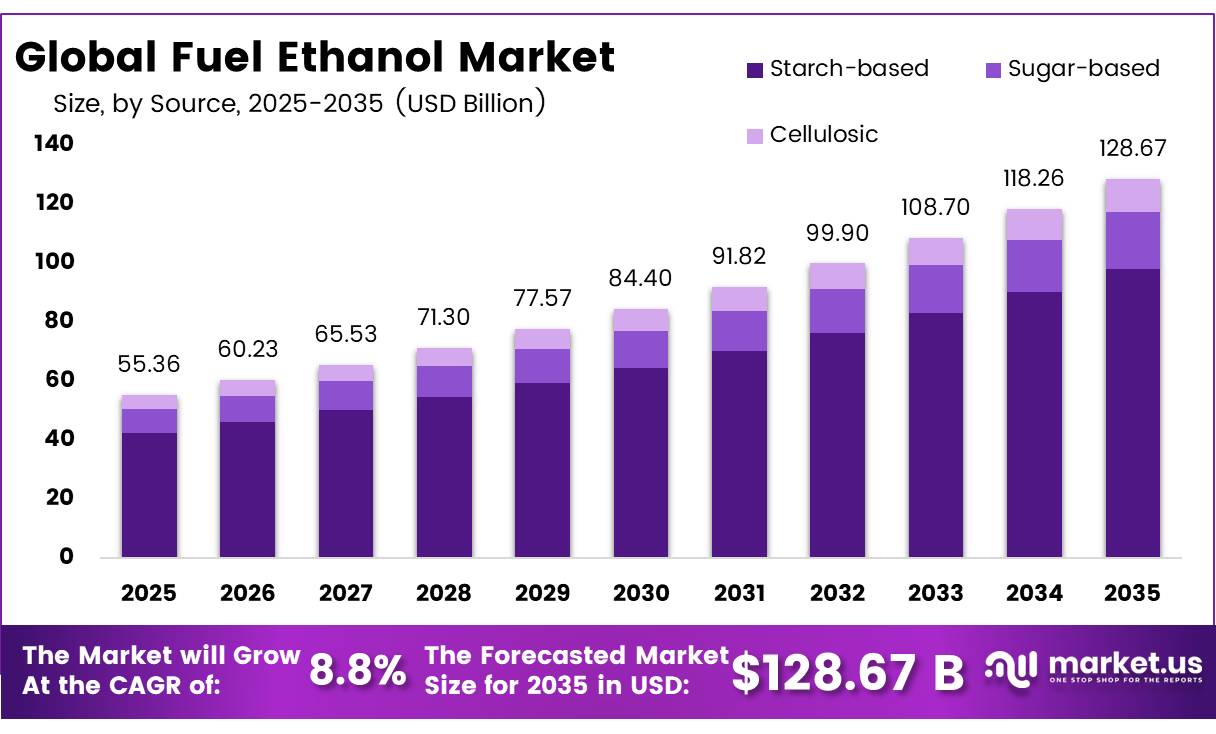
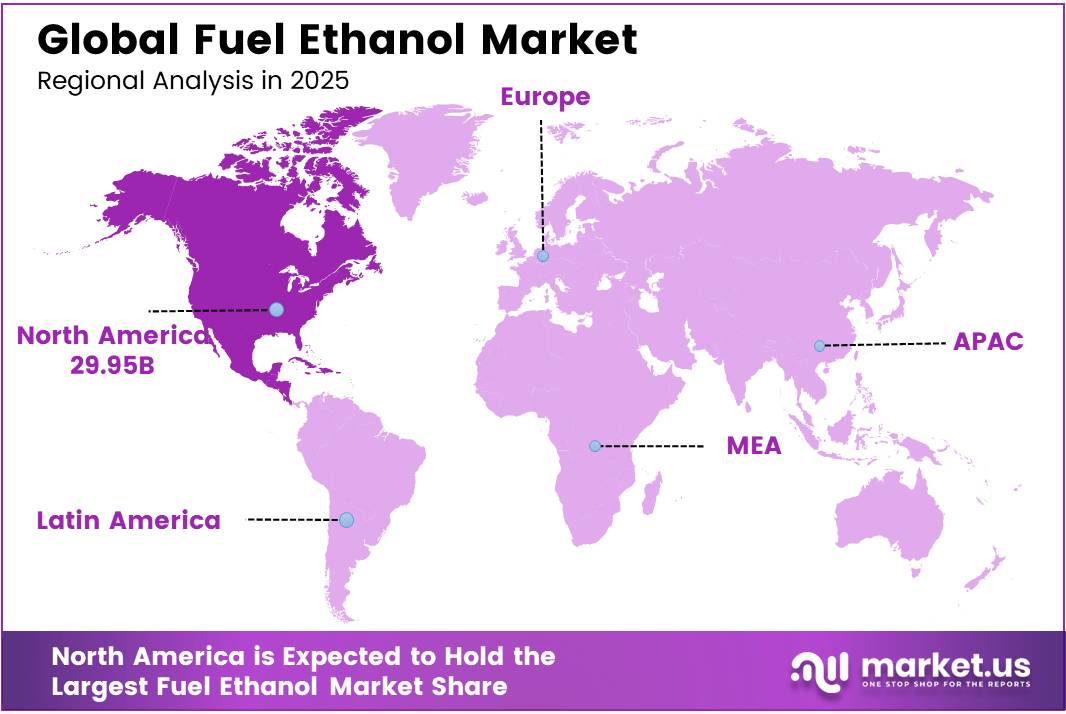
In 2025, the global fuel ethanol market was valued at USD 55.4 billion, and between 2026 and 2035, the market is projected to grow at a CAGR of 8.8%, reaching approximately US$128.7 billion by 2035. In 2025, Asia Pacific led the market, achieving over 51.4% share with a revenue of USD 29.95 Billion.
Fuel ethanol is a renewable transport fuel produced mainly from sugar- and starch-based feedstocks, while emerging facilities are adding agricultural residues and cellulosic materials. It is commonly blended with gasoline as E10 or E15, while flex-fuel vehicles can use E85 containing 51%–83% ethanol. In the United States, more than 98% of gasoline contains ethanol, showing that the product is already integrated into conventional fuel distribution.
- Renewable Fuels Association data place global fuel-ethanol output at approximately 0 billion gallons in 2025, up from 31.36 billion gallons in 2024. The United States produced 16.49 billion gallons, while Brazil produced 8.65 billion gallons, together representing around 79% of worldwide output.
- The U.S. Energy Information Administration also recorded 191 ethanol plants with combined annual capacity of 48 billion gallons as of January 1, 2025, underlining the scale of established production assets.
Key Takeaways
- In 2025, the fuel ethanol industry was estimated to be worth USD 55.4 billion worldwide.
- By 2035, the market is expected to reach USD 128.7 billion, growing at a compound annual growth rate (CAGR) of 8.8%.
- Starch-based ethanol accounted for 76.3% of the market, making it the dominant source.
- Based on the technology type, the dry mill segment dominated the market, accounting for a significant share of approximately 89.6%.
- Hydrous ethanol dominated the market by type, accounting for 57.1% of the total.
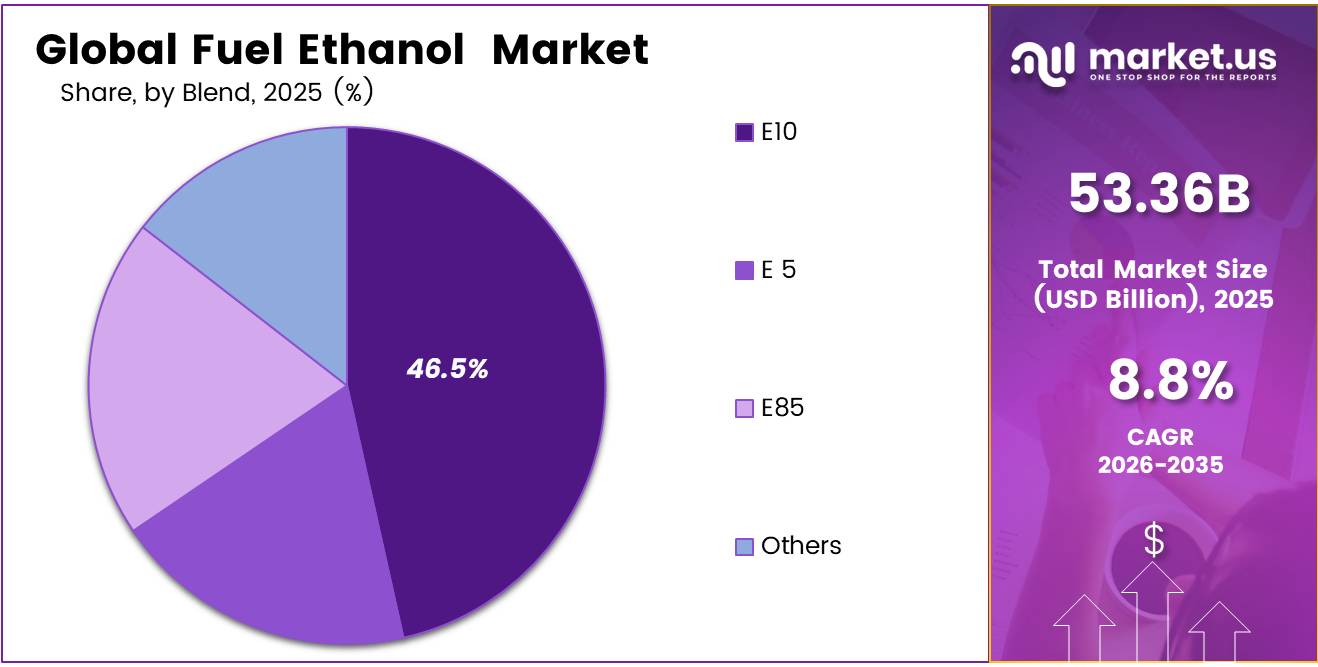
- E10 was the most popular ethanol blend, accounting for 46.5% of the gasoline ethanol market.
- Passenger automobiles make up the largest segment of the market, making up about 65.8% of all vehicle categories of the revenue.
- In 2025, North America was the most dominant region in the fuel ethanol market, accounting for 54.1% of the total global consumption.
Demand is being supported by blending mandates, energy-security objectives, octane requirements and pressure to reduce transport-sector carbon intensity.
- In March 2026, the U.S. Environmental Protection Agency finalized total applicable Renewable Fuel Standard volumes of 81 billion ethanol-equivalent gallons for 2026 and 27.02 billion gallons for 2027.
Future opportunities are expected to move toward lower-carbon production pathways. Carbon capture at fermentation plants, renewable process heat, higher agricultural productivity, cellulosic feedstocks and valuable co-products can reduce lifecycle emissions and strengthen plant economics. Ethanol also offers opportunities beyond road transport through alcohol-to-jet conversion.
- The U.S. Sustainable Aviation Fuel Grand Challenge targets 3 billion gallons of domestic SAF production annually by 2030 and sufficient supply to cover 100% of domestic aviation-fuel demand by 2050.
The long-term outlook remains positive but policy-sensitive. The International Energy Agency expects renewable energy consumption in transport to rise 50% by 2030, with road biofuels contributing 35% of the increase. However, feedstock-price volatility, land-use scrutiny, limited infrastructure for higher ethanol blends and slower cellulosic commercialization may restrict margins.
Source Analysis
Ethanol derived from starch is a significant market segment.
The market is divided into three categories based on the ethanol’s source: cellulosic, sugar-based, and starch-based. Due to the availability of feedstock, ease of processing, and well-established infrastructure, starch-based ethanol dominated the market with a 76.3% market share. The main source of starch in North America, produced in enormous quantities with consistent quality, guaranteeing a steady supply for ethanol facilities.
- According to the U.S. Department of Agriculture (USDA), the United States utilized approximately 4 billion bushels of corn for fuel ethanol production during the 2024/25 marketing year, highlighting corn’s dominant role as the primary starch feedstock for ethanol production.
Cellulosic ethanol, while more sustainable, necessitates extensive pre-treatment and enzymatic processes to degrade lignocellulosic biomass, making it technologically demanding and capital-intensive. As a result, starch-based ethanol dominates due to its efficiency, scalability, and compatibility with existing agricultural and fuel infrastructure.
Technology Analysis
Dry Mill Dominated the Fuel Ethanol Market
The dry mill segment dominated the market, accounting for 89.6% of the total market share, primarily due to its lower capital requirement, operational simplicity, and high production efficiency. Dry milling involves grinding the entire grain (mainly corn), followed by fermentation and distillation to produce ethanol, without separating the grain into individual components at the initial stage.
- The U.S. Department of Agriculture (USDA) reported that the United States has over 190 ethanol biorefineries with an annual production capacity exceeding 18 billion gallons, with the overwhelming majority operating as dry mill facilities using corn as the primary feedstock.
Type Analysis
The market for fuel ethanol was dominated by hydrous ethanol.
The fuel ethanol industry is divided into two categories based on type: hydrous ethanol and anhydrous ethanol. Because hydrous ethanol is directly usable in flex-fuel vehicles and requires less processing, it dominated the market, with a 57.1% market share. Because it has a larger water content, hydrous ethanol is usually utilized as a direct fuel substitute in engines that are specifically constructed for it or that run on flex fuel without the need for further dehydration.
- According to the Brazilian National Association of Automotive Vehicle Manufacturers (ANFAVEA), flex-fuel vehicles accounted for more than 80% of Brazil’s light-duty vehicle fleet in 2025, supporting strong demand for hydrous ethanol (E100) as a standalone transportation fuel.
Blend Analysis
E10 Dominated the Fuel Ethanol Blend Market
The E10 segment dominated the market, accounting for 46.5% of the total market share, primarily due to its wide adoption as a standard transportation fuel and strong regulatory support across major economies. E10 is a blend containing 10% ethanol and 90% gasoline, and it is widely used because it can be utilized in most existing internal combustion engines without requiring any modifications.
E5 is generally used in markets with lower ethanol blending requirements or older vehicle fleets that require minimal ethanol content for compatibility. On the other hand, E85 contains up to 85% ethanol and is mainly used in flex-fuel vehicles, but its adoption remains limited due to infrastructure constraints and lower vehicle penetration. The others category includes region-specific or experimental blends used under local fuel policies and climatic conditions. However, these remain niche compared to standardized blends.
Vehicle Type Analysis
The market for vehicle types was dominated by passenger cars.
The market is divided into passenger automobiles and commercial vehicles based on the kind of vehicle. Due to growing demand for personal mobility, urbanization, and rising vehicle affordability, passenger cars accounted for 65.8% of the market. The segment includes hatchbacks, sedans, SUVs, and other types of passenger cars.
The others category includes niche passenger vehicle models with relatively low market share. Light-duty trucks are primarily utilized for urban logistics and last-mile delivery operations, while heavy-duty trucks mainly support long-haul transportation and industrial freight movement.
Key Market Segments
By Source
- Starch-based
- Sugar-based
- Cellulosic
By Technology
- Wet Mill
- Dry Mill
By Type
- Hydrous
- Anhydrous
By Blend
- E5
- E10
- E85
- Others
By Vehicle Type
- Passenger Cars
-
- Hatchback
- Sedan
- SUV
- Others
- Commercial Vehicles
-
- Light Duty
- Heavy Duty
- Other
Driver Analysis
Blending mandate escalation and enforceable volume setting
In 2026, the strongest demand-side driver remains governments converting ethanol demand from discretionary blending into regulated offtake. In the U.S., EPA finalized 2026 Renewable Fuel Standard total applicable renewable fuel volumes at 26.81 billion RINs, up from a 25.82 billion-RIN volume requirement before 2026 SRE reallocation, while also reallocating 70% of small-refinery exemptions granted for 2023–2025; that materially tightens obligated-party compliance and improves visibility for ethanol-adjacent demand planning.
In India, the policy signal is even more direct: the 20% ethanol-in-petrol target was advanced to ESY 2025–26, and OMCs had already reached 19.05% average blending by 31 July 2025, with 19.93% achieved in July 2025 alone, meaning the market entered 2026 with the mandate effectively near execution rather than aspiration.
In the EU, RED II requires fuel suppliers to reach at least 14% renewable energy in road and rail transport by 2030, preserving structural blending demand even where crop-based fuels are capped. Strategically, this driver reduces volume risk for producers, shifts procurement toward long-term supply contracts, and supports higher capacity utilization assumptions; that is why it carries the largest modeled CAGR uplift of about +2.2 percentage points.
Drivers Impact Analysis
| Driver | (~) % Impact on CAGR Forecast | Geographic Relevance | Impact Timeline |
|---|---|---|---|
| Blending mandate escalation and enforceable volume setting | +2.2% | North America core, India core, Brazil core, EU support | Short term (≤ 2 years) |
| Retail fuel acceptance of higher ethanol blends | +1.4% | U.S. core, Brazil core, selected APAC corridors | Short term (≤ 2 years) |
| Feedstock unlocking through grain, sugar, and surplus stock diversion | +1.7% | India core, U.S. corn belt, Brazil cane belt | Medium term (2-4 years) |
| Carbon-intensity regulation and certification economics | +1.1% | Brazil core, EU core, North America spill-over | Medium term (2-4 years) |
| Distillery conversion, storage, and logistics build-out | +1.3% | India core, U.S. Midwest-to-coast corridors, Brazil logistics belts | Medium term (2-4 years) |
| Advanced biofuel and residue-to-ethanol commercialization | +0.8% | EU, India, North America, selective APAC | Long term (≥ 4 years) |
Restraint Analysis
Corn feedstock inflation
The largest near-term restraint remains feedstock cost inflation because corn still dominates global fuel ethanol variable cost structure, and USDA’s February 2026 outlook raised U.S. 2025/26 corn exports to 3.3 billion bushels, tightening domestic availability and increasing the probability that corn remains structurally bid during the current procurement cycle rather than mean-reverting to surplus-era pricing.
In practical plant economics, feedstock commonly represents roughly 65% to 75% of cash operating cost for dry-mill ethanol, so even a 10% to 15% uplift in corn procurement cost can erode plant-level crush margins by 20% to 35% when coproduct credits and ethanol realizations do not reprice immediately, forcing lower run rates, deferred maintenance turnarounds, and slower debottleneck CapEx.
Restraint Impact Analysis
| Restraint | (~) % Impact on CAGR Forecast | Geographic Relevance | Impact Timeline |
|---|---|---|---|
| Corn feedstock inflation | -1.4% | North America core; India-linked import corridors | Short term (≤ 2 years) |
| Blend-wall demand ceiling | -1.2% | North America core; mature OECD markets | Medium term (2-4 years) |
| Crop-based policy caps | -1.0% | EU; UK-aligned Europe | Medium term (2-4 years) |
| Margin volatility from stocks | -0.9% | U.S. Midwest; export-linked Atlantic markets | Short term (≤ 2 years) |
| Water-stress and cane diversion | -0.8% | India; Brazil drought belts; APAC deficit markets | Medium term (2-4 years) |
| Import-credit and trade friction | -0.7% | U.S. import channels; EU import markets | Long term (≥ 4 years) |
Opportunity Analysis
Ethanol-to-jet buildout
This is an opportunity rather than a baseline driver because conventional road-fuel blending already underpins today’s ethanol demand, whereas alcohol-to-jet opens an adjacent aviation fuel TAM that is not yet fully monetized by most ethanol producers; the commercial inflection is now visible because the EU’s ReFuelEU Aviation regime has created binding SAF supply obligations from 2025 onward, with compliance pressure extending across major EU airports and fuel suppliers, while U.S. policy and federal outlooks continue to support biofuel capacity optionality into the 2030s.
Strategically, an ethanol producer that diverts even 8% to 12% of an existing 300- to 500-million-gallon-per-year platform into jet-fuel upgrading could unlock a new revenue pool tied to aviation premia rather than gasoline parity, with blended EBITDA margin expansion plausibly rising 300 to 600 basis points if conversion economics and carbon-intensity qualification are achieved; because aviation fuel buyers value long-term contracted supply, this pathway can also reduce revenue volatility, support multi-year offtake contracts, and add roughly +2.4 percentage points to sector CAGR where first movers secure logistics, certification, and airport-fuel partnerships before SAF quotas tighten further toward 2030 and beyond.
Opportunity Impact Analysis
| Opportunity | (~) % Potential CAGR Upside | Geographic Relevance | Execution Window |
|---|---|---|---|
| Ethanol-to-jet buildout | +2.4% | North America core, EU | Medium term (2-4 years) |
| Export-led deficit market capture | +1.9% | APAC, Latin America, North Africa | Short term (≤ 2 years) |
| E15/E20 retail infra monetization | +1.6% | U.S. Midwest & national, India | Short term (≤ 2 years) |
| Carbon-credit stacking platforms | +1.4% | Brazil, North America | Medium term (2-4 years) |
| Residue-based advanced ethanol | +2.1% | EU, India, North America | Long term (≥ 4 years) |
| Cross-border asset roll-up | +1.7% | U.S.-Brazil-India corridors | Medium term (2-4 years) |
Challenges Analysis
Feedstock yield volatility
Chronic volatility in corn, sugarcane, and cereal yields creates a structural input‑cost noise band equivalent to 12–18% annualized variation in feedstock prices, translating into a recurring 200–350 basis‑point swing in plant EBITDA margins and forcing ethanol producers to operate at 80–90% of nameplate capacity to preserve working capital buffers. U.S. fuel ethanol plants had aggregate nameplate capacity of about 17.7 billion gallons per year in 2023, while actual output in 2022 was roughly 15.4 billion gallons, implying a persistent 12–13% capacity underutilization that functions as a risk hedge against crop and price shocks rather than a pure demand constraint.
Climate‑linked anomalies such as 5–10% yield drops in key corn and cane belts in poor rainfall yearsripple into 3–6 cents per gallon feedstock cost swings, which, on a base production cost of 1.30–1.45 dollars per gallon, equate to 2–4% unit cost inflation cycles every 12–24 months, compelling blenders and producers to reprice contracts and delay marginal capacity additions.
Drawing on observed world fuel ethanol production fluctuations total output fell from about 29.4 billion gallons in 2019 to 26.5 billion in 2020 before recovering to around 29.6 billion by 2023, a swing of roughly 10% the sector effectively “prices in” a permanent risk premium that clips 1.5–2.0 percentage points off otherwise feasible high‑single‑digit volume growth.
Challenges Impact Analysis
| Challenge | (~) % CAGR Friction Drag | Geographic Relevance | Mitigation Horizon |
|---|---|---|---|
| Feedstock yield volatility | -1.6% | US–Brazil agro belts, India cane zones, EU cereals | Long term (≥ 4 years) |
| Water–land sustainability pressure | -1.3% | US Midwest, Brazil Center-South, India Gangetic, EU farms | Long term (≥ 4 years) |
| Logistics and storage bottlenecks | -1.1% | North America core, India blending corridors, EU ports | Medium term (2–4 years) |
| Policy and mandate uncertainty | -1.4% | US RFS states, Brazil RenovaBio, EU RED bloc, India EBP | Medium term (2–4 years) |
| Technology and efficiency gap | -1.0% | Emerging APAC, LATAM ex-Brazil, Africa | Long term (≥ 4 years) |
| Skilled biofuel workforce deficit | -0.7% | Global production hubs and OEM clusters | Medium term (2–4 years) |
Geopolitical Impact Analysis
Geopolitical Instability Driving Fuel Ethanol Price Surges
Geopolitical instabilities, especially in key energy-producing regions, have greatly influenced the dynamics of the fuel ethanol industry. In destabilizing the supply chains of crude oil and increasing its prices, such geopolitical instability has made it more economical for companies to incorporate fuel ethanol in their blends. According to EIA, production disruptions in 2022 sent the price of Brent crude past the mark of $100 per barrel, thus increasing the demand for ethanol as an economically attractive octane booster, yet making the import of ethanol’s primary raw material increasingly difficult.
- Disruption in the Supply Chain: USDA reported that 2022 Ukrainian corn exports were lower by 3%, resulting in tighter markets for one of the key ingredients in the production of ethanol.
- Balance of Blending Requirements: In light of the unstable prices of crude oil, countries such as India need to keep adjusting their blending requirements based on unpredictable agricultural imports and unstable oil prices.
Regional Analysis
The largest market share for fuel ethanol on a global level was occupied by North America.
North America had been the dominant regional market in 2025, with a significant market share of 51.4%, representing a USD 29.95 Billion value of the worldwide fuel ethanol market. It is mainly because of the leading position of the USA in the region, which is backed up by the extensive production of ethanol from corn and stringent blending requirements stipulated by the government.
- According to the USDA, the country produced around 15.0 billion gallons of gasoline ethanol from 5.2 billion bushels of corn in 2022. Moreover, the EPA’s RFS stipulates that 15 billion gallons of conventional biofuels, mainly ethanol, must be blended with transportation fuel annually in the USA.
Additionally, E10 gasoline containing 10% ethanol is readily available at service stations in the USA, which ensures a constant demand. According to Natural Resources Canada, ethanol blends ranging from 5% to 10% in gasoline are mandated by the national and provincial biofuel mandates in Canada.
Therefore, North America continues to be the largest and most advanced fuel ethanol industry globally due to its comprehensive regulatory environment, ample raw materials, and reliable fuel infrastructure.
Key Regions and Countries Covered
- North America
- The US
- Canada
- APAC
- China
- Japan
- South Korea
- India
- ASEAN
- Rest of APAC
- Europe
- Germany
- France
- The UK
- Spain
- Italy
- Russia & CIS
- Rest of Europe
- Latin America
- Brazil
- Mexico
- Rest of Latin America
- Middle East & Africa
- GCC
- South Africa
- Rest of MEA
Key Players Analysis
Producers of fuel ethanol focus their efforts on improving production efficiency, expanding the range of raw materials, and building the ability to generate low-carbon fuels. In particular, utilizing cutting-edge fermentation techniques, carbon capture technologies, and energy-efficient production facilities to maximize ethanol yield while reducing carbon intensity continues to be a crucial strategic sector.
To address the rising global demand for biofuels driven by mandated fuel blending programs and sustainable transportation regulations, fuel ethanol producers are increasingly investing in large-scale production facilities across North America and Brazil. Market participants are also strengthening vertical integration strategies encompassing corn and sugarcane cultivation, ethanol production, and distribution networks to enhance supply chain stability, optimize operational costs, and improve logistics efficiency.
In addition, manufacturers are diversifying their business models by exploring ethanol-to-Sustainable Aviation Fuel (SAF) technologies, enabling them to expand revenue opportunities beyond conventional gasoline blending applications and capitalize on the growing decarbonization trend within the aviation sector.
The Major Players in The Industry
- Valero Energy Corporation
- Archer-Daniels-Midland Company
- POET, LLC
- RAÍZEN S.A.
- FS Fueling Sustainability
- Inpasa
- Green Plains Inc.
- Alto Ingredients, Inc.
- Marquis Energy
- Aemetis, Inc.
- The Andersons, Inc.
- Triveni Engineering & Industries Ltd.
- BIOAGRA SA
- Clonbio Group
Key Development
- In May 2025, RAÍZEN S.A. continued to expand its role as a major ethanol producer in South America, capitalizing on Brazil’s strong biofuel policies and sugarcane feedstock base to supply both domestic fuel ethanol demand and export markets, reinforcing its inclusion among the primary global fuel ethanol players.
- In May 2025, Valero Energy Corporation strengthened its position in the fuel ethanol market as its ethanol segment moved into a more profitable phase, supported by higher production volumes of around 4.8 million gallons per day reported for late 2025 and continued integration with its broader low‑carbon fuels portfolio.
Report Scope
| Report Features | Description |
|---|---|
| Market Value (2025) | USD 55.36 Bn |
| Forecast Revenue (2035) | USD 128.67 Bn |
| CAGR (2026-2035) | 8.8% |
| Base Year for Estimation | 2025 |
| Historic Period | 2020-2024 |
| Forecast Period | 2026-2035 |
| Report Coverage | Revenue Forecast, Market Dynamics, Competitive Landscape, Recent Developments |
| Segments Covered | By Source (Starch-based, Sugar-based, Cellulosic), By Technology (Wet Mill, Dry Mill), By Type (Hydrous, Anhydrous), By Blend (E5, E10, E85, Others), By Vehicle Type (Passenger Cars, Commercial Vehicles, Others) |
| Regional Analysis | North America – The US & Canada; Europe – Germany, France, The UK, Spain, Italy, Russia & CIS, Rest of Europe; APAC– China, Japan, South Korea, India, ASEAN & Rest of APAC; Latin America– Brazil, Mexico & Rest of Latin America; Middle East & Africa– GCC, South Africa, & Rest of MEA |
| Competitive Landscape | Valero Energy Corporation, Archer-Daniels-Midland Company, POET, LLC, RAÍZEN S.A., FS Fueling Sustainability, Inpasa, Green Plains Inc., Alto Ingredients, Inc., Marquis Energy, Aemetis, Inc., The Andersons, Inc., Triveni Engineering & Industries Ltd., BIOAGRA SA, Clonbio Group, Other Key Players |
| Customization Scope | Customization for segments, region/country-level will be provided. Moreover, additional customization can be done based on the requirements. |
| Purchase Options | We have three licenses to opt for: Single User License, Multi-User License (Up to 5 Users), Corporate Use License (Unlimited Users and Printable PDF) |





































