


Report Overview
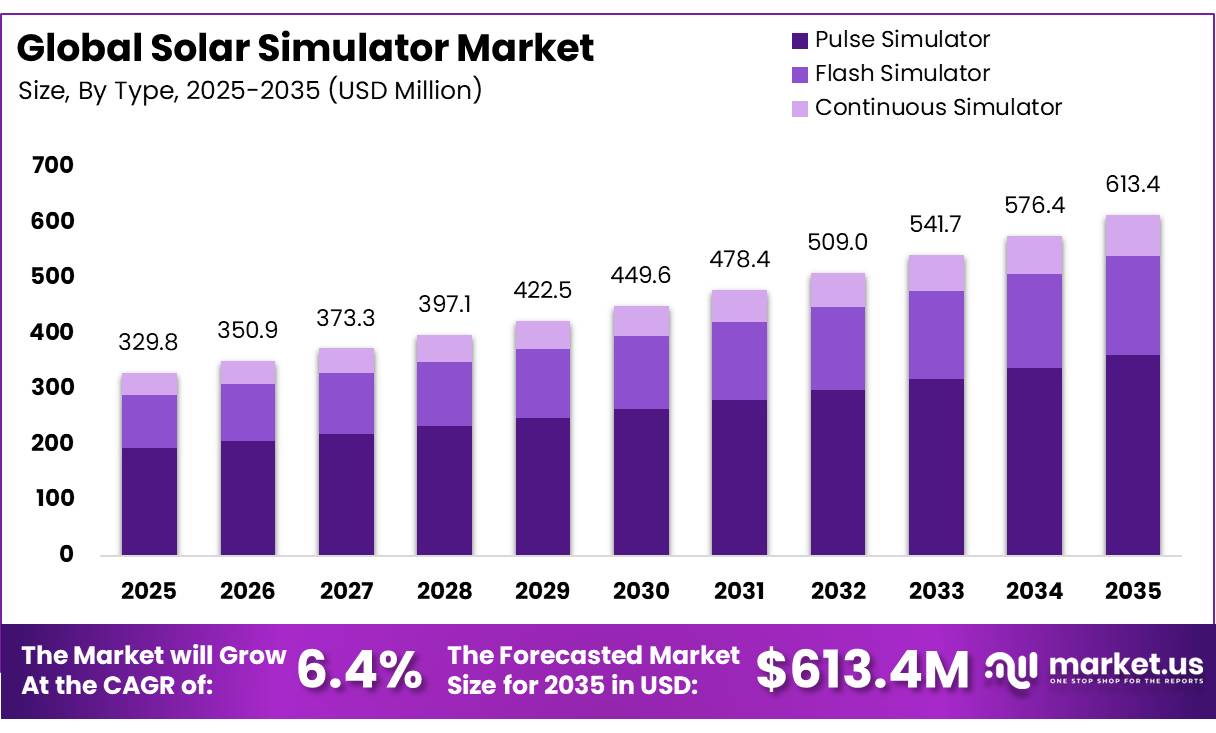
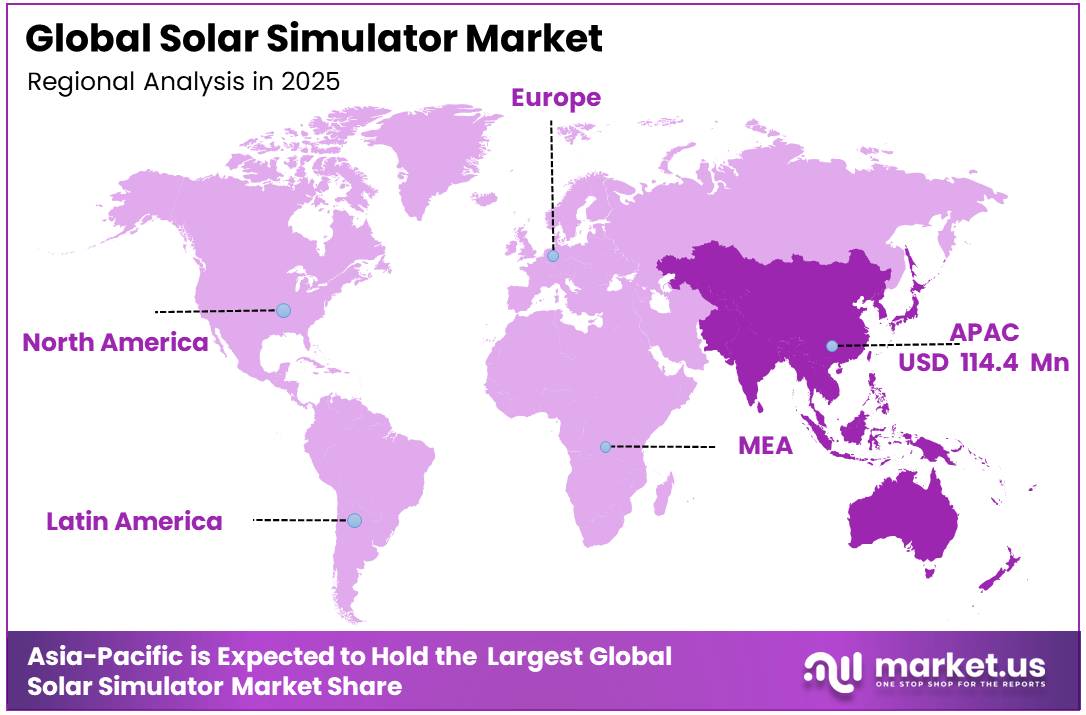
In 2025, the Global Solar Simulator Market was valued at USD 329.8 Million, and between 2026 and 2035, this market is estimated to register a CAGR of 6.4%, reaching about USD 613.4 Million by 2035. Asia-Pacific held a dominant market position, capturing more than a 34.67% share, holding USD 114.4 Million in revenue.
The solar simulator market comprises artificial light sources engineered to replicate terrestrial solar irradiance for indoor testing of photovoltaic (PV) cells and modules, measuring current-voltage performance under controlled conditions.
- Simulators are classified by spectral match, spatial non-uniformity, and temporal instability under the International Electrotechnical Commission (IEC) 60904-9:2020 standard, which defines four classes: A+, A, B, and C. A parallel classification exists under ASTM International’s E927-19 standard, governing both pulsed and steady state simulators used in calibration laboratories and photovoltaic manufacturing lines.
- According to the International Energy Agency (IEA), global solar PV capacity additions surpassed 600 gigawatts (GW) for the first time in 2025, rising by around 12% year on year and lifting cumulative installed capacity to approximately 2,800 GW, making solar the technology with the largest installed generation capacity globally. Thirty countries installed over 1 GW of solar PV in a single year, almost double the number recorded in 2020.
Rising module efficiency requirements are reinforcing simulator demand. Per the IEA Photovoltaic Power Systems Programme (IEA-PVPS) Trends in Photovoltaic Applications 2025 report, n-type cell technologies represented 70% of global PV production, bifacial modules accounted for over 75% of production, and utility scale systems made up about 62% of new installations by end of 2024. These shifts require higher-class simulators and frequent recalibration to maintain measurement accuracy across evolving cell architectures.
Government funding continues supporting solar manufacturing and testing infrastructure. The United States Department of Energy’s Solar Energy Technologies Office (SETO) issued its Fiscal Year 2025 Solar Module and Solar Hardware (SMASH) Incubator, funding up to 10 research, development, and demonstration (RD&D) awards of $1 million to $4 million each for crystalline silicon and cadmium telluride module technologies, sustaining investment in domestic photovoltaic testing and quality assurance capacity.
Key Takeaways
- The Global Solar Simulator Market was valued at USD 329.8 million in 2025.
- The global market is projected to grow at a CAGR of 6.4% and is estimated to reach USD 613.4 million by 2035.
- On the basis of type, Pulse Simulator dominated the market, constituting 58.78% of the total market share.
- Based on the light source, Light Emitting Diodes (LED) dominated the market, accounting for 34.34% of the total market share.
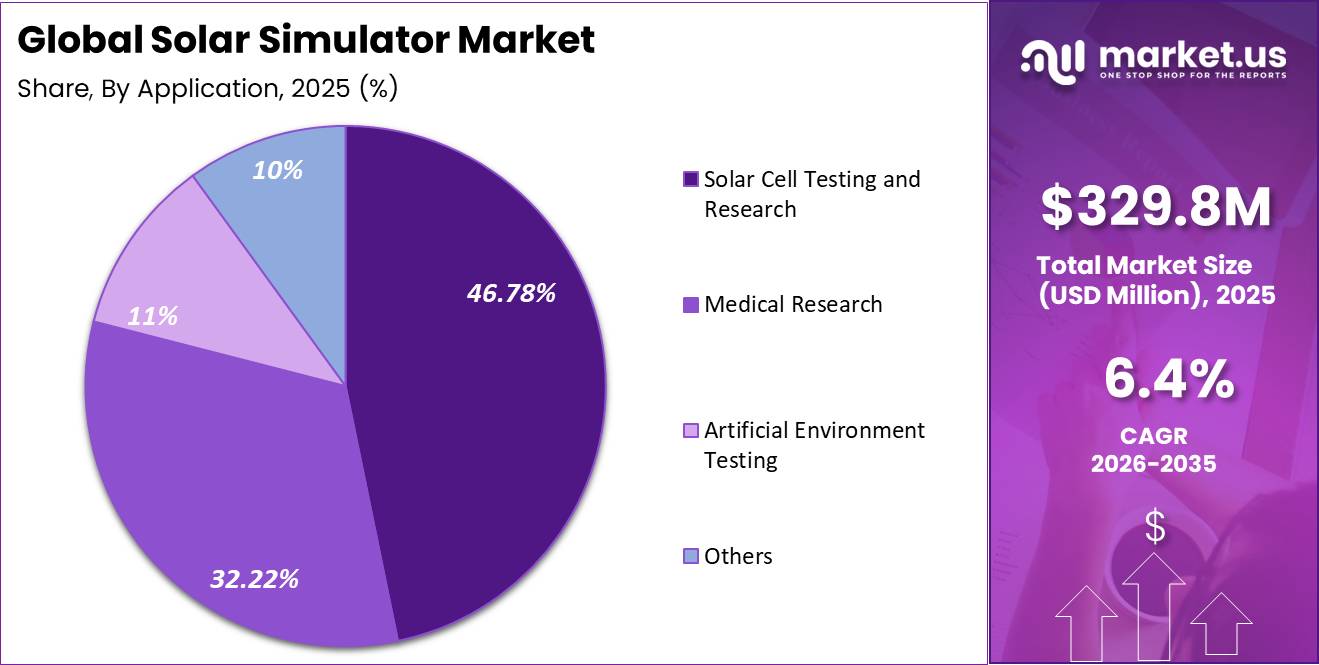
- Based on the application, Solar Cell Testing and Research dominated the market, accounting for 46.78% of the total market share.
- In 2025, Asia-Pacific was the most dominant region in the solar simulator market, accounting for 34.67% of the global market.
By Type
Pulse Simulator leads with 58.78% share owing to its high accuracy and widespread use in photovoltaic testing.
In 2025, Pulse Simulator held a dominant market position, capturing more than a 58.78% share in the Global Solar Simulator Market. Its leading position was supported by its ability to generate high-intensity light for a short duration while closely replicating natural sunlight under controlled testing conditions. Pulse simulators are widely used for photovoltaic cell and module testing because they enable fast, repeatable, and accurate performance measurements without causing excessive heating of the test sample. Their suitability for laboratory research, manufacturing quality control, and certification activities has made them the preferred choice across the solar industry.
Flash Simulator is expected to be the fastest-growing segment during the forecast period due to increasing demand for rapid testing solutions in high-volume solar module production. These systems are gaining wider acceptance because they provide quick measurement cycles, improve production efficiency, and support automated testing environments. Their ability to deliver reliable and repeatable results while reducing inspection time makes them suitable for modern manufacturing facilities and research laboratories.
By Light Source
Light Emitting Diodes (LED) lead with 34.34% share due to their energy efficiency and stable light output.
In 2025, Light Emitting Diodes (LED) held a dominant market position, capturing more than a 34.34% share in the Global Solar Simulator Market. Their leading position was driven by their ability to provide stable, uniform, and highly controllable light output for solar testing applications. LED-based solar simulators are widely used in photovoltaic research, product development, and quality testing because they offer long operational life, low heat generation, and reduced energy consumption compared with conventional light sources.
Xenon Arc Lamps are expected to be the fastest-growing light source segment during the forecast period due to their ability to closely replicate the full solar spectrum required for advanced photovoltaic testing. These lamps are increasingly used in applications where high irradiance and excellent spectral matching are essential for accurate performance evaluation. Their suitability for testing high-efficiency solar cells, modules, and new photovoltaic materials has increased their adoption in research institutions and industrial testing facilities.
By Application
Solar Cell Testing and Research leads with 46.78% share as demand for accurate photovoltaic performance testing continues to rise.
In 2025, Solar Cell Testing and Research held a dominant market position, capturing more than a 46.78% share in the Global Solar Simulator Market. Its leading position was supported by the growing need for accurate and repeatable testing of photovoltaic cells and solar modules during research, product development, and manufacturing. Solar simulators are widely used to reproduce controlled sunlight conditions, allowing researchers and manufacturers to evaluate efficiency, durability, and overall performance before commercial deployment. They play a vital role in quality assurance, certification, and technology development by providing consistent testing environments that help improve the reliability of solar products.
Medical Research is expected to be the fastest-growing application segment during the forecast period as the use of controlled light sources expands across healthcare and life science research. Solar simulators are increasingly used to study the effects of ultraviolet and visible light on biological materials, skin responses, medical devices, and phototherapy-related applications. Their ability to deliver stable and reproducible illumination makes them suitable for laboratory experiments requiring precise light exposure.
Key Market Segments
By Type
- Pulse Simulator
- Flash Simulator
- Continuous Simulator
By Light Source
- Quartz Tungsten Halogen Lamps (QHT)
- Metal Halide Arc Lamps (HMI)
- Light Emitting Diodes (LED)
- Xenon Arc Lamps
- Others
By Application
- Medical Research
- Solar Cell Testing and Research
- Artificial Environment Testing
- Others
Driver Analysis
PV manufacturing scale-up lifts simulator capex demand
The first-order demand driver is sheer PV volume expansion, because every added cell, module, and pilot-line increment enlarges the installed base of characterization, calibration, and production QA equipment that relies on solar simulators. Global PV installations reached roughly 554–602 GW in 2024, cumulative PV capacity exceeded 2.2 TW, global module production reached 726 GW, and module manufacturing capacity expanded to about 1,405 GW/year, while cell manufacturing capacity reached about 1,427 GW/year; this means the industry is operating with an enormous and still geographically uneven test burden across R&D labs, factory acceptance stations, inline QA, and certification workflows.
The growth signal extended into 2025, with the IEA reporting about 605 GW of new PV capacity added in 2025 and solar contributing around 600 TWh of additional generation, reinforcing continued investment across upstream and downstream solar assets that indirectly pull simulator demand.
Drivers Impact Analysis
| Driver | (~) % Impact on CAGR | Geographic Relevance | Impact Timeline |
|---|---|---|---|
| PV manufacturing scale-up lifts simulator capex demand | +2.4% | China core, India, U.S., EU, Southeast Asia spill-over | Short term |
| Shift to tandem, TOPCon, HJT raises test-complexity spend | +2.1% | U.S. R&D core, EU labs, China cell lines, Japan, Korea | Medium term |
| IEC/ASTM accuracy tightening accelerates AAA-class replacement | +1.7% | North America core, EU, China, India export corridors | Short term |
| LED-based platforms expand addressable use cases beyond flash IV | +1.5% | EU, U.S., China, Japan, Korea | Medium term |
| Regional localization and trade-policy friction create duplicate test nodes | +1.3% | U.S., India, EU, Brazil, ASEAN spill-over | Medium term |
| Emerging perovskite and reliability qualification workflows broaden end-use demand | +1.9% | U.S. innovation hubs, EU pilot lines, China, Middle East R&D | Long term |
Restraint Analysis
Calibration and standards complexity
Calibration complexity and evolving standards create an ongoing drag on effective market expansion because they translate into hidden lifecycle costs, downtime risk, and confidence gaps that slow procurement decisions. IEC 60904-9 and related ASTM methods define tight tolerances across spectral match, spatial non-uniformity, and temporal instability, but adherence in practice demands periodic recalibration cycles that many labs find burdensome, with technical notes and industry reports referencing 6–12 month recalibration windows for high-precision AAA systems, and intermediate checks whenever lamps or key optics are replaced.
Continuous standard evolution further complicates the picture, with updates to IEC and national norms expanding requirements for multi-junction, perovskite, and tandem testing, which forces owners to weigh incremental upgrade capex and calibration risk against the benefit of staying technically current; in practice, many users delay upgrades until compliance deadlines or customer pressure become unavoidable, effectively flattening demand in earlier years and subtracting roughly 1–2 percentage points from an unconstrained CAGR trajectory.
Restraint Impact Analysis
| Restraint | (~) % Impact on CAGR | Geographic Relevance | Impact Timeline |
|---|---|---|---|
| High capex and OPEX burdens | -2.3% | APAC core, EU, North America, emerging labs | Medium term |
| Calibration and standards complexity | -1.9% | North America core, EU, China, India | Medium term |
| Skilled-metrology talent shortage | -1.6% | Global, acute in India, ASEAN, LatAm | Long term |
| Xenon and specialty component supply risk | -1.4% | APAC corridors, EU importers, U.S. labs | Short term |
| Competition from used/rental systems | -1.2% | North America, EU, India academia, small OEMs | Medium term |
| Budget constraints in emerging markets | -1.8% | India tier-2, Africa, LatAm, ASEAN | Long term |
Opportunity Analysis
SaaS metrology and remote calibration layers
With global simulator fleets numbering in the thousands of units and a meaningful share plausibly 30–40% operated by users who lack deep metrology expertise, the potential to charge recurring fees for remote calibration guidance, automated IEC/ASTM compliance checks, spectral recipe libraries, and anomaly detection is substantial: even modest SaaS pricing in the range of 5–10% of annualized hardware value could convert to high-margin, mid-single-digit percentage contributions to vendor top line, given incremental gross margins above 60–70% on software compared to 30–40% on hardware.
Strategically, this is upside rather than a baseline driver because most OEMs still package only basic control software with their systems, and very few have fully fledged cloud platforms tied into fleets for telemetry, benchmarking, and calibration scheduling; moving fast over the next 1–2 years to standardize APIs, launch tiered SaaS offerings, and integrate remote spectral tuning could reduce customer total cost of ownership by 10–20%, cut calibration downtime by several days per year, and lower perceived entry barriers, which in turn supports additional hardware sales and stickier relationships—together offering around 2 percentage points of incremental CAGR upside beyond current projections.
Opportunity Impact Analysis
| Opportunity | (~) % Potential CAGR | Geographic Relevance | Execution Window |
|---|---|---|---|
| Continuous-spectrum platforms for reliability and aging | +2.3% | North America, EU, Japan, Korea | Medium term |
| SaaS metrology and remote calibration layers | +2.0% | Global, esp. APAC and EU | Short term |
| Expansion into non-PV illumination verticals | +1.8% | North America core, EU, China | Medium term |
| Agrivoltaics and BIPV-specialized simulators | +1.6% | EU, India, Middle East, Latin America | Long term |
| M&A roll-ups of fragmented regional OEMs | +1.9% | APAC corridors, EU mid-tier, U.S. niche suppliers | Medium term |
| Low-cost modular systems for emerging markets | +2.1% | India, ASEAN, Africa, LatAm | Long term |
Challenges Analysis
Rapid tech obsolescence risk
Rapid technology obsolescence is a persistent challenge because solar simulators are capital assets with 7–10 year technical lifecycles, yet PV architectures and metrology expectations are now changing on 2–4 year cycles, creating continuous friction as buyers struggle to align purchase timing with moving performance baselines.
Vendors introduce new LED wavelengths, hybrid LED/xenon designs, fiber-output systems, and continuous simulators that outclass previous generations in uniformity and stability, effectively forcing customers to either accept higher measurement uncertainty or commit to mid-life upgrades that can consume 20–40% of the original system capex over a 3–5 year horizon, and those upgrade decisions are delayed or staggered because engineering teams must validate new configurations and re-qualify processes.
Strategically, this challenge does not freeze sales but it reduces the market’s maximum attainable growth rate by making procurement committees discount net-present value and raising the perceived risk of stranded assets; across APAC gigafabs, EU labs, and North American R&D centers, the net effect is a friction drag in the order of 1–1.5 percentage points on potential CAGR, as buyers adopt more conservative replacement cycles and allocate incremental budget to flexible or modular designs rather than high-risk, highly specialized platforms.
Challenges Impact Analysis
| Challenge | (~) % CAGR Friction | Geographic Relevance | Mitigation Horizon |
|---|---|---|---|
| Rapid tech obsolescence risk | -1.4% | APAC fabs, EU labs, North America R&D | Medium term |
| Complex multi-node supply chains | -1.2% | APAC logistics corridors, EU import hubs, U.S. ports | Medium term |
| Optical and spectral stability limits | -1.1% | Global AAA-class users | Long term |
| Persistent skilled optical talent gap | -1.3% | Europe, APAC emerging, North America niche firms | Long term |
| Volatile upstream PV cost cycles | -1.0% | Global, concentrated in China-led chains | Short term |
| Fragmented standards and qualification burden | -0.9% | EU regulatory hubs, North America, APAC exporters | Long term |
Geopolitical Impact Analysis
Middle East conflict increases LNG supply risks, driving stronger demand for reliable BOG compressor systems.
The recent conflict in the Middle East has increased global attention on energy security, encouraging governments and industries to expand renewable energy investments, including solar power. This trend is creating stronger demand for solar simulators used in photovoltaic testing, certification, and research.
- According to the International Energy Agency (IEA), global renewable capacity additions reached 800 GW in 2025, up 16% from the previous year, while solar PV additions surpassed 600 GW for the first time. The IEA also reported that solar PV accounted for more than three-quarters of new renewable capacity additions in 2025.
At the same time, geopolitical uncertainty has exposed supply chain risks for testing equipment because China continues to dominate photovoltaic manufacturing. The IEA states that China holds more than 80% of global manufacturing capacity across key solar PV production stages, making equipment and component supply vulnerable to trade restrictions and logistics disruptions. Despite these challenges, many countries are increasing domestic solar manufacturing and research investments to reduce import dependence and strengthen energy resilience.
Regional Analysis
Regional Analysis: Solar Simulator Market – Asia-Pacific.
Asia-Pacific is the dominant region in the solar simulator market, holding a 34.67% share valued at USD 114.4 billion. This leadership is driven by the region’s large photovoltaic (PV) manufacturing base and extensive testing activities across China, Japan, South Korea, and Australia. The strong concentration of solar cell and module production creates continuous demand for indoor solar simulators used for product validation, quality control, and certification.
- According to the U.S. Energy Information Administration (EIA), citing China’s National Energy Administration (NEA), China’s utility-scale solar power capacity exceeded 880 GW in 2024, compared with 121 GW in the United States, highlighting China’s position as the world’s largest utility-scale solar market.
The region’s leadership is further reinforced by continued solar deployment and manufacturing expansion. According to the International Energy Agency (IEA), China commissioned nearly 370 GW of solar PV capacity in 2025, representing more than 60% of global renewable capacity growth during the year. In Australia, the Clean Energy Regulator reported 3 GW of large-scale solar project approvals in 2025, along with 2.8 GW of small-scale rooftop solar installations.
Key Regions and Countries
- North America
- The US
- Canada
- Europe
- Germany
- France
- The UK
- Spain
- Italy
- Russia & CIS
- Rest of Europe
- APAC
- China
- Japan
- South Korea
- India
- ASEAN
- Rest of APAC
- Latin America
- Brazil
- Mexico
- Rest of Latin America
- Middle East & Africa
- GCC
- South Africa
- Rest of MEA
Key Players Analysis
Solar simulator manufacturers focus on improving light accuracy, spectral stability, and testing precision to remain competitive in the market. A major priority is the development of advanced LED, xenon arc, and hybrid light source technologies that closely replicate natural sunlight while reducing energy consumption and maintenance requirements. Companies continue to invest in optical system improvements, irradiation uniformity, and digital control software to deliver reliable and repeatable testing results for photovoltaic cells, modules, and research applications.
Leading companies including ABET Technologies, Asahi Spectra, Iwasaki Electric, Meyer Burger Technology, Newport Corporation, Gsolar Power, OAI, Nisshinbo, Sciencetech, and Endeas Oy, along with other key players, continue to strengthen their market presence through product innovation, engineering expertise, and global distribution networks. Many manufacturers are expanding research and development activities to introduce higher-performance solar simulators suitable for advanced photovoltaic testing and laboratory applications.
The Major Players in The Industry
- ABET Technologies
- Asahi Spectra
- Iwasaki Electric
- Meyer Burger Technology
- Newport Corporation
- Gsolar Power
- OAI
- Nisshinbo
- Sciencetech
- Endeas Oy
- Other Key Players
Key Development
- In April 2025, Endeas Oy announced its participation in three Horizon Europe research and development projects advancing next-generation photovoltaics. The company leads the DICE project alongside partners including Fluxim AG, Zürich University of Applied Sciences, École Polytechnique Fédérale de Lausanne, Tampere University, and Åbo Akademi University, and is also involved in the SPOT-IT and MENTOR projects covering indoor tandem solar cell characterization and doctoral secondments in indoor photovoltaics.
- In May 2025, MKS Inc. announced the Newport Solaris series Class A+AA Solar Simulators, featuring a xenon arc lamp, output beams up to 12×12 inches, and certification to the latest IEC 60904-9:2020 standard. The series targets photovoltaic applications including solar cell and panel manufacturing and emerging PV technologies such as organic and perovskite-based tandem/multijunction cells.
Report Scope
| Report Features | Description |
|---|---|
| Market Value (2025) | USD 329.8 Mn |
| Forecast Revenue (2035) | USD 613.4 Mn |
| CAGR (2026 2035) | 6.4% |
| Base Year for Estimation | 2025 |
| Historic Period | 2020-2024 |
| Forecast Period | 2026-2035 |
| Report Coverage | Revenue Forecast, Market Dynamics, Competitive Landscape, Recent Developments |
| Segments Covered | By Type (Pulse Simulator, Flash Simulator, Continuous Simulator), By Light Source (Quartz Tungsten Halogen Lamps (QHT), Metal Halide Arc Lamps (HMI), Light Emitting Diodes (LED), Xenon Arc Lamps, Others), By Application (Medical Research, Solar Cell Testing and Research, Artificial Environment Testing, Others) |
| Regional Analysis | North America The US & Canada; Europe Germany, France, The UK, Spain, Italy, Russia & CIS, Rest of Europe; APAC China, Japan, South Korea, India, ASEAN & Rest of APAC; Latin America Brazil, Mexico & Rest of Latin America; Middle East & Africa GCC, South Africa, & Rest of MEA |
| Competitive Landscape | ABET Technologies, Asahi Spectra, Iwasaki Electric, Meyer Burger Technology, Newport Corporation, Gsolar Power, OAI, Nisshinbo, Sciencetech, Endeas Oy, and other key players. |
| Customization Scope | Customization for segments, region/country level will be provided. Moreover, additional customization can be done based on the requirements. |
| Purchase Options | We have three licenses to opt for: Single User License, Multi User License (Up to 5 Users), Corporate Use License (Unlimited Users and Printable PDF) |





































