


Report Overview
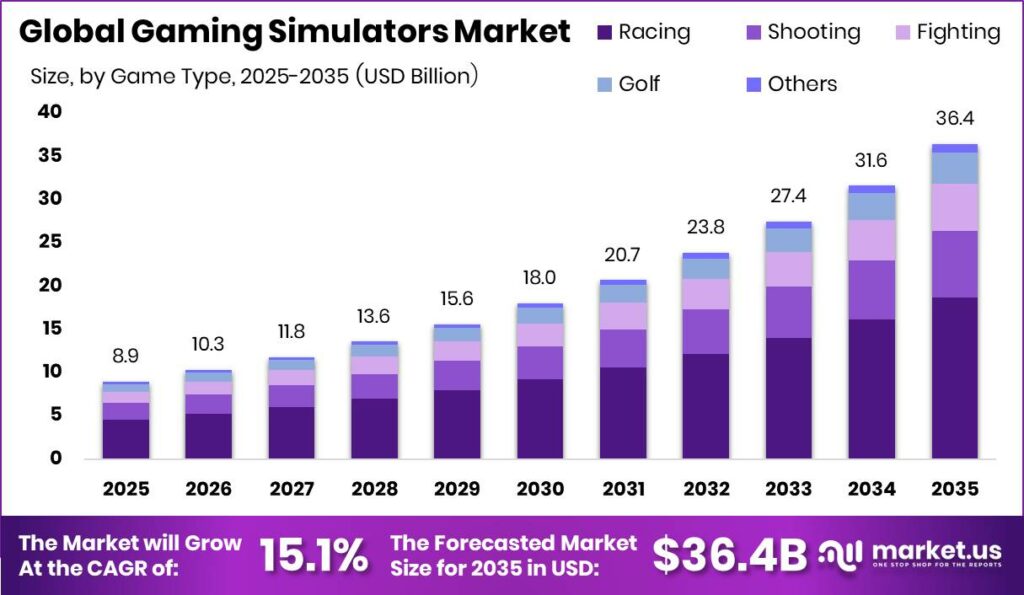
Global Gaming Simulators Market size is expected to be worth around USD 36.40 Billion by 2035 from USD 8.90 Billion in 2025, growing at a CAGR of 15.1% during the forecast period 2026 to 2035. This trajectory reflects a market shifting from niche hobbyist gear toward mainstream competitive and training infrastructure. Vendors positioning early across hardware and immersive platforms will capture disproportionate share as adoption scales.
Gaming simulators recreate real-world driving, flying, shooting, and sports experiences through dedicated hardware and software. The market structures around game type, component, product type, and target user. Hardware forms the physical layer of cockpits, motion platforms, and displays, while software delivers the simulated environments. This layered structure lets buyers assemble systems by budget and use case, which widens the addressable base across consumer and enterprise channels.
Key Takeaways
- Global Gaming Simulators Market will reach USD 36.40 Billion by 2035, up from USD 8.90 Billion in 2025 at a 15.1% CAGR.
- Racing led the By Game Type segment with a 51.2% share, while Shooting ranks as the fastest growing type.
- Hardware dominated the By Component segment with a 71.4% share and also grew fastest.
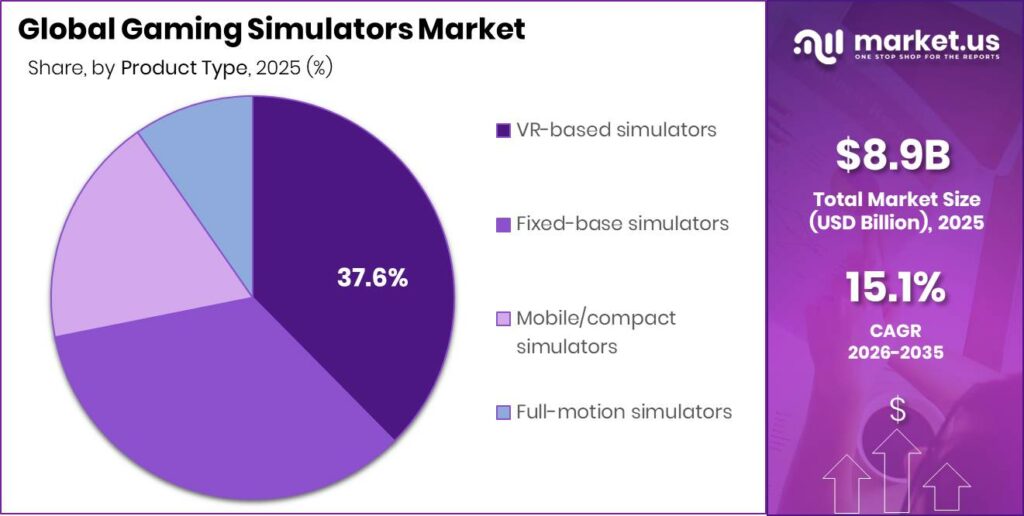
- VR-based simulators led the By Product Type segment with a 37.6% share and the fastest growth.
- Casual Gamers held the largest By Target User share at 35.1%, while Serious/Enthusiast Gamers grew fastest.
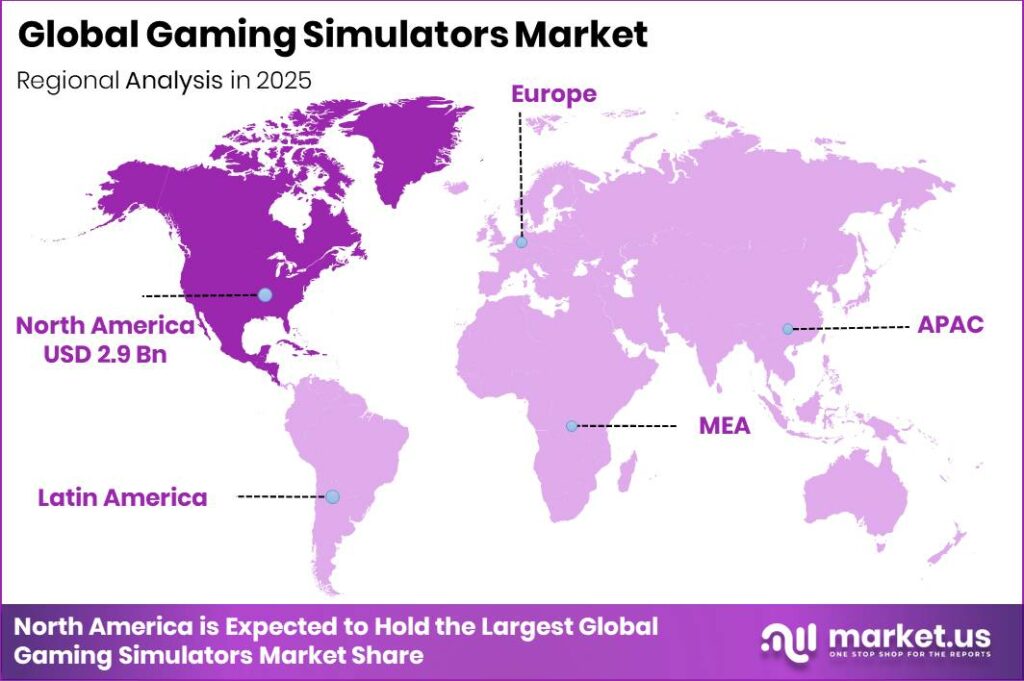
- North America dominated with a 32.5% regional share, valued at USD 2.9 Billion.
Government-backed training programs increasingly rely on simulators to cut cost and risk. Flight and aviation training simulators operate at roughly 50 to 75 dollars per hour versus 150 to 200 dollars per hour for real aircraft. This gap delivers 60% to 70% hourly savings, which pushes public agencies and academies to expand simulator fleets and creates steady enterprise demand for suppliers.
As per our research, Steam reached 147 million monthly active users and 69 million daily active users in 2025, up 10% year on year. This distribution scale gives simulator software publishers direct access to a growing paying audience. Companies that ship simulator titles on Steam shorten their path to revenue and reduce reliance on retail hardware bundles.
In October 2025, iRacing Studios launched NASCAR 25, its first officially licensed NASCAR simulation title under a new publishing label. This signals that established sim platforms are securing premium licenses to lock in fans. As a result, hardware makers gain a reason to bundle branded racing rigs, tying peripheral demand directly to marquee software releases.
Game Type Analysis
Racing dominates with 51.2% due to strong sim-racing hardware ecosystems.
In 2025, Racing held a dominant market position in the By Game Type segment of Gaming Simulators Market, with a 51.2% share. BeamNG.drive averaged 16,333 concurrent players with a monthly peak of 28,771 on Steam in February 2025, leading all racing and simulation titles. This concurrency confirms deep player commitment. Hardware vendors should prioritize racing peripherals, since active player bases convert directly into wheel and pedal sales.
Shooting simulators rank as the fastest growing game type, driven by competitive first-person titles that reward ultra-low latency. NVIDIA Reflex 2 in Valorant achieves PC latency averaging under 3 milliseconds, the lowest ever measured in a first-person shooter. This precision attracts esports players to dedicated setups. Vendors targeting shooting formats can win share by marketing latency performance as a competitive advantage rather than a spec.
Fighting and Golf simulators serve focused audiences built around physical fidelity and social play. Golf simulators depend on accurate ball-tracking sensors, while fighting formats reward responsive input hardware. These categories rely on repeat venue visits rather than mass consumer sales. Operators can stabilize revenue by placing these units in entertainment centers, where per-session pricing offsets lower installed volume.
Others cover flight and specialized simulators that anchor training use cases. Flight and aviation simulators run at roughly 50 to 75 dollars per hour against 150 to 200 dollars for real aircraft. This cost gap sustains institutional demand. Together, Fighting, Golf, and Others hold the remaining share collectively, giving suppliers durable niche revenue beyond the racing core.
Component Analysis
Hardware dominates with 71.4% due to costly rigs, motion platforms, displays.
In 2025, Hardware held a dominant market position in the By Component segment of Gaming Simulators Market, with a 71.4% share. Sim racing setups run from about 380 dollars entry level to over 25,000 dollars for professional full-motion rigs. This wide price ladder captures buyers at every budget. Manufacturers that offer tiered hardware lines can upsell hobbyists into premium rigs over time, expanding lifetime customer value.
Hardware also grows fastest because immersive performance depends on physical capability. High-quality VR simulator performance now requires 16 GB VRAM as the effective minimum, with 24 to 32 GB ideal for ultra-high-resolution headsets. These rising specs force regular upgrades. Component suppliers benefit from a replacement cycle, since players must refresh GPUs and displays to keep pace with demanding sim platforms.
Software provides the simulated worlds, physics engines, and licensed content that make hardware useful. Over 100 games have integrated NVIDIA Reflex, with over 90% of eligible players enabling it. This adoption shows software features drive real player behavior. Publishers that embed performance-enhancing technology gain retention leverage, turning software into a recurring engagement driver rather than a one-time purchase.
Product Type Analysis
VR-based simulators dominate with 37.6% due to deep immersive presence.
In 2025, VR-based simulators held a dominant market position in the By Product Type segment of Gaming Simulators Market, with a 37.6% share. The industry-accepted motion-to-photon latency threshold for VR sits under 20 milliseconds, while latencies above 60 milliseconds cause discomfort. This tight tolerance sets a clear engineering bar. Vendors that consistently hit sub-20-millisecond performance will differentiate their headsets and protect premium pricing.
Fixed-base simulators offer stable, lower-cost entry points for venues and homes without motion actuators. VR simulators need a minimum 90 hertz refresh rate and latency below 20 milliseconds to prevent sickness, a bar fixed-base VR rigs can meet affordably. This reliability appeals to first-time buyers. Operators can deploy fixed-base units at scale, lowering the risk of returns tied to motion discomfort.
Mobile and compact simulators target space-constrained buyers who need portable setups. Sim racing sweet-spot displays run 120 to 165 hertz, with 240 hertz delivering four times the visual updates of a 60 hertz panel. Compact rigs can adopt these panels without large footprints. This lets urban households buy capable systems, widening the consumer base beyond dedicated game rooms.
Full-motion simulators deliver the highest fidelity through multi-axis movement for elite training and enthusiasts. A peer-reviewed study found 120 FPS significantly reduced simulator sickness versus 60 or 90 FPS. High frame rates make intense motion tolerable. Fixed-base, Mobile/compact, and Full-motion simulators hold the remaining share collectively, giving vendors a full ladder from budget to flagship systems.
Target User Analysis
Casual Gamers dominate with 35.1% due to broad accessible entry-level demand.
In 2025, Casual Gamers held a dominant market position in the By Target User segment of Gaming Simulators Market, with a 35.1% share. Entry-level sim racing rigs start near 380 dollars, placing simulators within reach of mainstream buyers. This low barrier explains the large casual base. Vendors that lead with affordable starter kits capture volume first, then guide these users toward higher-margin upgrades.
Serious and Enthusiast Gamers rank as the fastest growing user group, chasing peak realism and competitive edge. VR buying guides for 2026 specify a controller latency target of 22 milliseconds or less, since above 35 milliseconds users report disorientation. Enthusiasts pay for this precision. Suppliers can command premium prices by meeting exacting latency specs that casual buyers rarely demand.
Professional Gamers and Enterprise or Institutional Users anchor the high-fidelity, high-utilization end of the market. Enterprise buyers favor training simulators, where flight programs save 40% to 60% in overall cost versus aircraft. This economic logic sustains institutional orders. Professional Gamers and Enterprise/Institutional Users hold the remaining share collectively, giving vendors stable, contract-driven revenue alongside consumer sales.
Key Market Segments
By Game Type
- Shooting
- Fighting
- Racing
- Golf
- Others
By Component
- Hardware
- Software
By Product Type
- VR-based simulators
- Fixed-base simulators
- Mobile/compact simulators
- Full-motion simulators
By Target User
- Enterprise / Institutional Users
- Professional Gamers
- Casual Gamers
- Serious / Enthusiast Gamers
Regional Analysis
North America Dominates the Gaming Simulators Market with a Market Share of 32.5%, Valued at USD 2.9 Billion
North America led the Gaming Simulators Market in 2025 with a 32.5% share worth USD 2.9 Billion. Strong esports leagues, high disposable income, and mature distribution support this lead. In October 2025, iRacing Studios launched NASCAR 25, its first officially licensed NASCAR simulation title. This licensing deal deepens regional engagement. Hardware vendors gain a channel to bundle branded rigs with marquee North American motorsport titles.
Asia Pacific ranks as the fastest growing region, propelled by rising disposable income and premium gaming hardware demand. Expanding middle-class spending pushes buyers toward advanced simulator setups. This shift widens the regional customer base beyond early adopters. Suppliers that localize pricing and content for Asia Pacific can capture first-mover share before global competitors scale their presence in these fast-expanding markets.
Key Regions and Countries
North America
- US
- Canada
Europe
- Germany
- France
- The UK
- Spain
- Italy
- Rest of Europe
Asia Pacific
- China
- Japan
- South Korea
- India
- Australia
- Rest of APAC
Latin America
- Brazil
- Mexico
- Rest of Latin America
Middle East and Africa
- GCC
- South Africa
- Rest of MEA
Market Dynamics
Market Opportunity Analysis - Underserved user tiers and lagging regions offer clear entry points for new players
Serious and Enthusiast Gamers rank as the fastest growing target user group, yet Casual Gamers still hold the largest 35.1% share. This means enthusiast demand outpaces current supply focus. New entrants can build premium rigs tuned to strict latency and refresh needs. By serving this rising tier directly, challengers capture high-margin buyers before mass-market vendors reposition their lineups.
Asia Pacific ranks as the fastest growing region, while North America still leads with a 32.5% share worth USD 2.89 Billion. This gap signals an underexploited growth frontier. Vendors that establish local distribution and pricing in Asia Pacific gain early ground. Instead of defending saturated North American demand, new players should chase the faster regional expansion curve.
Shooting simulators grow fastest within the By Game Type segment, yet Racing dominates with a 51.2% share. This concentration leaves shooting formats under-served by hardware makers focused on wheels and pedals. New entrants can design rigs and peripherals built for competitive shooters. By contrast with crowded racing gear, this niche offers open space to define a category and set pricing.
Full-motion simulators sit below VR-based systems, which lead the By Product Type segment with a 37.6% share. High cost keeps full-motion adoption limited despite superior fidelity. This creates room for leasing or shared-venue models that spread expense. Investors backing accessible full-motion access can convert priced-out enthusiasts into paying users, unlocking a segment that remains structurally underexploited today.
Technology and Innovation Landscape - Latency reduction, high refresh rates, and VR fidelity redefine competitive edges
NVIDIA Reflex 2 reduces total PC gaming input latency by up to 75%, cutting it from 56 milliseconds to 14 milliseconds, announced at CES 2025. This leap sets a new performance benchmark for competitive simulators. Manufacturers that adopt Reflex-ready hardware can market measurable responsiveness gains, turning latency reduction into a concrete selling point for serious buyers.
Refresh-rate advances reshape display buying for sim racing, where 120 to 165 hertz forms the value sweet spot and 240 hertz delivers four times the visual updates of a 60 hertz panel. This range guides component sourcing. Vendors that bundle high-refresh displays with rigs justify premium pricing, since buyers directly perceive smoother motion during fast racing sessions.
VR fidelity now hinges on strict thresholds, with a minimum 90 hertz refresh and latency below 20 milliseconds required to prevent simulator sickness. GPU demands rose in step, with 16 GB VRAM as the effective minimum for high-quality VR. This raises the hardware bar. Component suppliers benefit as buyers upgrade GPUs and headsets to meet comfort and immersion standards.
Frame-rate research reinforces the performance race, with a peer-reviewed study finding 120 FPS significantly reduces simulator sickness versus 60 or 90 FPS. This gives makers a clear engineering target. Companies that guarantee stable 120 FPS across VR titles reduce user discomfort, improving session length and strengthening their case against lower-spec competitors.
Drivers
Between 2024 and 2026, motorsport simulator venues and professional racing rigs moved from niche entertainment to core esports infrastructure, with one venue segment projecting growth from roughly 1.25 Billion equivalent value in 2025 to 1.41 Billion in 2026. Organized competition lifted average utilization per installed racing simulator from about 15 to 20 hours weekly in 2023 to more than 30 to 35 hours by 2025. This raises revenue per unit.
Higher utilization also increased peripheral attach rates for cockpits, motion platforms, and high-refresh displays by an estimated 25% to 35%, improving venue-level margins. Rising ticket and sponsorship revenue per event compounds this effect. As a result, organized-competition adoption contributes an incremental 3.0% to the 15.1% baseline CAGR. Investors backing venue operators gain a clear path to faster payback through denser scheduling.
| Driver | (~) % Impact on CAGR Forecast | Geographic Relevance | Impact Timeline |
|---|---|---|---|
| Esports and competitive racing simulator adoption | +3.0% | North America, Europe, Asia Pacific | Short term (≤ 2 years) |
| VR and motion platform technology integration | +2.5% | Global | Short term (≤ 2 years) |
| Operator and driver training simulator deployment | +2.1% | Global industrial and automotive | Medium term (2–4 years) |
| At-home sim-racing and flight-sim engagement growth | +1.8% | North America, Europe | Short term (≤ 2 years) |
| Disposable income-driven premium gaming hardware demand | +1.2% | Asia Pacific, Middle East | Medium term (2–4 years) |
Restraints
Professional-grade simulators with motion platforms, high-end VR, and direct-drive controls can cost between 20,000 and 80,000 dollars per station, while full venues need 8 to 20 stations plus ancillary equipment. This pushes initial capital for a mid-sized facility into the low multimillion-dollar range. High upfront cost blocks smaller operators. Consequently, many delay new builds or settle for lower-spec rigs that limit revenue potential.
Commercial lending rates stayed elevated through 2025, with equipment financing costs in the 6% to 9% band. Payback periods stretched from around 3 years to closer to 5 years under realistic utilization. This capital-intensity bottleneck delays projects and subtracts an estimated 2.6% from the 15.1% baseline CAGR. Vendors offering financing or leasing can unlock buyers who otherwise stall on cost.
| Restraint | (~) % Impact on CAGR Forecast | Geographic Relevance | Impact Timeline |
|---|---|---|---|
| High upfront hardware and motion-platform CapEx | -2.6% | Global | Short term (≤ 2 years) |
| Limited floor-space availability in urban venues | -1.5% | North America, Europe | Short term (≤ 2 years) |
| Safety and liability concerns for public simulator operations | -1.1% | Global | Medium term (2–4 years) |
Challenges
By late 2025, sim-racing and flight communities agreed no available VR headset met all high-end criteria, with benchmarks specifying per-eye resolution above roughly 2,500 pixels, wired latency under about 15 milliseconds, and refresh of at least 120 hertz. Most headsets force trade-offs between resolution, refresh, and latency. This gap frustrates serious users and slows full-immersion adoption across premium venues.
A nontrivial minority of users experience motion sickness or visual fatigue after 20 to 40 minutes, which caps average VR sessions below 60 minutes in many venues. This limitation adds operational cost through alternative displays and frequent upgrades. It also trims the market’s maximum growth by an estimated 1.8% against the 15.1% baseline. Operators that offer non-VR options protect throughput and revenue.
| Challenge | (~) % CAGR Friction Drag | Geographic Relevance | Mitigation Horizon |
|---|---|---|---|
| VR hardware comfort and performance limitations | -1.8% | Global | Medium term (2–4 years) |
| Fragmented simulator content and licensing ecosystems | -1.4% | North America, Europe | Medium term (2–4 years) |
| Shortage of experienced simulator technicians | -1.0% | Global | Long term (≥ 4 years) |
| Network latency and bandwidth constraints for multi-user sessions | -0.9% | Global | Medium term (2–4 years) |
Opportunities
Integrated centers combining industrial training simulators with public gaming rigs remain underdeveloped, even though operator-training markets surpassed roughly 14.1 Billion equivalent value by 2025 with mid-single-digit growth. Reusing motion and visualization platforms across daytime training and evening entertainment could lift daily utilization from a typical 4 to 6 hours to 10 to 12 hours. This roughly doubles revenue time without doubling hardware cost.
Hybrid centers spread fixed costs such as maintenance and technician staffing across multiple revenue lines. This cross-sector reuse could expand facility margins by an estimated 5% to 8% and convert siloed demand into a shared, untapped market portion. Therefore, this model supports an incremental 2.3% CAGR upside above the 15.1% baseline. Early movers can lock in dual-market venues before competitors adapt.
| Opportunity | (~) % Potential CAGR Upside | Geographic Relevance | Execution Window |
|---|---|---|---|
| Integrated training-and-entertainment hybrid simulator centers | +2.3% | Global | Medium term (2–4 years) |
| Emerging-market rollout of standardized e-motorsport hubs | +1.9% | Asia Pacific, Middle East, Latin America | Long term (≥ 4 years) |
| Subscription-based home simulator hardware leasing | +1.5% | North America, Europe | Medium term (2–4 years) |
| Cross-industry simulator platform reuse (industrial plus gaming) | +1.2% | Global | Long term (≥ 4 years) |
Key Company Insights
Sony Corporation holds a structural advantage through its console platform, first-party studios, and hardware manufacturing scale. This ecosystem lets Sony integrate simulator titles with proprietary controllers and displays, locking players into its environment. Its brand strength also secures shelf space and licensing deals. However, its console-centric focus leaves a gap in high-end PC and full-motion rig segments where specialist vendors compete on raw fidelity.
Villers Enterprises Limited competes as a focused simulator specialist rather than a broad platform holder. This concentration lets the company tailor rigs and support to demanding sim-racing and training buyers who value precision over ecosystem breadth. Its niche positioning builds loyalty among enthusiasts and institutions. However, its narrower scale limits distribution reach, leaving it exposed if larger platform holders expand aggressively into dedicated simulator hardware.
Key Players
- Sony Corporation
- Villers Enterprises Limited
- Vesaro
- AEON RETAIL CO., LTD.
- RSEAT Ltd
- Playseat
- Lean Games
- Hammacher Schlemmer & Company, Inc.
- GTR Simulators
- Eleetus LLC
- CXC Simulations
- CKAS Mechatronics Pty Ltd
- Atomic Motion Systems
- Alelo INC.
- Aero Simulation
- 3D Perception
Recent Developments
- December 2025: ReStory Studio unveiled ReStory, an electronics repair simulator featuring realistic repair mechanics and sandbox gameplay, ahead of its planned 2026 release.
- February 2026: JetSynthesys acquired EverMerge from Big Fish Games, expanding its portfolio with an established simulation and puzzle title.
- May 2026: Alpha Compute Corp. completed its majority acquisition of GAMEE, adding a platform with over 120 million registered users to its interactive gaming ecosystem.
Geopolitical Impact Analysis
According to the World Bank, elevated shipping costs and rerouting around chokepoints raised container freight rates sharply in 2024, with some routes climbing over 150% above prior-year levels. Gaming simulators depend on Asia-sourced GPUs, motion actuators, and display panels. This means longer transit and higher landed costs for rigs. As a result, venue operators face compressed margins and delayed hardware refresh cycles.
Based on WTO data, global merchandise trade tensions and expanded tariff measures in 2025 pushed average applied duties on certain electronics components higher, with some lines facing rates above 25%. Simulator makers rely on cross-border flows of semiconductors and precision hardware. This raises production cost per station. Consequently, vendors are diversifying suppliers and reshoring assembly to protect pricing and delivery reliability.
Report Scope
| Report Features | Description |
|---|---|
| Market Value (2025) | USD 8.90 Billion |
| Forecast Revenue (2035) | USD 36.40 Billion |
| CAGR (2026-2035) | 15.1% |
| Base Year for Estimation | 2025 |
| Historic Period | 2020-2024 |
| Forecast Period | 2026-2035 |
| Report Coverage | Revenue Forecast, Market Dynamics, Market Opportunity Analysis, Technology and Innovation Landscape, Competitive Landscape, Recent Developments |
| Segments Covered | By Game Type (Shooting, Fighting, Racing, Golf, Others), By Component (Hardware, Software), By Product Type (VR-based simulators, Fixed-base simulators, Mobile/compact simulators, Full-motion simulators), By Target User (Enterprise / Institutional Users, Professional Gamers, Casual Gamers, Serious / Enthusiast Gamers) |
| Regional Analysis | North America (US and Canada), Europe (Germany, France, The UK, Spain, Italy, and Rest of Europe), Asia Pacific (China, Japan, South Korea, India, Australia, and Rest of APAC), Latin America (Brazil, Mexico, and Rest of Latin America), Middle East and Africa (GCC, South Africa, and Rest of MEA) |
| Competitive Landscape | Sony Corporation, Villers Enterprises Limited, Vesaro, AEON RETAIL CO., LTD., RSEAT Ltd, Playseat, Lean Games, Hammacher Schlemmer & Company, Inc., GTR Simulators, Eleetus LLC, CXC Simulations, CKAS Mechatronics Pty Ltd, Atomic Motion Systems, Alelo INC., Aero Simulation, 3D Perception |
| Customization Scope | Customization for segments, region / country-level will be provided. Additional customization can be done based on requirements. |
| Purchase Options | We have three licenses to opt for: Single User License | Multi-User License (Up to 5 Users) | Corporate Use License (Unlimited User and Printable PDF) |





































