


Report Overview
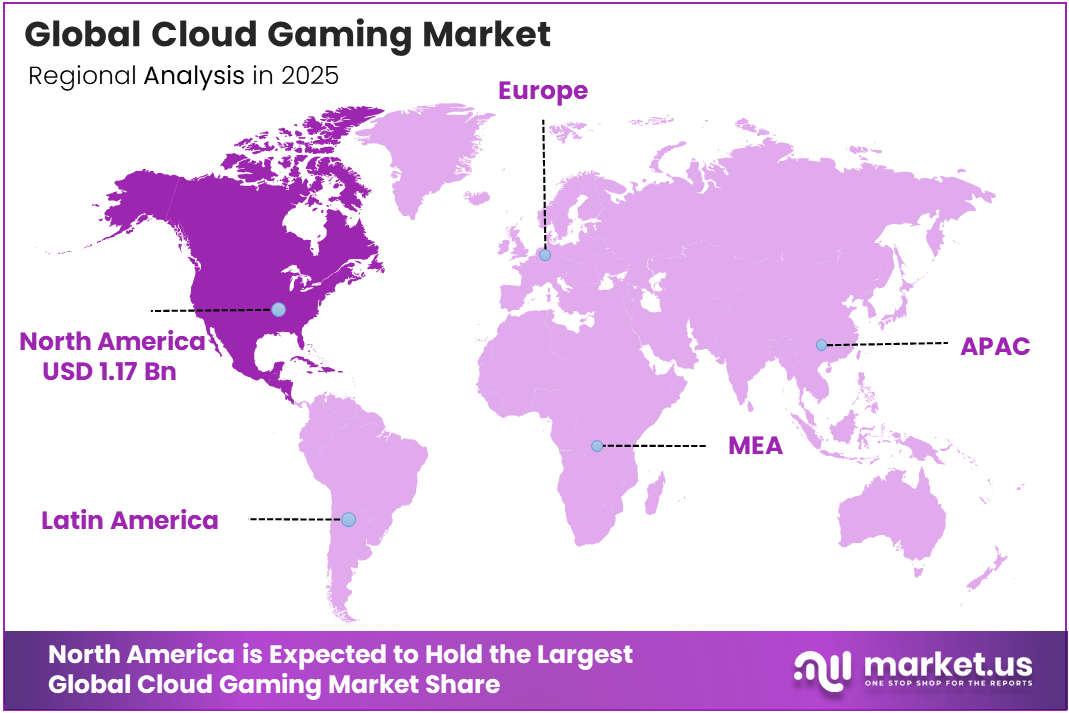
In 2025, the Cloud Gaming Market was valued at USD 3.3 billion. The market is projected to grow at a CAGR of 44.2% during 2026–2035, reaching approximately USD 127.8 billion by 2035. North America dominated the global market in 2025, accounting for more than 35.6% of the total market share and generating approximately USD 1.17 billion in revenue.
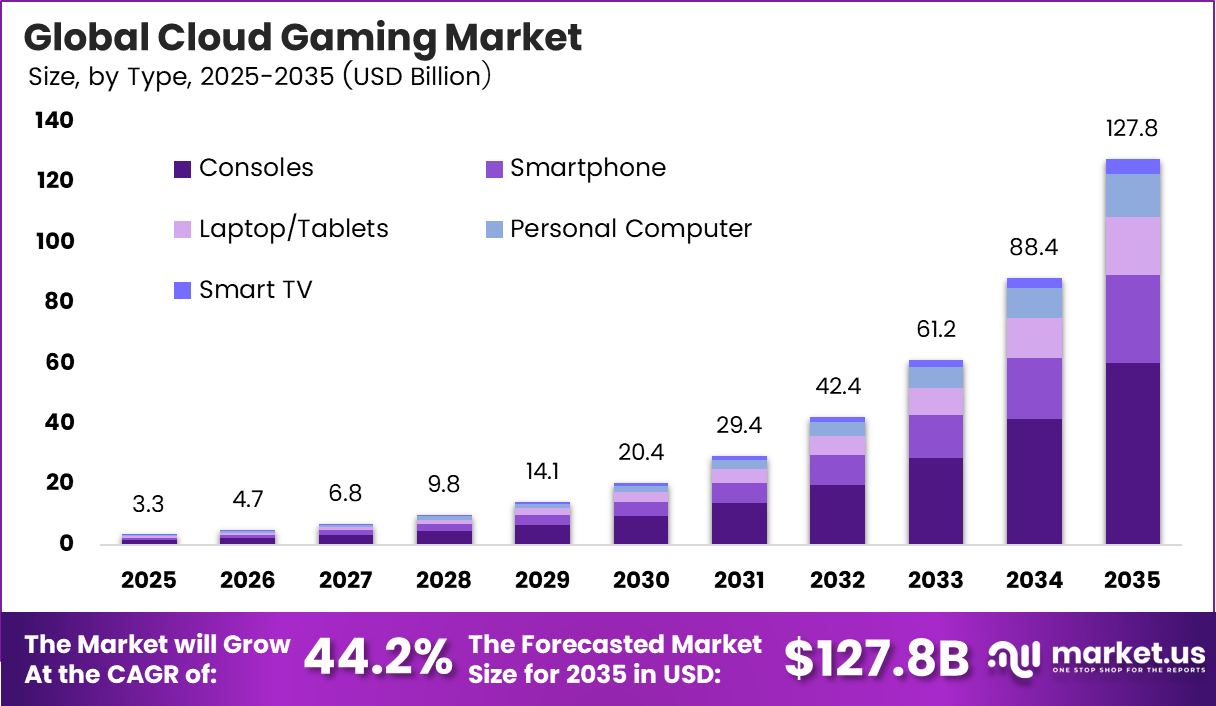
The cloud gaming market is gaining strong momentum as high-speed internet and 5G networks expand worldwide. According to the International Telecommunication Union, nearly 6 billion people, or 74% of the global population, were online in 2025, compared with 60% in 2020. This means around 1.3 billion new internet users were added in five years.
Ericsson reported that more than 660 million 5G subscriptions were added globally in 2025, taking total 5G connections beyond 3.1 billion by early 2026. This network growth is important because cloud gaming needs fast speed, strong bandwidth, and low latency to deliver smooth real-time gameplay.
North America remains a leading market, supported by strong digital infrastructure. The FCC reported that 94% of U.S. homes and businesses had broadband access as of June 2024, while Ericsson placed North America’s 5G penetration at 79%. Another key factor supporting growth is the rising cost of traditional gaming hardware. The U.S. Department of Commerce stated that the global video game industry reached USD 184 billion in 2023, with more than 3.2 billion active gamers.
However, gaming PCs can cost USD 1,200–2,000, while PS5 and Xbox Series X prices have moved to USD 649 or above. Cloud gaming reduces this cost barrier by allowing users to play through smartphones, tablets, or basic laptops. With 7.2 billion smartphones in use globally by 2025 and mobile broadband at 99 subscriptions per 100 people, cloud gaming has a large and growing user base.
Key Takeaway
- The Cloud Gaming Market was valued at USD 3.3 billion in 2025 and is projected to reach USD 127.8 billion by 2035.
- The market is expected to expand at a strong 44.2% CAGR during 2026–2035, supported by subscription gaming and cloud infrastructure growth.
- Consoles held the leading 47.3% share, supported by dedicated hardware and demand for immersive gaming experiences.
- Video streaming dominated with a 71.2% share, as remote game rendering enables gameplay across smartphones, smart TVs, browsers, and low-cost laptops.
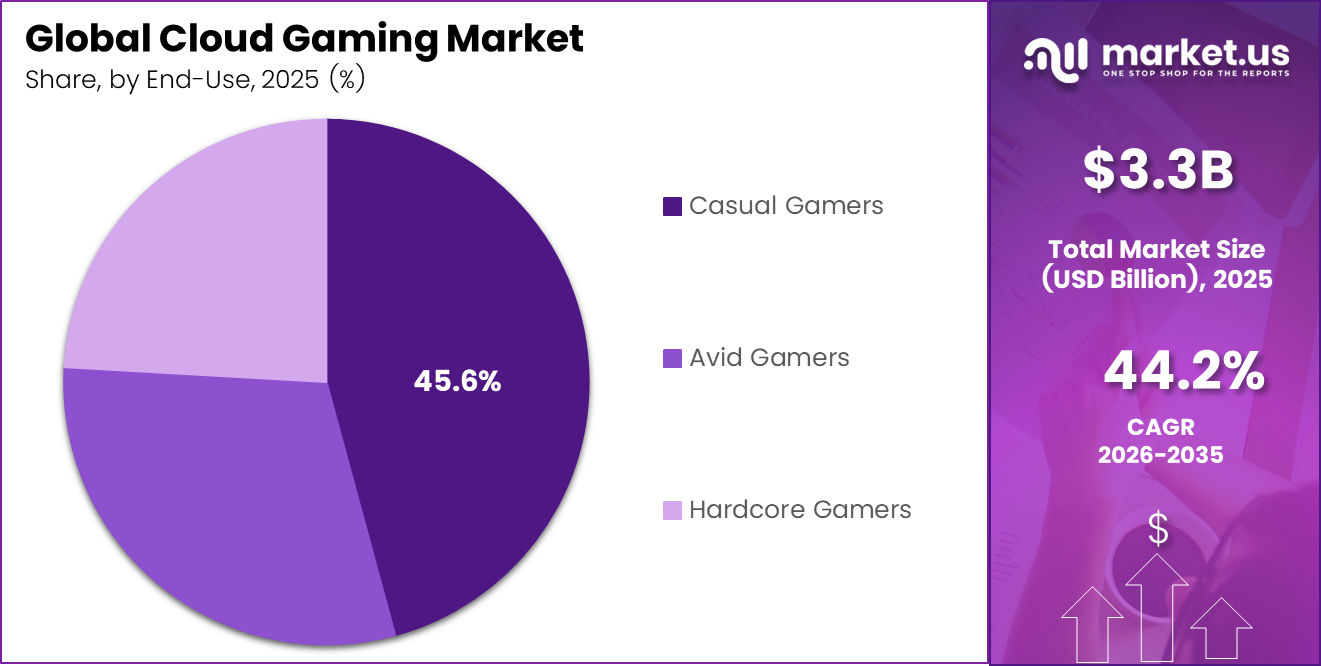
- Casual gamers accounted for 45.6% of the market, driven by accessible, low-commitment, and device-flexible gaming options.
- North America led the market in 2025, accounting for over 35.6% share and approximately USD 1.17 billion in revenue.
By Device
Consoles dominate with 47.3% due to dedicated hardware enabling immersive gameplay experiences.
Consoles command the largest share of the cloud gaming market by device because their architecture, installed base, and integrated cloud infrastructure create a structural dominance that no competing device class can replicate at scale. Sony’s PlayStation Network recorded 123 million monthly active users as of June 2025, with PS5 lifetime shipments reaching 86.12 million units as of November 2025 while PlayStation held approximately 45% of the overall console market in 2025.
Nintendo’s Switch 2 shipped 17.37 million units by December 31, 2025, surpassing 15 million sell-through in just seven months of availability, a launch trajectory Bloomberg reported was underpinned by a supplier plan to produce up to 25 million units by March 2026. Combined with the legacy Nintendo Switch 1 base of 155.37 million lifetime units shipped, these two platform families alone represent over 258 million active console endpoints connected to digital storefronts.
By Streaming Type
Video Streaming dominates with 71.2% market share; File Streaming is the fastest-growing segment.
The Video Streaming segment commands approximately 71.2% of the cloud gaming market by streaming type, and its structural dominance is anchored in the architecture of the internet itself, not merely platform preference. Video streaming operates on a thin-client model: all game rendering GPU rasterization, physics simulation, frame compositing executes remotely on data-centre hardware, and only the compressed video output is transmitted to the end-user device.
The macro-level infrastructure underpinning this advantage is decisive. According to the International Telecommunication Union (ITU) Facts and Figures 2025, an estimated 6 billion people, approximately 75% of the global population, were using the internet in 2025, up from 5.8 billion (71%) in 2024.
Crucially, the OECD’s Closing Broadband Connectivity Divides Report (2025) confirmed that worldwide broadband connections (fixed and mobile) reached 9.4 billion subscriptions at the end of 2024, more than doubling the 3.4 billion subscriptions recorded a decade prior in 2014. This tripling of connected endpoints directly expands the addressable base for video-streamed game sessions, since each new broadband subscriber is immediately a potential video-streaming cloud gaming user, with no hardware upgrade required.
By End-User
Casual Gamers dominate with 45.6% due to low-commitment, accessible play driving mass adoption.
The Casual Gamers segment holds the dominant share of the cloud gaming market at 45.6%, and this leadership is structurally anchored in the global democratisation of mobile internet access. According to the GSMA’s State of Mobile Internet Connectivity Report 2025, 4.7 billion people representing 58% of the world’s population now use mobile internet services on their own devices, with over 200 million new mobile internet users added in 2024 alone.
This is decisive for casual cloud gaming because the segment’s entire value proposition rests on zero-hardware-cost access: a casual gamer requires only a connected smartphone or budget device to stream a game session, a barrier-removal mechanism uniquely suited to this population tier. Corroborating this, the ITU’s Facts and Figures 2025 confirmed that active mobile broadband subscriptions have reached 99 per 100 inhabitants globally, with mobile broadband now accounting for 89% of all mobile subscriptions, up from less than 50% a decade prior.
Critically, the Business of Apps platform tracker recorded 46.9 billion game downloads across Google Play and the iOS App Store in 2024 alone, with casual and hyper-casual titles free-to-play, single-tap mechanic games dominating those download charts. The economic logic is direct: cloud gaming eliminates the client-side rendering hardware cost, and casual gamers are precisely the demographic that has historically been excluded from gaming by device cost.
Key Market Segments
By Device
- Consoles
- Laptop/Tablets
- Personal Computer
- Smart TV
- Smartphone
By Streaming Type
- Video Streaming
- File Streaming
By End-User
- Casual Gamers
- Avid Gamers
- Hardcore Gamers
Geopolitical Impact Analysis
Geopolitical tensions are structurally raising the delivered cost base of cloud gaming infrastructure by inflating tariffs on critical ICT hardware, elongating shipping lead times for servers and GPUs, and amplifying data‑center energy cost volatility in key hosting hubs. Average US tariffs on Chinese exports now stand at 47.5% and China’s at 31.9%, versus pre‑2018 levels that were over 15 times lower, directly increasing landed prices of network equipment, server motherboards, and PCB assemblies that still rely heavily on China‑centric electronics value chains.
At the logistics layer, Red Sea attacks cut Suez Canal trade volumes by 50% year‑on‑year in the first two months of 2024 and forced rerouting around the Cape of Good Hope, adding 10 or more sailing days on Asia–Europe lanes that carry a substantial share of racks, switches, and edge‑node hardware for European cloud gaming points of presence.
UNCTAD further reports that average container spot rates out of Shanghai more than doubled after December 2023, with rates to Europe tripling, implying a two‑ to three‑fold increase in ocean freight embedded in each additional megawatt of rack capacity deployed for cloud streaming clusters.
These trade and routing shocks intersect with energy‑market volatility to compress margins in a segment whose economics are dominated by compute and power. The International Energy Agency estimates that data centers already account for about 1.5% of global electricity demand, or roughly 415 TWh in 2024, and projects demand to more than double to around 945 TWh by 2030, with data centers driving over 20% of total power‑demand growth in advanced economies.
Regional Analysis
North America leads with a 35.6% share and a USD 1.17 billion market value.
North America currently represents the dominating cloud gaming region, accounting for 35.6% of global market revenues, estimated at around USD 1.17 billion, supported by high broadband penetration, early adoption of cloud technologies, and a large base of paying gamers. Major cloud and gaming platform providers, including leading U.S. and Canadian players, leverage mature data center infrastructure and 5G deployment to deliver low-latency, subscription-based cloud gaming services, reinforcing the region’s leadership position.
The ecosystem benefits from strong console and PC gaming cultures transitioning to cloud-based access, with monetization driven by subscription bundles, cross-platform libraries, and integrated digital storefronts. Europe is an important secondary hub, where growing online gaming demand, regulatory support for digital infrastructure, and rising consumer acceptance of game streaming are expanding cloud gaming adoption, especially across Western European economies.
Asia Pacific, meanwhile, is emerging as the fastest-growing cloud gaming region, underpinned by rapid expansion of mobile-first gaming, aggressive 5G roll-outs, and high smartphone penetration in key markets such as China, India, Japan, and South Korea. The region already accounts for a substantial share of global cloud gaming revenues and is projected to register the highest CAGR through the forecast period, driven by young demographics, rising disposable incomes, and strong interest in e-sports and online multiplayer formats.
Key Regions and Countries
North America
- US
- Canada
Europe
- Germany
- France
- The UK
- Spain
- Italy
- Rest of Europe
Asia Pacific
- China
- Japan
- South Korea
- India
- Australia
- Rest of APAC
Latin America
- Brazil
- Mexico
- Rest of Latin America
Middle East & Africa
- GCC
- South Africa
- Rest of MEA
Market Dynamics
Challenge
Persistent last-mile latency and jitter remain major barriers to cloud gaming adoption because experience quality declines significantly when end-to-end latency exceeds 40-50 ms and packet loss rises above 0.5-1%. In many emerging markets, international network latency still ranges between 60-120 ms, with 1-3% packet loss during peak hours, particularly where fiber penetration is below 30% of households and 5G population coverage remains under 40%.
While major urban markets across North America, Western Europe, Japan, and South Korea can support 1080p cloud gaming at 15-25 Mbps and 4K streaming at 35-50 Mbps, many regions in APAC, Latin America, and Africa continue to record average downlink speeds below 20 Mbps with contention ratios of 30-60 users per access node. As a result, latency-sensitive genres such as shooters and fighting games face limited adoption despite growing broadband availability.
These network constraints reduce the effective cloud gaming addressable base from an estimated 60-70% of connected households to only 30-40%, lowering near-term adoption by 15-25% and creating an estimated 1.3 percentage point annual growth drag compared with networks consistently delivering below 30 ms latency. Addressing this challenge requires wider deployment of edge infrastructure within 20-50 km of metro areas, QoS optimization, adaptive streaming technologies, and continued fiber and standalone 5G expansion over the next 2-4 years.
| Challenge | (~) % CAGR | Geographic Relevance | Mitigation Horizon |
|---|---|---|---|
| Last-mile latency gaps | -1.3% | Emerging APAC, LatAm, Africa | Medium term (2-4 years) |
| GPU & cloud capacity strain | -1.1% | Global hyperscaler regions | Medium term (2-4 years) |
| Energy & ESG cost pressure | -0.9% | EU, North America, advanced APAC | Long term (≥ 4 years) |
| Content rights & rev-share complexity | -0.8% | North America, EU, Asia licensing hubs | Medium term (2-4 years) |
| Price-sensitive ARPU ceilings | -1.0% | India, SEA, LatAm mass markets | Long term (≥ 4 years) |
| Specialist talent constraints | -0.7% | Global Tier-1 tech hubs | Medium term (2-4 years) |
Opportunity
Cross-platform cloud-only game releases represent a strong future opportunity because most games are still developed for console or PC first and only later adapted for streaming. Although cloud gaming revenue is projected to grow at a 28-40% CAGR through the early 2030s, much of this growth still depends on existing game libraries rather than cloud-native titles.
Cloud-first games designed with cross-device play, cross-save, and instant access can increase player engagement by 20-30% while lowering distribution costs. If 10% of new AA/AAA titles (15-25 games annually) become cloud-first by 2030, platforms could generate an additional USD 15-20 in lifetime value per user through DLC, battle passes, and live content.
Publishers could also redirect 5-10% of gross revenue from traditional retail channels to cloud platforms, improving margins by 300-500 basis points and contributing an additional 1-2 percentage points to industry CAGR, particularly in broadband-rich but console-limited regions such as parts of APAC and Eastern Europe.
| Opportunity | (~) % Potential
CAGR |
Geographic Relevance | Execution Window |
|---|---|---|---|
| Telco–Cloud Gaming Revenue-Share Bundles | +2.0% | APAC, India, LatAm, EMEA emerging | Short term |
| Cross-Platform Cloud-Only Game Releases | +1.8% | North America, EU, APAC tier-1 | Medium term |
| Ad-Supported & Hybrid Monetization Models | +1.5% | Global, especially price-sensitive markets | Short term |
| Enterprise & B2B Cloud Gaming Use-Cases | +1.2% | North America, EU, Asia corporate hubs | Medium term |
| Low-Cost Device & Smart TV Integration | +1.7% | APAC, Middle East, Africa, LatAm | Medium term |
| Regional M&A and Platform Roll-Ups | +1.3% | EU, APAC, Middle East, LatAm | Long term |
Driver
5G densification is a key enabler for cloud gaming because it shifts the experience from being largely Wi-Fi dependent to a viable mobile-first use case. In high smartphone-penetration markets where fixed broadband quality is uneven, this significantly expands the addressable user base.
Latency improvements are especially important because cloud gaming performance is highly sensitive to network stability. Moving from 40-60 ms inconsistent latency to more stable sub-20 ms connections can increase session duration, reduce drop-offs, and improve conversion to paid tiers or premium plans.
As 5G networks densify in 2026, cloud gaming becomes commercially more viable on mobile networks, not just through higher speeds but through more consistent real-time responsiveness. This strengthens adoption potential in emerging markets and supports broader growth in interactive, latency-sensitive gaming workloads.
| Driver | (~) % Impact on CAGR | Geographic Relevance | Impact Timeline |
|---|---|---|---|
| 5G densification and lower-latency mobile access | +3.0% | APAC corridors, North America core, Western Europe | Short term (≤ 2 years) |
| Edge GPU deployment and distributed rendering capacity | +2.4% | North America core, EU data-center hubs, APAC metros | Medium term (2-4 years) |
| Subscription-led monetization and device-agnostic access | +2.1% | North America core, EU, Japan, South Korea, urban APAC | Short term (≤ 2 years) |
| Falling latency tolerance through network optimization | +1.8% | Urban APAC, EU5, Gulf metros, North America core | Medium term (2-4 years) |
| Expansion of GPU supply and cloud infrastructure capex | +2.6% | North America, EU, India, Southeast Asia, Middle East | Medium term (2-4 years) |
| Regulatory formalization of online gaming and payment rails | +1.2% | India, EU, UK, selected APAC markets | Short term (≤ 2 years) |
Restraint
Cloud gaming is highly bandwidth intensive, with 1080p60 streams consuming approximately 2.5-11 GB per hour and some high-end usage reaching 5-20 GB per hour, especially at higher resolutions like 4K. This creates significant data pressure on consumer broadband and mobile plans.
In developed markets such as the U.S., where households already average around 590 GB/month of data usage, just 2 hours/day of cloud gaming at approximately 8-10 GB/hour can push consumption beyond 1 TB/month, often triggering overage costs or forcing upgrades to premium data tiers. In emerging markets like India, even smaller data bundles of 50-100 GB can be exhausted within 10-15 hours of high-quality gameplay, limiting sustained usage.
Although markets like India’s cloud gaming sector are projected to grow at over 40% CAGR (to 2034) from a low base of about USD 15 million in 2025, adoption remains highly sensitive to broadband pricing and fair-use limits. This creates a structural drag in regions like India, LATAM, MENA, and rural APAC, contributing an estimated -2.2% impact on CAGR through lower conversion, restricted usage, and higher churn despite strong underlying demand.
| Restraint | (~) % Impact on
CAGR |
Geographic Relevance | Impact Timeline |
|---|---|---|---|
| Latency gap | -3.0% | North America, Western Europe, Tier-1 APAC metros | Short term (≤ 2 years) |
| Broadband cost | -2.2% | India, LATAM, MENA, rural APAC | Short term (≤ 2 years) |
| GPU capacity strain | -2.0% | North America core, EU, APAC hyperscale hubs | Medium term (2-4 years) |
| Edge buildout lag | -1.8% | Emerging APAC, LATAM, Eastern Europe | Medium term (2-4 years) |
| Platform regulation | -1.5% | India, EU, selected APAC markets | Short term (≤ 2 years) |
| Content friction | -1.3% | Global, strongest in multi-publisher markets | Medium term (2-4 years) |
Key Players Analysis
Microsoft commands the strongest integrated cloud gaming position, with its gaming segment generating $23.5 billion in FY2025 revenue, up 9% YoY, driven by Xbox content & services growing 16%, bolstered by the $68.7 billion Activision Blizzard acquisition completed in 2023. Xbox Cloud Gaming hours surged 45% YoY through November 2025, with Game Pass approaching ~35 million subscribers and Xbox Cloud Gaming alone recording 140 million hours streamed in Q2 FY25 alone. The service expanded into India, Brazil, and Argentina in late 2025.
NVIDIA anchors the infrastructure layer: its GeForce NOW platform surpassed 4,000 titles, and the company’s gaming segment posted $16.0 billion in FY2026 revenue (up 41% YoY), while total FY2026 revenue reached $215.9 billion, a 65% jump underwriting massive GPU infrastructure CapEx for cloud delivery.
Sony Interactive Entertainment’s G&NS segment recorded ¥4,685.7 billion (~$31.1 billion) in FY2025 sales, with 125 million monthly active users; cloud streaming for PlayStation Plus Premium launched formally in November 2025 across thousands of PS5 titles. Tencent’s domestic gaming revenues hit ¥164.2 billion (~$22.5B) (+18% YoY) in FY2025, with international gaming revenues exceeding ¥77.4 billion (~$10.6B) for the first time. Its START cloud gaming platform benefits directly from this scale, alongside ¥18 billion (~$2.5B) invested in AI product development.
Amazon Luna, backed by AWS infrastructure, expanded to 24 countries by October 2025 and leverages Prime bundling to drive low-friction user acquisition, though Amazon does not break out standalone Luna revenues within its AWS reporting. Ubisoft plays a dual role as a cloud-native publisher and as a content supplier to Amazon Luna and Microsoft; its net bookings for the first nine months of FY2025-26 reached €1.1 billion (+18% YoY), though FY2024-25 full-year net bookings declined to €1.85 billion.
Top Key Players in the Market
- Verizon
- Ubitus Inc.
- Ubisoft
- Tencent Holdings Ltd.
- Sony Interactive Entertainment
- Parsec Cloud Inc. (Unity Software Inc.)
- NVIDIA Corporation
- Numecent Holdings Ltd.
- Microsoft Corporation
- Locus Robotics
- Intel Corporation
- IBM Corporation
- Google Inc.
- Electronic Arts, Inc.
- Deutsche Telekom
- Blacknut
- Apple Inc.
- Antplay. tech
- Amazon Inc.
Recent Developments
In March 2025, Amazon Luna publicly announced a multi-year content licensing agreement with Electronic Arts (EA), immediately adding titles including Star Wars Jedi: Survivor, Star Wars Jedi: Fallen Order, and Dead Space to the Luna+ library, with further EA catalog titles committed for staged rollout.
In December 2025, Ubitus K.K. announced its official selection for Japan’s “Large-Scale Growth Investment Grant for Medium-Sized and Small Enterprises” administered by the Ministry of Economy, Trade and Industry (METI). The approved project titled “Regional Distributed GPU Infrastructure Development for the Generative AI Era” carries a total investment amount of JPY 17 billion (~$113 million), entirely dedicated to the deployment of NVIDIA Blackwell GPU cloud infrastructure in Japan.
Report Scope
| Report Features | Description |
|---|---|
| Market Value (2025) | USD 3.3 Billion |
| Forecast Revenue (2035) | USD 127.8 Billion |
| CAGR (2026-2035) | 44.2% |
| Base Year for Estimation | 2025 |
| Historic Period | 2020-2024 |
| Forecast Period | 2026-2035 |
| Report Coverage | Revenue Forecast, Market Dynamics, Competitive Landscape, Recent Developments |
| Segments Covered | By Device (Consoles, Laptop/Tablets, Personal Computer, Smart TV, Smartphone), By Streaming Type (Video Streaming, File Streaming), By End-User (Casual Gamers, Avid Gamers, Hardcore Gamers) |
| Regional Analysis | North America – US, Canada; Europe – Germany, France, The UK, Spain, Italy, Rest of Europe; Asia Pacific – China, Japan, South Korea, India, Australia, Singapore, Rest of APAC; Latin America – Brazil, Mexico, Rest of Latin America; Middle East & Africa – GCC, South Africa, Rest of MEA |
| Competitive Landscape | Verizon, Ubitus Inc., Ubisoft, Tencent Holdings Ltd., Sony Interactive Entertainment, Parsec Cloud Inc. (Unity Software Inc.), NVIDIA Corporation, Numecent Holdings Ltd., Microsoft Corporation, Locus Robotics, Intel Corporation, IBM Corporation, Google Inc., Facebook, Electronic Arts, Inc., Deutsche Telekom, Blacknut, Apple Inc., Antplay.Amazon Inc. |
| Customization Scope | Customization for segments and region/country-level will be provided. Moreover, additional customization can be done based on the requirements. |
| Purchase Options | We have three licenses to opt for: Single User License, Multi-User License (Up to 5 Users), Corporate Use License (Unlimited Users and Printable PDF) |





























