


Report Overview
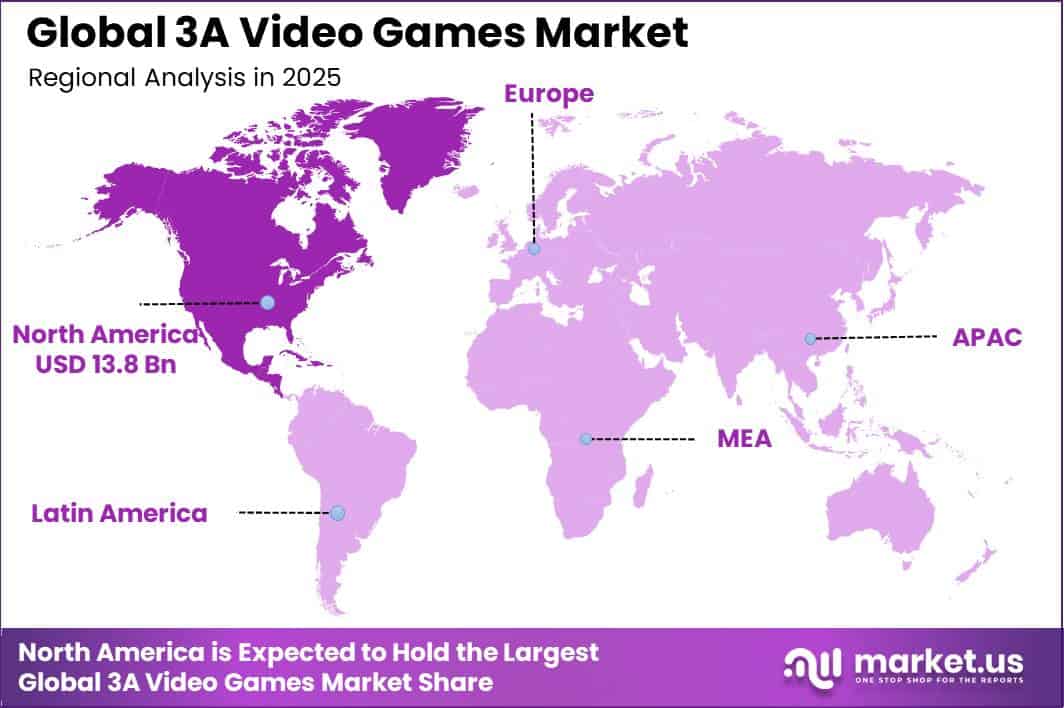
In 2025, the Global 3A Video Games Market was valued at USD 38.9 billion. The market is projected to grow at a CAGR of 6.7% during 2026–2035, reaching approximately USD 74.5 billion by 2035. North America dominated the global market in 2025, accounting for more than 35.4% of the total market share and generating approximately USD 13.8 billion in revenue.
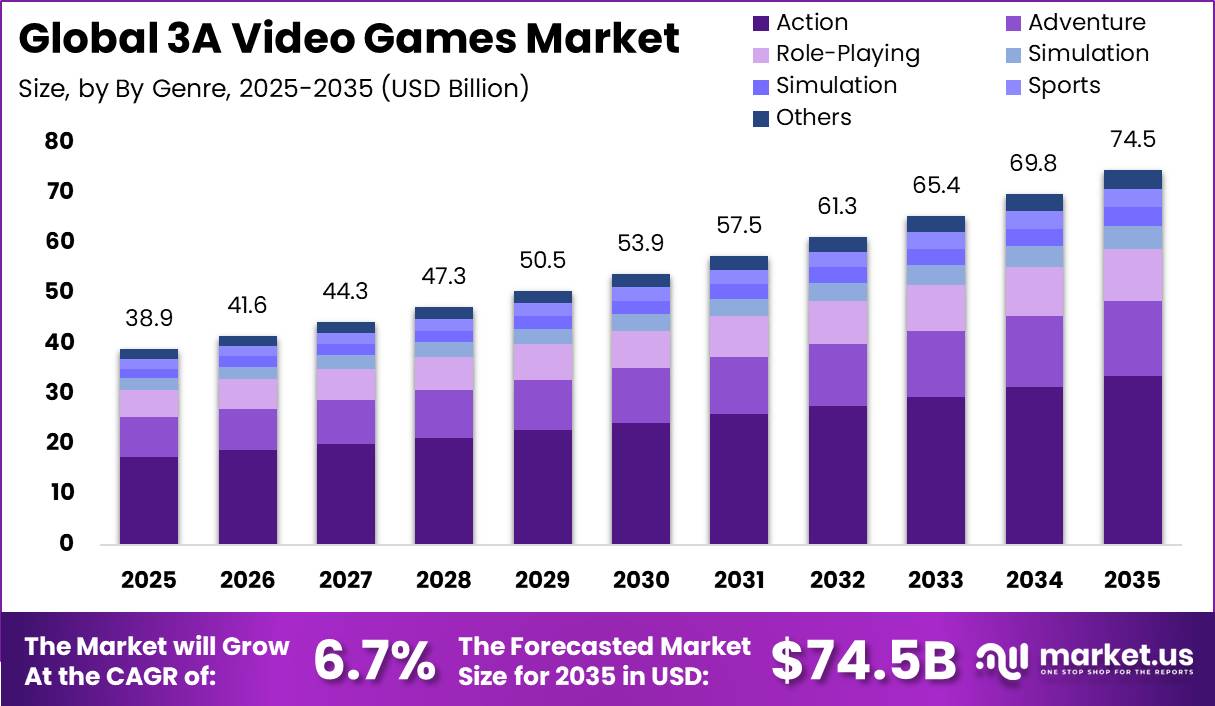
Market growth is supported by a large active gaming population, higher spending on premium digital content, and strong demand for advanced console and PC games. According to the Entertainment Software Association, 212.3 million Americans, equal to 67% of the U.S. population aged 5–90, played video games for at least 1 hour per week in 2025. Around 83% of U.S. households used at least 1 gaming device, while 52% of players used PCs and 44% used consoles.
This large hardware base creates strong demand for 3A games that require advanced graphics, multiplayer systems, regular updates, downloadable content, and high-performance devices. U.S. video game spending reached USD 60.7 billion, including USD 52.3 billion for content, USD 5.4 billion for hardware, and USD 2.95 billion for accessories.
Content spending increased from USD 51.7 billion in 2024, while hardware sales grew 9% year over year. Subscription spending increased 20%, supporting recurring publisher revenue. In addition, 78% of Gen Z and 67% of millennial players purchased in-game content, with buyers spending a median USD 20 per month, strengthening long-term revenue opportunities for 3A publishers.
Key Takeaway
- The 3A Video Games Market was valued at USD 38.9 billion in 2025 and is projected to reach USD 74.5 billion by 2035, growing at a CAGR of 6.7%.
- Live-Service/Games-as-a-Service (GaaS) dominated the 3A video games market with a 65.3% share.
- Action games led the genre segment, accounting for a 45.1% market share.
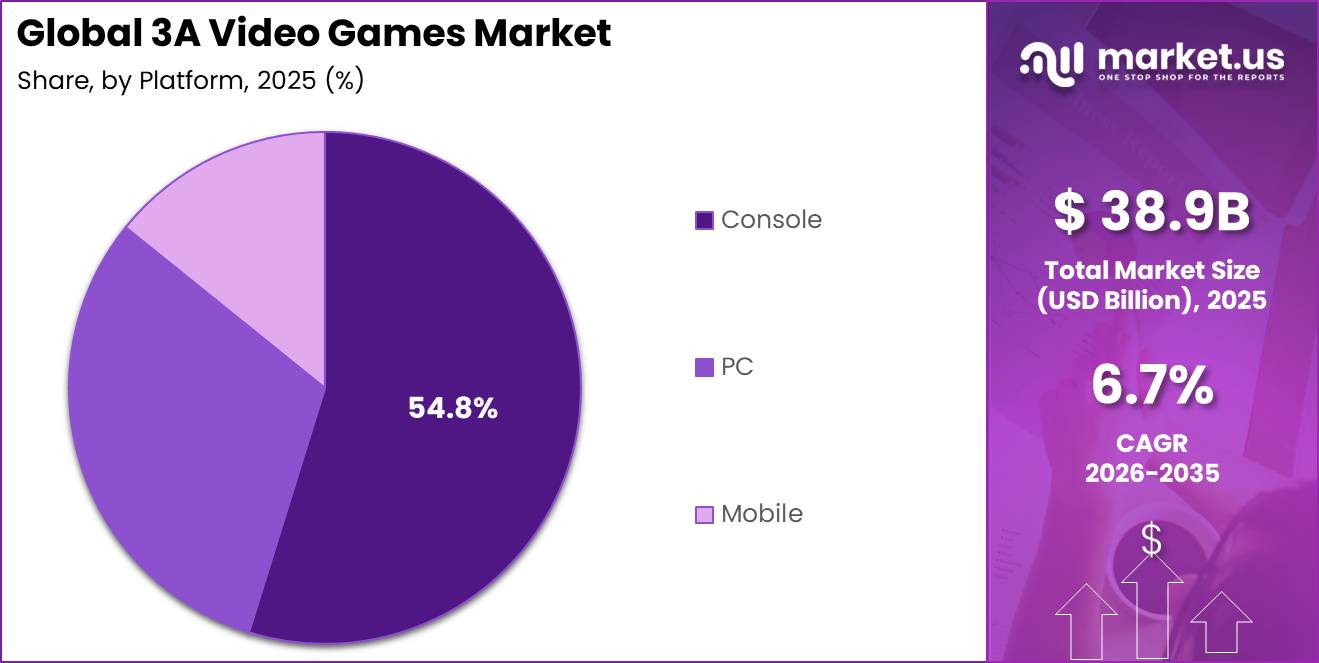
- Console gaming remained the leading platform segment with a 54.8% share.
- Digital downloads dominated game distribution, capturing an 85.2% share.
- Casual gamers represented the largest end-user segment with an 80.4% share.
- North America led the market in 2025 with a 35.4% share and approximately USD 13.8 billion in revenue.
Market Statistics and Data Insights
- Around 83% of U.S. households used at least 1 video game device during the previous 12 months, while more than half of players used more than 1 device during a typical week.
- In Europe, 199 million people aged 6–75 played video games in 2025, equal to 51% of the population within that age range across the 16 markets covered.
- Among European players, 47% played on consoles and 34% played on PCs, while average gaming time remained around 9 hours per week. These platforms are central distribution channels for high-budget AAA titles.
- European video game revenue reached EUR 29.7 billion in 2025, with 91% coming through digital channels and only 9% through physical formats.
- PlayStation recorded 125 million monthly active users at the end of March 2026, giving AAA publishers access to a very large active console ecosystem.
- Nintendo Switch 2 sold more than 3.5 million units worldwide within its first 4 days after launching on June 5, 2025, the strongest 4-day hardware launch in Nintendo’s history.
- Sony shipped 16.0 million PlayStation 5 consoles during FY2025, supporting continued expansion of the current-generation hardware base for graphically advanced games.
- ESA reported that 63% of U.S. players believe video games provide the strongest entertainment value for their money compared with video streaming, music, books, magazines, and news content.
- Electronic Arts generated USD 7.531 billion in FY2026 net revenue. Live services and other revenue reached USD 5.383 billion, representing 71% of total revenue, compared with USD 2.148 billion from full-game sales.
- In GDC’s 2026 survey, 42% of developers named Unreal Engine as their primary development engine, compared with 30% for Unity. Unreal usage increased to 47% among AAA studios and 59% among AA studios.
- Steam Deck has also become an active production platform, with 28% of developers developing or optimizing games for it and 40% expressing interest, compared with 39% interested in Nintendo Switch 2 development.
- Generative AI is already used by 36% of game-industry professionals, but adoption differs sharply by function: 30% of game-studio employees reported using it compared with 58% across publishers, support teams, and marketing/PR organizations.
- Among professionals using generative AI, 81% used it for research or brainstorming, 47% for daily administrative tasks, 47% for coding assistance, and only 35% for prototyping. This shows that production-level AI adoption remains less developed than basic productivity use.
By Business Model
Live-Service/Games-as-a-Service (GaaS) held a dominant 65.3% share of the 3A video games market, supported by its ability to generate revenue long after the initial game launch. Unlike one-time premium sales, GaaS titles remain active through multiplayer modes, seasonal events, expansion packs, battle passes, virtual currency, and cosmetic items.
The Entertainment Software Association’s 2026 survey found that 58% of U.S. players aged 8 years and above purchased some form of in-game content. Around 34% bought virtual currency, 27% purchased skins or customization items, 26% bought expansion packs, and 26% purchased season or battle passes. These spending patterns directly support the GaaS model.
The digital gaming ecosystem in Europe also supports segment growth. Revenue across 5 major European game markets reached EUR 26.8 billion in 2024, increasing 4% from the previous year. In Germany, in-game and in-app purchases represented 40% of game-market spending, compared with 31% for game purchases.
By Genre
The Action segment held a dominant 45.1% share of the 3A video games market, supported by strong demand for fast gameplay, combat, exploration, multiplayer features, and high-quality graphics. These features closely match the capabilities of large-budget console and PC games.
Video Games Europe reported that action and puzzle games were the 2 most preferred genres in 20 of 21 countries included in its survey of more than 24,000 players across 6 continents.
This broad popularity gives publishers a large audience for shooters, action-adventure games, fighting games, and open-world titles. The segment also benefits from strong digital distribution. Europe’s video game sector generated EUR 29.7 billion in revenue, with digital channels accounting for 91% and physical formats only 9%.
By Platform
The Console segment held a dominant 54.8% share of the 3A video games market, supported by its standardized hardware, strong graphics performance, and ease of use compared with gaming PCs. A common hardware platform allows publishers to optimize 3A games for a large user base while reducing compatibility and technical support issues.
Sony reported that cumulative PlayStation 5 sales reached 93.7 million units by March 2026, while PlayStation Network recorded 125 million monthly active accounts. During the January–March 2026 quarter, Sony sold 74.6 million full-game software units, with digital downloads representing 85% of full-game sales. These figures show the large and highly digital console gaming ecosystem.
Nintendo also highlights strong demand for dedicated gaming devices. Its Switch family reached 154.01 million hardware units and 1.45 billion software units sold by September 2025. During the same period, Nintendo Switch 2 recorded 10.36 million hardware sales and 20.6 million software sales in its early launch phase.
By Distribution Channel
Digital Downloads held a dominant 85.2% share of the 3A video games market, supported by fast access, easier updates, and direct distribution through console and PC stores. This channel is especially important for 3A games, which often require launch-day patches, performance fixes, multiplayer updates, expansions, and seasonal content.
Ukie reported that UK consumer spending on video games reached a record GBP 8.76 billion in 2025, with software accounting for GBP 6.03 billion. Physical software represented less than 4% of total spending, showing the strong shift toward digital game purchases. Better broadband infrastructure is also supporting digital distribution.
By mid-2025, fixed broadband covered 98.0% of EU households, while very-high-capacity network coverage reached 85.5%. Fibre-to-the-premises coverage stood at 74.1%, and gigabit-capable coverage reached 84.3%. These networks help reduce download times for large 3A game files and frequent updates.
By End-User
Casual Gamers held a dominant 80.4% share of the 3A video games market, supported by the growing popularity of gaming as a mainstream entertainment activity. Casual players generally prefer relaxation, social interaction, flexible play sessions, and easy-to-access gameplay.
The Entertainment Software Association’s Power of Play study surveyed 24,216 active players aged 16 and above across 21 countries and found that 48% were women and 51% were men, showing a broad consumer base. Family gaming also supports segment growth. ESA reported that 75% of U.S. parents play video games weekly, while 81% of gaming parents have played with their children and 52% play with them every week.
In Europe, around 199 million players were recorded across 16 markets in 2025. Adults represented 77% of players, women accounted for 46%, and average weekly playtime reached 8 hours and 59 minutes. This broad participation helps 3A publishers increase game sales, digital purchases, and long-term franchise engagement.
Key Market Segments
By Business Model
- Live-Service/Games-as-a-Service (GaaS)
- Premium/One-Time Purchase
- Subscription Services
By Genre
- Action
- Adventure
- Role-Playing
- Simulation
- Strategy
- Sports
- Others
By Platform
- Console
- PC
- Mobile
By Distribution Channel
- Digital Downloads
- Online Stores
- Physical Retail
By End-User
- Casual Gamers
- Professional Gamers
Geopolitical Impact Analysis
Geopolitical tensions and changing trade policies are increasing hardware and component costs across the 3A video games market. On January 15, 2026, the U.S. introduced a 25% Section 232 tariff on advanced computing chips, including the Nvidia H200 and AMD MI325X. Gaming-related consumer hardware can remain exempt when imports support domestic supply-chain development.
Other semiconductor components may face combined effective tariffs of up to 50% when Section 232 duties are added to existing Section 301 tariffs on Chinese-origin chips. This creates higher costs for console, GPU, and gaming-PC manufacturers. The WTO also reduced its 2026 merchandise trade growth forecast to 0.5%, compared with 2.4% in 2025.
Global demand for advanced electronics remains strong. WTO data show that AI-enabling goods, including processors and memory chips used in consoles and high-performance PCs, increased 21.9% year on year to USD 4.18 trillion in 2025. These products generated 42% of total global trade growth despite representing only one-sixth of trade volume.
Memory chips under HTS 8542.32 and processors under HTS 8542.31, previously duty-free, can now face origin-based tariffs of up to 25%. Higher crude oil and LNG prices are also increasing energy costs for semiconductor production and data-center operations. In September 2026, the U.S. indicated that a “Phase Two” tariff structure is forthcoming, creating further cost and pricing uncertainty for globally sourced gaming hardware.
Regional Analysis
North America held a dominant 35.4% share of the global 3A video games market, generating around USD 13.8 billion in 2025. The region is also expected to remain one of the fastest-growing markets, supported by a strong console and PC gaming ecosystem across the United States, Canada, and Mexico. Canada has a well-developed game production base, with its video game industry contributing USD 5.1 billion to national GDP in 2024.
The country had 821 active studios and 34,010 full-time employees, while around 88% of industry revenue came from exports. This strong export base supports the availability of experienced developers, technical skills, and production infrastructure needed for large-budget 3A games.
Mexico is also strengthening North America’s gaming market. PlayStation devices accounted for around 35.4% of the country’s console market, supported by wider PS5 availability and continued demand for exclusive game franchises. Mexico’s active gaming population is projected to exceed 80 million players by the end of the decade, creating a larger audience for premium titles.
Digital gaming demand is also increasing across the region. Canadian mobile game revenue grew by more than 220% between 2015 and 2025, reflecting the wider shift toward digital gaming. High consumer spending, strong broadband availability, growing console adoption, and early access to new hardware are expected to support North America’s leadership in the 3A video games market through 2035.
Key Regions and Countries
North America
- US
- Canada
Europe
- Germany
- France
- The UK
- Spain
- Italy
- Rest of Europe
Asia Pacific
- China
- Japan
- South Korea
- India
- Australia
- Rest of APAC
Latin America
- Brazil
- Mexico
- Rest of Latin America
Middle East & Africa
- GCC
- South Africa
- Rest of MEA
Market Dynamics
Drivers
| Driver | (~) % CAGR | Geographic Relevance | Impact Timeline |
|---|---|---|---|
| Live-service monetization shift | +2.1% | Global | Short term (2 years or less) |
| Console hardware installed base expansion | +1.4% | North America, Asia-Pacific | Short term (2 years or less) |
| Digital distribution cost efficiency | +1.2% | Global | Short term (2 years or less) |
| Cross-platform subscription bundling | +0.9% | North America, Europe | Medium term (2 to 4 years) |
| Strategic capital inflow via LBO/PE consolidation | +0.6% | North America, Middle East | Medium term (2 to 4 years) |
Live-service monetization shift
The shift from one-time game purchases toward recurring live-service revenue is improving publisher economics across the 3A video games market. In fiscal 2026, recurrent consumer spending represented around 78% of bookings at major Tier-1 publishers.
Digital online distribution also accounted for nearly 97% of net bookings, showing how strongly large publishers are moving away from physical game sales. This model extends player spending beyond the traditional 60-day post-launch period through updates, subscriptions, downloadable content, and in-game purchases.
Reduced dependence on physical inventory can also support estimated annual gross-margin gains of around 150 to 200 basis points. Publishers can redirect these savings toward new content and live-service operations, helping successful 3A titles maintain player engagement and generate revenue across a 4 to 6-year lifecycle.
Restraints
| Restraint | (~) % CAGR | Geographic Relevance | Impact Timeline |
|---|---|---|---|
| Semiconductor tariff cost escalation | -1.3% | North America | Short term (2 years or less) |
| Industry-wide layoff and studio contraction | -1.1% | Global | Short term (2 years or less) |
| Elevated development capital costs | -0.7% | North America, Europe | Short term (2 years or less) |
| Regional platform export restrictions | -0.5% | Asia-Pacific | Short term (2 years or less) |
Industry-wide layoff and studio contraction
The ongoing workforce contraction is creating a major challenge for the 3A video games market by reducing production capacity and delaying new projects. Industry tracking indicates around 14,666 job cuts could occur in 2026, following nearly 10,140 layoffs recorded by August 2026.
More than 25,000 positions, equal to roughly 15% of the North American gaming workforce, have been affected by the broader contraction cycle, placing pressure on the region that generates the largest share of 3A revenue.
Some production timelines have been extended by around 12 to 18 months, delaying revenue generation while increasing workloads for remaining employees. North America has also recorded an estimated 11:1 job-seeker-to-opening ratio, showing a significant imbalance between available gaming talent and open positions.
Challenges
| Challenge | (~) % CAGR | Geographic Relevance | Mitigation Horizon |
|---|---|---|---|
| Specialist programming talent deficit | -0.8% | Europe, North America | Medium term (2 to 4 years) |
| Rising AAA production cost inflation | -0.9% | Global | Medium term (2 to 4 years) |
| Generative AI workflow integration uncertainty | -0.4% | Global | Long term (4 years or more) |
| Console-to-cloud infrastructure fragmentation | -0.5% | Asia-Pacific, Europe | Medium term (2 to 4 years) |
Rising AAA production cost inflation
Structural cost inflation remains a major challenge for flagship AAA game development, driven by higher graphics quality, complex multiplayer systems, and longer production cycles. According to TIGA, the share of studios reporting skills shortages declined from 70% in 2023 to 29% in 2026.
However, among affected studios, 79% reported a lack of qualified applicants, while 57% struggled to fill programming roles. These shortages continue to increase operating costs.
Around 62% of affected studios shifted additional work to existing employees, while 40% outsourced specialized functions, often at higher costs. Studios also sourced around 82% to 85% of new hires from experienced industry professionals rather than graduates.
Opportunities
| Opportunity | (~) % CAGR | Geographic Relevance | Execution Window |
|---|---|---|---|
| Co-development and outsourcing partnership models | +1.5% | Asia-Pacific, Europe | Medium term (2 to 4 years) |
| Generative AI-assisted asset production | +1.8% | Global | Medium term (2 to 4 years) |
| Cross-media franchise IP licensing expansion | +0.9% | North America, Asia-Pacific | Long term (4 years or more) |
| Emerging-market mobile-to-console upsell | +0.7% | Latin America, Southeast Asia | Long term (4 years or more) |
Generative AI-assisted asset production
Generative AI-assisted production remains an emerging opportunity rather than a major current growth driver. At the 2026 GDC Festival of Gaming, a survey of more than 2,300 industry professionals showed that most developers still use AI mainly for brainstorming, outlining, and administrative work instead of core game-production tasks.
The larger opportunity lies in automation tools such as skeleton generation and geometry wrapping. If adopted across full production pipelines, these tools could reduce per-asset creation costs by around 20% to 30%. However, capturing this benefit will require multi-year changes in art and engineering workflows, with the strongest margin potential likely in title refreshes, remasters, and labor-intensive AAA production.
Key Players Analysis
The 3A video games market has a clear Tier-1 and Tier-2 competitive structure, led by large platform owners and major global publishers. Sony Interactive Entertainment remains a leading Tier-1 company through its Game & Network Services business, which generated ¥4,685.7 billion, or around USD 31.4 billion, in fiscal 2026.
Digital software and add-on content contributed ¥2,415.3 billion, while network services generated ¥763.1 billion. Tencent reported Q2 2026 revenue of RMB 204.8 billion, up 11% YoY, with domestic games revenue reaching RMB 47.3 billion, up 17%, and international games generating RMB 18.6 billion.
Electronic Arts recorded fiscal 2026 net revenue of USD 7,531 million, including 71%, or USD 5,383 million, from live services. Full-game revenue increased 7% to USD 2,148 million, while R&D spending rose 10%, or USD 259 million. Sony and Microsoft represented 39% and 16% of EA revenue, respectively. Take-Two Interactive is also strengthening its Tier-1 position, with fiscal 2026 net bookings reaching USD 6.72 billion, up 19% YoY.
Recurrent consumer spending represented 78% of bookings, while digital online distribution accounted for 97%. FY2027 guidance stands at USD 8.0–8.2 billion. Nintendo, Bandai Namco, Capcom, Sega, and Ubisoft form the Tier-2 challenger group. Sony’s operating income increased by 48.4 billion yen YoY, while physical distribution now represents under 3% of major publishers’ net bookings.
Top Key Players in the Market
- Electronic Arts
- Take-Two Interactive
- Capcom
- Ubisoft
- Epic Games
- Bluehole
- Nexon
- Riot Games
- Tencent
- Niantic
- Neowiz Games
- Activision Blizzard
- Nintendo
- PlayStation Studios
- Sony Interactive Entertainment
- 2K Games
- Warner Bros. Games
- Xbox Game Studios
- Sega
- Bandai Namco
- Krafton
- Rockstar
- Blizzard Entertainment
Recent Developments
- In 2026, Electronic Arts completed its acquisition by PIF, Silver Lake, and Affinity Partners on August 4 following regulatory and shareholder approvals. The transaction valued EA at approximately USD 55 billion, with shareholders receiving USD 210 per share in cash.
- In 2025, Ubisoft completed Tencent’s strategic investment in Vantage Studios on November 21. Tencent invested EUR 1.16 billion into the subsidiary housing the Assassin’s Creed, Far Cry, and Tom Clancy’s Rainbow Six franchises. The investment valued Vantage Studios at a pre-money enterprise value of EUR 3.8 billion and provided Tencent with a 26.32% economic interest, while Ubisoft retained 73.68% ownership and exclusive control.
Report Scope
| Report Features | Description |
|---|---|
| Market Value (2025) | USD 38.9 Billion |
| Forecast Revenue (2035) | USD 74.5 Billion |
| CAGR (2026-2035) | 6.7% |
| Base Year for Estimation | 2025 |
| Historic Period | 2020-2024 |
| Forecast Period | 2026-2035 |
| Report Coverage | Revenue Forecast, Market Dynamics, Competitive Landscape, Recent Developments |
| Segments Covered | By Business Model (Live-Service/Games-as-a-Service (GaaS), Premium/One-Time Purchase, Subscription Services); By Genre (Action, Adventure, Role-Playing, Simulation, Strategy, Sports, Others); By Platform (Console, PC, Mobile); By Distribution Channel (Digital Downloads, Online Stores, Physical Retail); By End-User (Casual Gamers, Professional Gamers) |
| Regional Analysis | North America – US, Canada; Europe – Germany, France, The UK, Spain, Italy, Rest of Europe; Asia Pacific – China, Japan, South Korea, India, Australia, Singapore, Rest of APAC; Latin America – Brazil, Mexico, Rest of Latin America; Middle East & Africa – GCC, South Africa, Rest of MEA |
| Competitive Landscape | Electronic Arts, Take-Two Interactive, Capcom, Ubisoft, Epic Games, Bluehole, Nexon, Riot Games, Tencent, Niantic, Neowiz Games, Activision Blizzard, Nintendo, PlayStation Studios, Sony Interactive Entertainment, 2K Games, Warner Bros. Games, Xbox Game Studios, Sega, Bandai Namco, Krafton, Rockstar, Blizzard Entertainment |
| Customization Scope | Customization for segments and region/country-level will be provided. Moreover, additional customization can be done based on the requirements. |
| Purchase Options | We have three licenses to opt for: Single User License, Multi-User License (Up to 5 Users), Corporate Use License (Unlimited Users and Printable PDF) |





























