


Report Overview
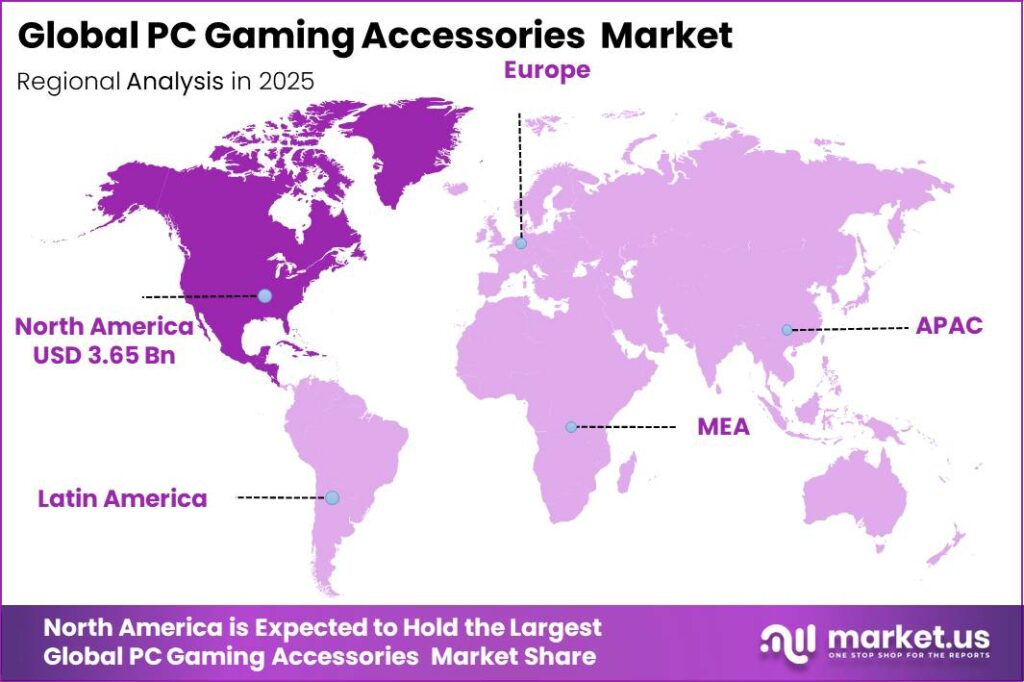
In 2025, the Global PC Gaming Accessories Market was valued at USD 10.4 billion. The market is projected to grow at a CAGR of 9.5% during 2026–2035, reaching approximately USD 25.8 billion by 2035. North America dominated the global market in 2025, accounting for more than 35.21% of the total market share.
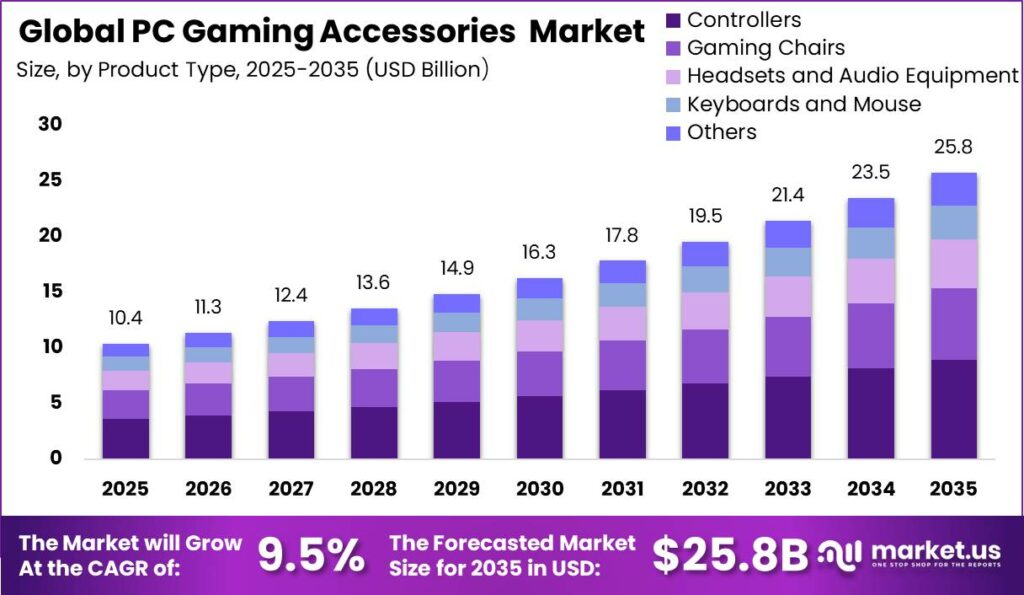
This market growth is primarily supported by the expanding global PC installed base and rising internet penetration. According to Gartner, global PC shipments exceeded 270 million units in 2025, increasing 9.1% from 2024. AI-enabled PCs also increased their share of total shipments from 15% to 31% during the year, expanding the user base for gaming peripherals such as gaming mice, keyboards, and headsets.
The International Telecommunication Union (ITU) reported that 6 billion people, or 74% of the global population, were using the internet in 2025, an increase of more than 240 million users compared to 2024. This growth continues to support online gaming, esports, and demand for high-performance gaming accessories.
IDC reported that India shipped a record 15.9 million PCs in 2025, representing 10.2% year-over-year growth, highlighting strong expansion opportunities across Asia-Pacific. These factors, including 270+ million global PC shipments, 6 billion internet users, and USD 2.95 billion in U.S. gaming accessory spending, provide a strong foundation for the market to reach approximately USD 25.8 billion by 2035.
Key Takeaways
- In 2025, the Global PC Gaming Accessories Market was valued at USD 10.4 billion and is projected to reach approximately USD 25.8 billion by 2035, expanding at a CAGR of 9.5% during the forecast period from 2026 to 2035.
- By Accessories Type, the Controllers segment held the leading position in 2025, capturing 34.66% of the global market revenue.
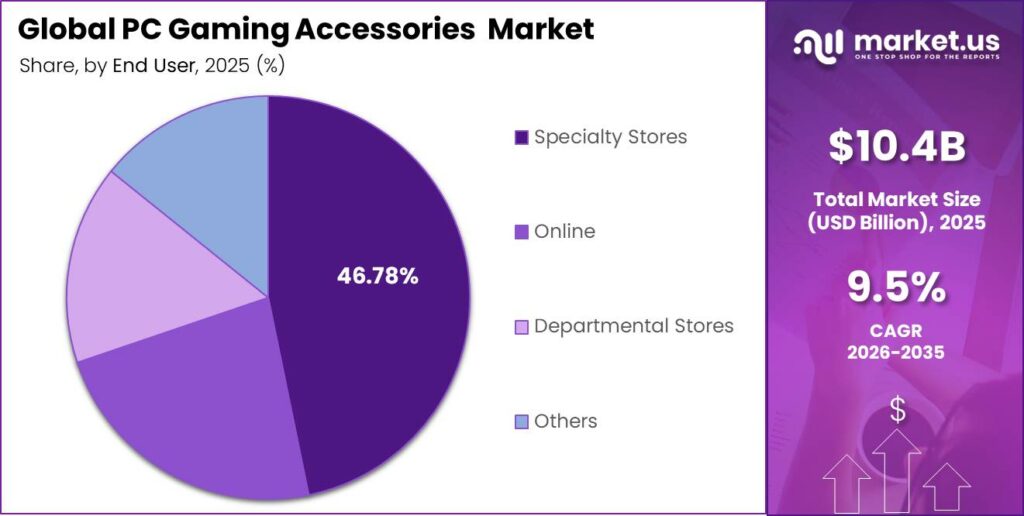
- By Distribution Channel, Specialty Stores accounted for the largest market share of 46.78% in 2025.
- North America dominated the global market in 2025, accounting for more than 35.21% of the total market share.
By Accessories
The Controllers segment accounted for the largest share of the global PC Gaming Accessories market, capturing 34.66% of revenue in 2025. Its leadership is supported by the rapid growth of competitive gaming and increasing controller adoption among PC gamers.
The 2025 Esports World Cup featured more than 2,000 professional players competing across 25 tournaments with a record US$70+ million prize pool. Popular controller-based games such as Street Fighter 6, Tekken 8, and Fortnite continue to drive demand for high-performance gaming controllers.
Valve’s Steam platform further highlights this trend. Since 2018, daily controller usage on Steam has increased from 5% to 15% of users, representing a threefold increase, while Xbox controllers accounted for 59% of all controller usage on the platform. In 2026, Valve reinforced this momentum by launching a new US$99 Steam Controller designed for both PC and Steam Deck users.
By Distribution Channel
Specialty Stores accounted for the largest share of the PC gaming accessories market, capturing 46.78% in 2025. Their leadership is driven by the nature of gaming peripherals, which are considered high-value purchases. Many buyers prefer to test keyboard switches, mouse sensor performance, headset comfort, and overall ergonomics before making a purchase.
The Online channel is projected to register the fastest CAGR during the forecast period. Growth is supported by the continued expansion of e-commerce and widespread internet connectivity. According to the U.S. Census Bureau, U.S. retail e-commerce sales increased 9.8% year-over-year in Q1 2026, with online sales accounting for 16.9% of total U.S. retail sales.
The International Telecommunication Union (ITU) reported in its 2025 Subscriptions Report that global mobile broadband subscriptions reached 99 subscriptions per 100 inhabitants, providing near-universal internet access. This expanding digital infrastructure enables consumers to easily browse, compare, and purchase PC gaming accessories online, including in emerging markets, supporting the rapid growth of the online distribution channel.
Key Market Segments
By Accessories
- Gaming Chairs
- Controllers
- Headsets and Audio Equipment
- Keyboards and Mouse
- Others
By Distribution Channel
- Specialty Stores
- Online
- Departmental Stores
- Others
Market Dynamics
Drivers
| Driver | (~) % Impact on CAGR | Geographic Relevance | Impact Timeline |
|---|---|---|---|
| Esports ecosystem expansion | +2.0% | North America, Europe, Asia Pacific | Short term (≤ 2 years) |
| High performance gaming PC installed base growth | +1.8% | Global | Medium term (2 to 4 years) |
| Emergence of streaming and creator hardware | +1.5% | Global urban markets | Short term (≤ 2 years) |
| Rising disposable incomes in emerging markets | +1.2% | Asia Pacific, Latin America, Middle East | Medium term (2 to 4 years) |
| Proliferation of competitive online PC titles | +1.0% | Global | Short term (≤ 2 years) |
| Adoption of RGB and customizable peripherals | +0.8% | Global | Medium term (2 to 4 years) |
Esports ecosystem expansion
Global esports audiences have risen into the hundreds of millions of viewers, with total audiences approaching about 500 million people by the mid 2020s, which structurally shifts demand toward competitive-grade PC gaming accessories rather than purely casual devices.
Tournament organizers, training facilities, and professional teams specify peripherals with very low click latency often below about 5 milliseconds and durability targets above roughly 50 million switch actuations, which increases annual replacement frequency per competitive user from around 1.0 device per category to roughly 1.5 to 2.0 devices and feeds through as an incremental contribution of about 2.0 percentage points to the baseline CAGR of 9.50% for PC gaming accessories.
This demand also enables business model shifts toward multi-year supply contracts and co-branded product lines, improving revenue visibility over roughly 3 to 5 year horizons and helping accessory vendors maintain gross margins in the mid 20 percent to low 30 percent range without relying solely on promotional discounting.
Restraints
| Restraint | (~) % Impact on CAGR | Geographic Relevance | Impact Timeline |
|---|---|---|---|
| Consumer budget squeeze from macro inflation | –1.7% | North America, Europe, emerging markets | Short term (≤ 2 years) |
| Import tariffs and electronics duties | –1.2% | United States, India, parts of Latin America | Short term (≤ 2 years) |
| Channel inventory overhang after pandemic demand spike | –1.0% | Global | Short term (≤ 2 years) |
| Competitive pull from console and mobile ecosystems | –0.9% | Global | Medium term (2 to 4 years) |
| Regulatory scrutiny on in-game monetization | –0.7% | Europe, Asia Pacific | Medium term (2 to 4 years) |
| High interest rates raising channel financing costs | –0.6% | Global | Short term (≤ 2 years) |
Consumer budget squeeze from macro inflation
Headline consumer price inflation in many developed and emerging economies has at times exceeded about 5 percent year on year in the early 2020s, which has eroded real disposable income and forced households to reprioritize discretionary categories such as mid- and high-end PC gaming accessories.
Because premium gaming mice and keyboards can cost about 1.5 to 2.5 times more than mainstream peripherals, even a gap of roughly 1 to 2 percentage points between wage growth and inflation can reduce volumes for optional accessories like extra macro pads or streaming microphones by around 10% to 20%, which corresponds to a restraint of approximately 1.7 percentage points on the achievable CAGR relative to the underlying demand.
To defend sell-through, brands and retailers increase promotional intensity and extend product lifecycles, sacrificing about 2 to 4 percentage points of gross margin and delaying capital spending on new tooling or logistics upgrades, which holds realized growth near the baseline CAGR of 9.50% rather than fully capturing the demand uplift implied by gaming and esports engagement metrics.
Challenges
| Challenge | (~) % CAGR | Geographic Relevance | Mitigation Horizon |
|---|---|---|---|
| Supply chain component concentration | –1.5% | Global | Medium term (2 to 4 years) |
| Rapid product obsolescence cycles | –1.3% | Global | Short term (≤ 2 years) |
| Environmental and e-waste constraints | –1.0% | Europe, developed Asia, North America | Long term (≥ 4 years) |
| Talent gaps in firmware and software integration | –0.9% | Global | Medium term (2 to 4 years) |
| Counterfeit and grey market peripherals | –0.8% | Emerging markets | Medium term (2 to 4 years) |
| Latency and compatibility issues with wireless devices | –0.7% | Global | Short term (≤ 2 years) |
Supply chain component concentration
PC gaming accessories depend on a concentrated supplier base for sensors, switches, wireless chipsets, and microcontrollers, with some component lines sourced predominantly from single regions or a small number of factories that together account for more than about 50% of global volume.
When disruptions occur in these hubs, lead times for finished peripherals can rise from typical levels of roughly 6 to 8 weeks to around 16 to 24 weeks, forcing brands either to carry buffer inventory equivalent to an extra 1 to 2 months of sales or to risk stockouts that can reduce quarterly revenue by mid single-digit percentages and drag on the maximum attainable CAGR by about 1.5% points.
Over the next roughly 2 to 4 years, manufacturers are pushed to diversify supplier portfolios, add nearshore capacity, and redesign bills of materials, which can add about 1 to 3% to unit costs but is necessary to protect service levels and maintain the baseline 9.50% growth in the face of continued geopolitical and logistics risk.
Opportunities
| Opportunity | (~) % CAGR | Geographic Relevance | Execution Window |
|---|---|---|---|
| AI-enhanced and sensor-rich peripherals | +2.2% | Global | Medium term (2 to 4 years) |
| Subscription-based software and analytics layers | +1.8% | Global | Medium term (2 to 4 years) |
| Ergonomic and health-focused accessories | +1.5% | North America, Europe, Asia Pacific | Long term (≥ 4 years) |
| Penetration into emerging market gaming cafes | +1.3% | Asia Pacific, Middle East, Latin America | Short term (≤ 2 years) |
| Cross-platform PC mobile accessory ecosystems | +1.1% | Global | Medium term (2 to 4 years) |
| Sustainability certified and repairable peripherals | +1.0% | Europe, developed Asia, North America | Long term (≥ 4 years) |
AI enhanced and sensor rich peripherals
Most PC gaming accessories in the market today still rely on static configuration and limited telemetry, so peripherals that integrate richer sensor suites together with on-device or host-based AI input optimization represent largely untapped white space rather than a fully activated driver.
By adding motion, pressure, and inertial sensors and pairing them with software that learns player patterns to adjust sensitivity curves and button actuation thresholds in real time, vendors can justify hardware price premiums of roughly 15 to 30%, while incremental bill of materials costs for additional sensors and processing are closer to about 5 to 10%, which creates scope to add about 3 to 5% points to blended gross margins when coupled with software subscriptions that can carry margins in excess of 60%.
If such devices reach even a moderate share of the installed PC gaming base over the next roughly 2 to 4 years, they could contribute an additional upside of around 2.2% points on top of the baseline CAGR of 9.50%, particularly through recurring revenue from analytics dashboards and coaching tools that turn accessories into ongoing service platforms rather than one-time purchases.
Geopolitical Impact Analysis
The PC gaming accessories market remains highly dependent on China for key components such as printed circuit boards (PCBs), semiconductors, passive electronic components, and plastic housings. As a result, ongoing U.S.-China trade tensions continue to increase manufacturing costs.
According to the U.S. Trade Representative (USTR), Section 301 tariffs on Chinese semiconductors increased from 25% to 50% on January 1, 2025, while the combined effective tariff on many Chinese electronics imports reached about 33% by May 2026 after including MFN, Section 301, and IEEPA tariffs.
PCBs imported from China also face 25%–30% duties, increasing production costs for gaming mice, keyboards, controllers, and headsets. In addition, the USTR’s December 2025 findings on China’s semiconductor policies indicate that trade restrictions may continue, encouraging manufacturers to shift production to countries such as Vietnam, Mexico, and Taiwan despite higher transition costs.
Logistics challenges are adding further pressure to the market. According to the International Transport Forum (OECD-ITF), Red Sea shipping disruptions increased average container delays from 5.1 days in November 2023 to 6.0 days by January 2024, while freight rates rose by approximately 80% as ships rerouted around the Cape of Good Hope, extending transit times by 10–14 days.
Regional Analysis
North America accounted for 35.21% of the global PC Gaming Accessories Market in 2025, supported by high consumer spending and a large gaming population. According to the U.S. Bureau of Economic Analysis (BEA), U.S. personal consumption expenditures (PCE) increased by US$91.0 billion (0.4%) in December 2025, highlighting strong consumer purchasing power.
The Entertainment Software Association (ESA) reported that 205.1 million Americans, or 67% of the U.S. population, play video games. This large gamer base, along with advanced broadband infrastructure and strong demand for premium gaming products, continues to drive sales of gaming mice, keyboards, headsets, and controllers.
Asia-Pacific is expected to remain the fastest-growing regional market, supported by rapid PC adoption and rising disposable incomes. According to IDC, the Asia-Pacific traditional PC market grew 11.6% in 2025, reaching 106.6 million units. Consumer notebook shipments increased 7.0%, while commercial laptop shipments rose 24.0%.
India recorded a historic 15.9 million PC shipments in 2025, up 10.2% year-over-year. Growing PC ownership across countries such as India, Indonesia, and Japan is expanding the installed base for gaming accessories, including mice, keyboards, headsets, and controllers. Rising middle-class incomes and continued digital adoption are expected to support long-term market growth across the region.
Key Regions and Countries
- North America
- The US
- Canada
- Europe
- Germany
- France
- The UK
- Spain
- Italy
- Russia & CIS
- Rest of Europe
- APAC
- China
- Japan
- South Korea
- India
- ASEAN
- Rest of APAC
- Latin America
- Brazil
- Mexico
- Rest of Latin America
- Middle East & Africa
- GCC
- South Africa
- Rest of MEA
Key Players Analysis
The PC gaming accessories market is led by a small group of global companies with strong brands, broad product portfolios, and extensive distribution networks. Logitech G remains the market leader, reporting US$1.414 billion in Gaming segment revenue in fiscal year 2026, up 6% from the previous year. Total company revenue reached US$4.84 billion, while R&D spending totaled US$316 million (around 6.5% of net sales), supporting innovation in AI-enabled peripherals, advanced sensors, and high-performance gaming devices.
The company also generated US$ 1.04 billion in operating cash flow and returned US$ 768 million to shareholders, highlighting its strong financial position. Corsair is another leading player, generating US$ 1.472 billion in revenue in 2025, with its Gamer and Creator Peripherals business contributing US$ 492 million at a 39.4% gross margin. HyperX, backed by HP Inc., benefits from HP’s global distribution network and US$ 55.3 billion annual revenue, strengthening its position in gaming headsets and keyboards.
Tier-2 companies continue to expand through product innovation and gaming-focused ecosystems. Turtle Beach reported US$ 319.9 million in revenue during 2025, while first-quarter 2025 revenue increased 14% year over year to US$ 63.9 million, supported by a 36.6% gross margin.
Razer remains a well-known premium gaming brand with peripherals revenue previously exceeding US$1.08 billion, supported by its strong presence in esports and gaming communities. Meanwhile, ASUS ROG and MSI strengthen their market position by offering integrated gaming ecosystems that combine PCs, monitors, motherboards, and peripherals, allowing them to deliver high-performance accessories with strong value for gamers.
The Major Players in the Industry
- Logitech G
- Razer Inc.
- Corsair
- SteelSeries
- HyperX
- Thrustmaster
- Turtle Beach
- ASUS
- Xbox
- Micro-Star INT’L CO., LTD
- Other Key Players
Key Development
- In January 2026, Razer announced a major expansion of its AI strategy. CEO Min-Liang Tan confirmed plans to invest more than US$600 million in artificial intelligence over the coming years and hire 150 AI scientists to build an AI-first gaming ecosystem.
- In September 2025, HP Inc. significantly expanded its HyperX gaming peripherals portfolio during its “Level Reforge” event in Los Angeles. The company introduced five new products. The launch represents HP’s largest HyperX product expansion since acquiring the brand for US$ 425 million in 2021 and further strengthens its integrated gaming ecosystem strategy alongside NVIDIA RTX 5090-powered Omen PCs.
- In September 2025, SteelSeries introduced the Arctis Nova Elite, the world’s first Hi-Res Wireless Certified gaming headset. The headset delivers 24-bit/96 kHz wireless audio over both 2.4 GHz and Bluetooth using the LC3+ codec.
Report Scope
| Report Features | Description |
|---|---|
| Market Value (2025) | USD 10.4 Billion |
| Forecast Revenue (2035) | USD 25.8 Billion |
| CAGR (2026-2035) | 9.5% |
| Base Year for Estimation | 2025 |
| Historic Period | 2020-2024 |
| Forecast Period | 2026-2035 |
| Report Coverage | Revenue Forecast, Market Dynamics, Competitive Landscape, Recent Developments |
| Segments Covered | Global PC Gaming Accessories Market By Accessories (Gaming Chairs, Controllers, Headsets and Audio Equipment, Keyboards and Mouse and Others) By Distribution Channel (Specialty Stores, Online, Departmental Stores and Others) |
| Regional Analysis | North America – The US & Canada; Europe – Germany, France, The UK, Spain, Italy, Russia & CIS, Rest of Europe; APAC- China, Japan, South Korea, India, ASEAN & Rest of APAC; Latin America- Brazil, Mexico & Rest of Latin America; Middle East & Africa- GCC, South Africa, & Rest of MEA |
| Competitive Landscape | Logitech G, Razer Inc., Corsair, SteelSeries, HyperX, Thrustmaster, Turtle Beach, ASUS, Xbox, Micro-Star INT’L CO., LTD and Other Key Players |
| Customization Scope | Customization for segments and region/country-level will be provided. Moreover, customization can be tailored to the requirements. |
| Purchase Options | We have three licenses to opt for: Single User License, Multi-User License (Up to 5 Users), Corporate Use License (Unlimited Users and Printable PDF) |





























