


Report Overview
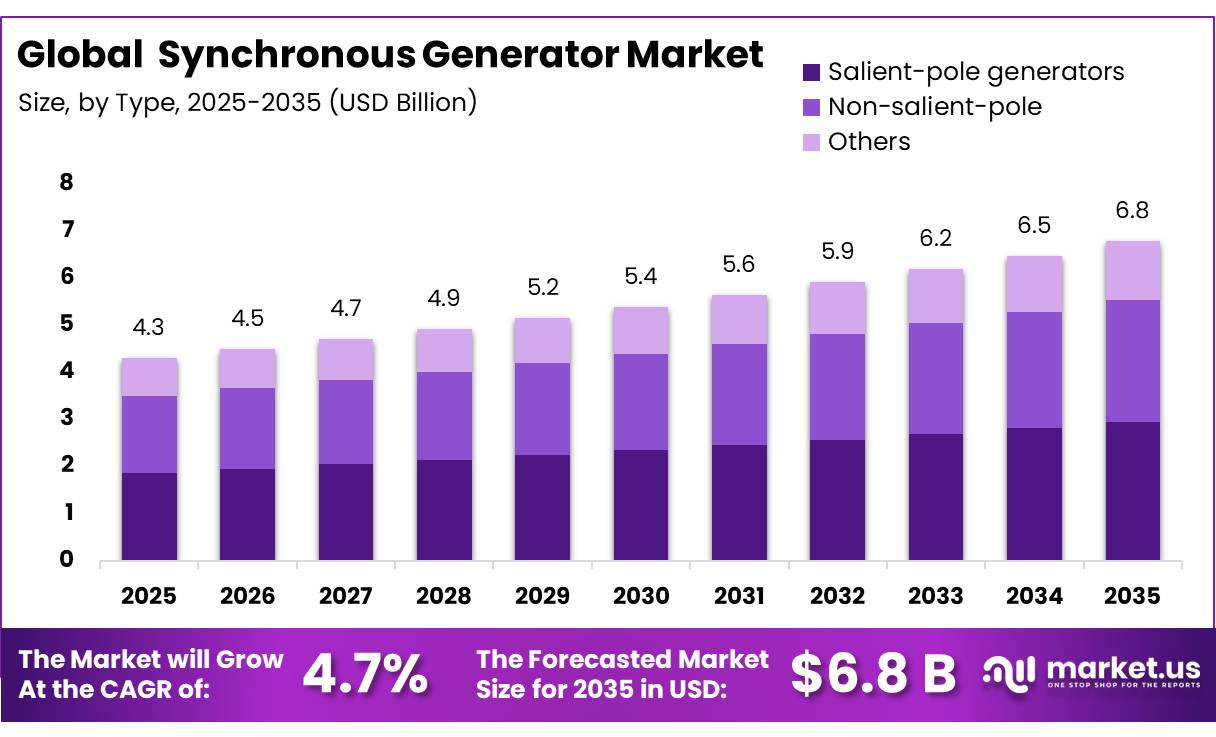
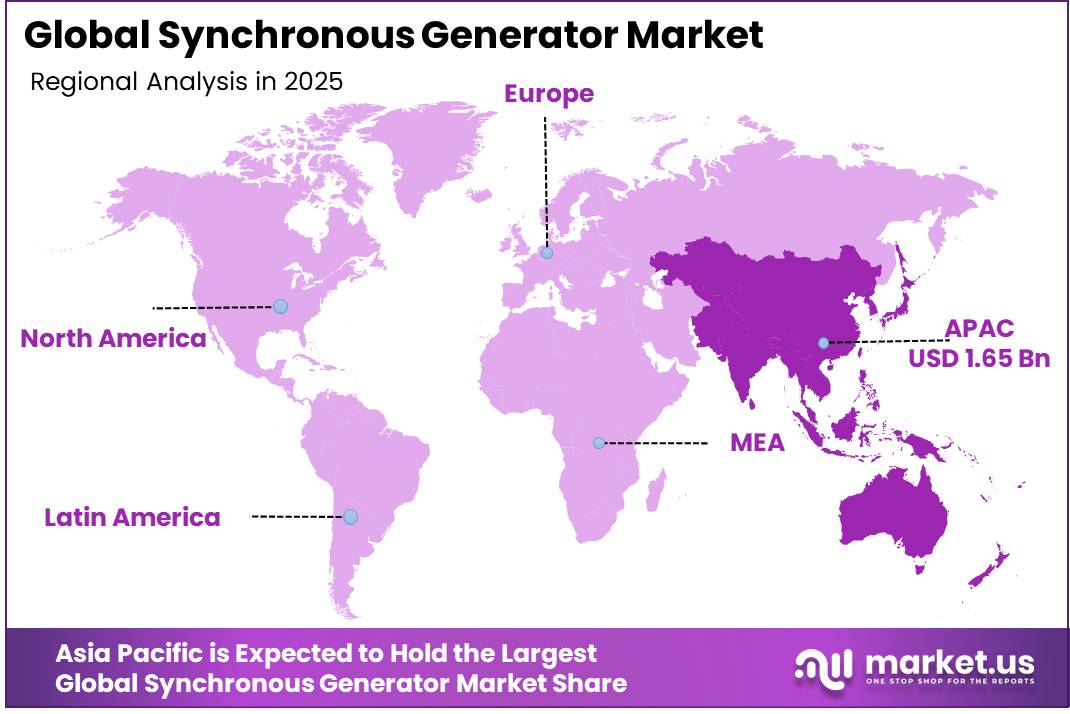
In 2025, the Global Synchronous Generator Market was valued at USD 4.3 billion, and between 2026 and 2035, this market is estimated to register a CAGR of 4.7%, reaching about USD 6.8 billion by 2035. Asia Pacific held a dominant market position, capturing more than a 38.4% share, holding USD 1.65 billion in revenue.
The synchronous generator industry supplies rotating machines that convert mechanical power from steam, gas, hydro and industrial prime movers into alternating current for utility grids and onsite systems. Demand is anchored in power plant construction, refurbishment and reliability upgrades. The International Energy Agency reported that global electricity demand grew around 3% in 2025, while emerging and developing economies represented 80% of the increase, sustaining requirements for dependable generation capacity, frequency control and replacement equipment worldwide.
- The International Renewable Energy Agency recorded 4,448 gigawatts of renewable capacity in 2024 after 585 gigawatts of additions, representing 5% of worldwide capacity expansion.
Key Takeaways
- The global synchronous generator market was valued at USD 4.3 billion in 2025.
- The global market is projected to grow at a CAGR of 4.7% and is estimated to reach USD 6.8 billion by 2035.
- On the basis of type, salient-pole generators dominated the market, constituting 43.5% of the total market share.
- Based on the prime mover, steam turbines dominated the synchronous generator market, with a substantial market share of around 35.0%.
- Based on the power rating, the 10–100 MW segment led the market, comprising 31.0% of the total market.
- Among the cooling methods, air-cooled generators held a major share in the synchronous generator market, accounting for 46.0% of the market share.
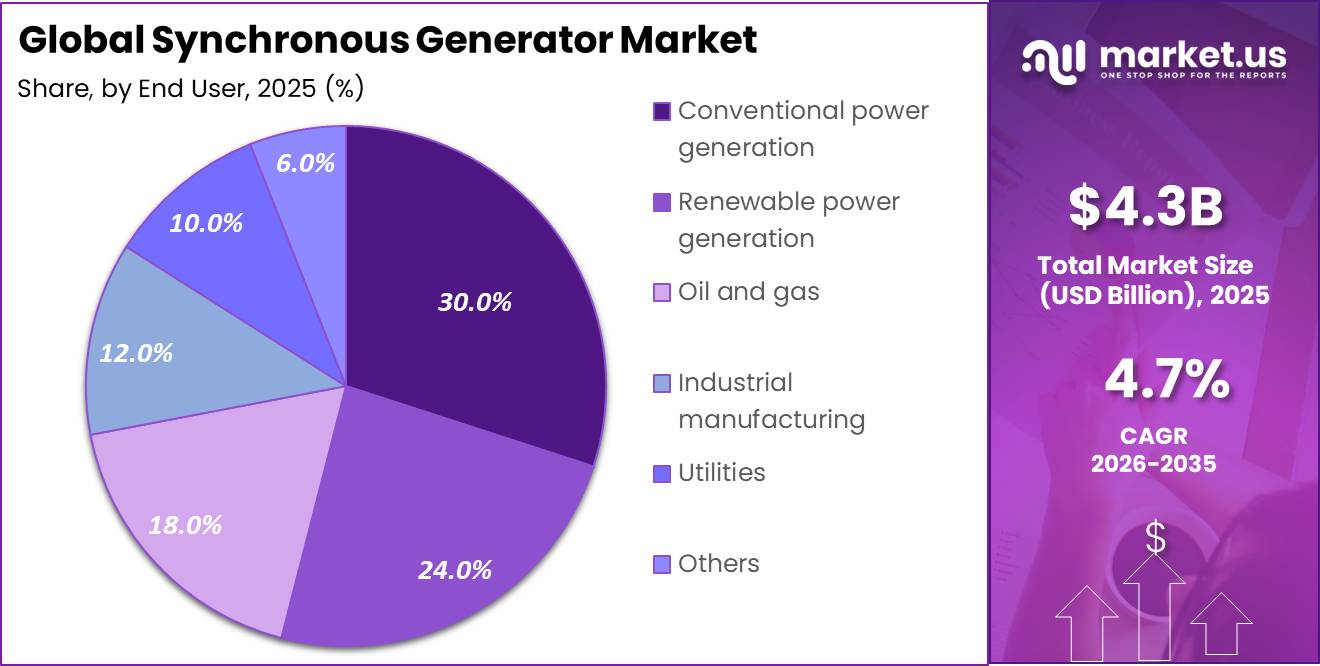
- Among the end users, conventional power generation was the most considerable segment within the market, accounting for around 30.0% of the revenue.
- In 2025, Asia-Pacific was the most dominant region in the synchronous generator market, accounting for 38.4% of the total market share.
This transition creates opportunities for hydroelectric generators and synchronous condensers. The National Renewable Energy Laboratory confirms that synchronous condensers provide mechanical inertia, voltage control and fault current, making them valuable where inverter based wind and solar resources reduce grid strength.
- The International Hydropower Association reported that global hydropower capacity reached 1,469 gigawatts in 2025 after 28 gigawatts were commissioned, including 11.7 gigawatts of pumped storage. Its development pipeline reached 1,127 gigawatts. These projects can stimulate demand for high efficiency generators, excitation equipment, advanced cooling systems, condition monitoring and refurbishment services across established and emerging power systems.
Government initiatives are reinforcing visibility. In April 2026, the United States Department of Energy announced the resumption of negotiations for nearly $430 million supporting 293 modernization projects at 212 hydropower facilities, encouraging generator upgrades and resilience improvements. In Europe, the revised Renewable Energy Directive sets a binding 42.5% renewable energy target for 2030, with an ambition of 45%. Such policies should expand procurement for synchronous generation, condenser conversions and equipment capable of stabilizing electricity networks.
Type Analysis
Salient-pole generators lead with a 43.50% share due to their suitability for low-speed power generation.
In 2025, Salient-pole generators held a dominant market position, capturing more than a 43.50% share. Their leadership was supported by extensive use in hydropower stations, diesel generating sets and other low-speed applications. The projecting-pole structure works effectively in large-diameter machines requiring several magnetic poles. Its established design, accessible components and reliable performance continued to support adoption across utility, renewable and industrial power projects.
- For instance, in August 2025, according to GE Vernova, the company announced an expansion of its Center of Excellence for steam and generator assembly and testing in Schenectady, strengthening its manufacturing capacity to meet rising demand for power-generation equipment.
Non-salient-pole/cylindrical-rotor generators are the growing segment. Their smooth and mechanically strong rotor construction supports high-speed operation with steam and gas turbines. Siemens Energy identifies cylindrical-rotor generators as suitable for gas, steam, oil and gas, and synchronous-condenser applications. Rising combined-cycle plant development, thermal-unit modernization and industrial power requirements are therefore supporting their adoption.
Prime Mover Analysis
Steam turbines lead with a 35.00% share because they support reliable large-scale generation.
In 2025, Steam turbines held a dominant market position, capturing more than a 35.00% share. Their position was supported by use in coal, nuclear, biomass and combined-cycle power stations. Steam turbines operate efficiently with large synchronous generators and remain suitable for baseload production. Their long service life, stable output and compatibility with high-capacity plants continued to support demand from utilities and power producers.
- For instance, in March 2025, according to GE Vernova, the company launched a mobile aeroderivative gas turbine designed to provide flexible electricity without requiring water, supporting faster deployment in remote areas and emergency power applications.
Gas turbines are the growing segment because they offer rapid start-up, flexible operation and easier integration with changing electricity demand. Their use is expanding in combined-cycle facilities, industrial power plants and grid-balancing projects. Gas turbine generators can respond quickly when wind and solar output changes, while systems also support lower-emission fuels. Growing electricity consumption, replacement of aging plants and demand for dependable backup capacity are strengthening their market prospects.
Power Rating Analysis
10–100 MW generators lead with a 31.00% share because they offer balanced capacity and operating flexibility.
In 2025, 10–100 MW held a dominant market position, capturing more than a 31.00% share. These generators suit utility plants, industrial power facilities, cogeneration systems and hydropower projects. Their capacity range supports stable electricity output without the footprint and investment requirements associated with high-rated units. Compatibility with steam, gas and hydro turbines helps operators select them for new installations, plant upgrades and replacement programs.
- For instance, in September 2025, according to the United Nations Industrial Development Organization and the International Hydropower Association, both organizations signed a joint declaration to advance small hydropower through knowledge exchange, policy support, innovation and financing initiatives.
Up to 1 MW is the growing segment. Compact synchronous generators are gaining attention for small hydropower plants, microgrids, farms, commercial buildings and remote industrial sites. Their lower installation complexity, localized electricity supply and suitability for backup or distributed generation support wider adoption. The United States Department of Energy notes that small and micro hydropower facilities can serve users, farms, villages or utilities.
By Cooling Method
Air-cooled generators lead with a 46.00% share because their simple design supports reliable and economical operation.
In 2025, Air-cooled held a dominant market position, capturing more than a 46.00% share. The segment benefited from straightforward installation, lower maintenance needs and the absence of complex gas-handling equipment. Air-cooled synchronous generators suit industrial plants, distributed generation facilities and flexible power projects where compact construction, dependable performance and easier servicing remain purchasing factors.
- For instance, in July 2025, according to GE Vernova, the first block of the Hsinta combined-cycle power plant began supplying electricity to the grid using gas and steam turbine equipment paired with hydrogen-cooled generators.
Hydrogen-cooled is the growing segment. Its low-density cooling medium supports efficient heat removal from high-capacity machines while reducing windage losses inside the generator. These characteristics make the technology suitable for large thermal and combined-cycle facilities operating under demanding loads. Continued construction of higher-output power plants, replacement of ageing generator fleets and greater attention to operating efficiency are encouraging adoption. However, the need for sealing, monitoring and safe hydrogen-handling systems keeps its use concentrated in generating stations.
End User Analysis
Conventional power generation leads with a 30.00% share because plants require stable electricity output.
In 2025, Conventional power generation held a dominant market position, capturing more than a 30.00% share. The segment remained supported by coal, gas, nuclear and combined-cycle facilities that rely on synchronous generators for continuous output. Their ability to provide voltage control, rotational inertia and performance makes them suitable for baseload plants, grid support and replacement projects. Utilities continue upgrading turbines, excitation systems and generator components to improve efficiency and reliability.
- For instance, in May 2025, according to the International Renewable Energy Agency, a collaborative framework meeting examined how power systems can modernize infrastructure, planning and operating practices to manage higher shares of variable renewable energy.
Renewable power generation is the growing segment. Hydropower, geothermal and bioenergy facilities use turbine-driven synchronous generators, while synchronous condensers can support wind and solar integration by supplying inertia, voltage control and fault current. Expansion of clean power projects, grid modernization and demand for flexible generation are encouraging installations and refurbishment work. These needs create opportunities for efficient machines and monitoring systems.
Key Market Segments
By Type
- Salient-pole generators
- Non-salient-pole/cylindrical-rotor generators
- Others
By Prime Mover
- Steam turbines
- Gas turbines
- Hydro turbines
- Others
By Power Rating
- Up to 1 MW
- 1–10 MW
- 10–100 MW
- Above 100 MW
By Cooling Method
- Air-cooled
- Hydrogen-cooled
- Water-cooled
- Oil-cooled
By End User
- Conventional power generation
- Renewable power generation
- Oil and gas
- Industrial manufacturing
- Utilities
- Others
Driver Analysis
Grid stability retrofits from inverter-heavy systems
As power systems absorb more wind, solar, battery, and power-electronics-based loads, operators are paying for inertia, short-circuit strength, and dynamic voltage support that inverter-dominant architectures do not always provide at the same system level, directly improving the addressable case for synchronous machines and synchronous-condenser-like deployments. The IEA states that more than 2,500 GW of renewable, storage, and large-load projects are stalled in grid queues worldwide, which is not just a transmission congestion signal but also a grid-quality signal, because interconnection studies increasingly test fault levels, stability margins, and reactive power capability before approvals are granted.
This driver is strongest in markets already deep into renewable penetration and grid-code tightening, including Europe, the UK, Texas, and Australia, where rotating equipment can monetize through ancillary services, grid connection compliance, or hybrid plant support structures. For CAGR math, a +1.4 percentage-point uplift is justified because the demand is not purely replacement-driven; it opens adjacent procurement categories such as condenser conversions, generator rewinds, excitation upgrades, and turnkey stability packages that expand revenue per project beyond the bare machine sale.
Drivers Impact Analysis
| Driver | (~) % Impact on CAGR | Geographic Relevance | Impact Timeline |
|---|---|---|---|
| Grid stability retrofits from inverter-heavy systems | +1.4% | EU core, UK, US, Australia, India | Short term |
| Utility capex to clear grid connection queues | +1.1% | North America core, EU, China, India, Middle East | Medium term |
| Data center and large-load power reliability demand | +0.9% | US, Nordics, Ireland, India, Southeast Asia | Short term |
| Hydro and thermal fleet refurbishment with efficiency uprates | +0.8% | Latin America, North America, Europe, South Asia | Medium term |
| Renewable expansion raising synchronous support requirements | +0.7% | China, India, EU, US, Australia | Medium term |
| Industrial and captive power modernization in weak-grid corridors | +0.6% | South Asia, Africa, Middle East, Southeast Asia | Long term |
Restraint Analysis
Power equipment supply chain volatility
Persistent logistics disruptions, volatile freight rates, and component bottlenecks across steel laminations, copper conductors, power electronics, and large forgings are elongating delivery lead times for synchronous generators from traditional 24–32 weeks to 40–60 weeks for many projects, forcing developers to reschedule commercial operation dates and defer revenue recognition.
In 2026, global trade commentary points to sustained pressure from re-routed shipping lanes, elevated bunker fuel prices, and tariff uncertainty, with some manufacturers reporting 10–20% cost swings in key inputs within a single budgeting cycle, eroding bid validity and increasing the likelihood that tenders are cancelled or re-scoped.
This volatility compresses margins as OEMs either absorb part of the cost inflation to honor fixed-price contracts or add contingencies that make their offers less competitive versus simpler solutions, directly subtracting roughly 1.3 percentage points from the otherwise achievable CAGR by pushing smaller utilities and industrial buyers to delay or downsize generator CapEx.
Restraint Impact Analysis
| Restraint | (~) % Impact on CAGR | Geographic Relevance | Impact Timeline |
|---|---|---|---|
| Power equipment supply chain volatility | -1.3% | North America core, EU, APAC corridors | Short term |
| Grid-code and regulatory uncertainty | -1.1% | India, EU, emerging Asia | Medium term |
| CAPEX discipline at utilities and IPPs | -1.0% | North America, EU, LatAm | Medium term |
| Competitive shift to inverter-based solutions | -0.9% | EU core, US, China | Long term |
| Industrial demand cyclicality and weak-grid risk | -0.8% | South Asia, Africa, Middle East | Medium term |
| Project development and permitting delays | -0.7% | EU, US, emerging markets | Long term |
Opportunity Analysis
Lifecycle services and performance contracts
This opportunity is not a current baseline driver because most synchronous generator OEMs still monetize predominantly through upfront equipment sales and relatively traditional maintenance contracts, leaving a large share of asset lifecycle economics uncaptured; by pivoting towards outcome-based performance contracts, remote monitoring, and digital twins, suppliers can transform generators into recurring-revenue platforms.
In practice, global installed synchronous generator capacity running into tens of millions of kVA across industrial, utility, and commercial segments suggests that only 20–30% of the fleet is under long-term, performance-linked agreements today, leaving potentially 70–80% of capacity accessible for new service offerings that could yield annuity-like margins in the 25–35% gross margin band versus low-teens on hardware.
If even 10–15% of the “uncontracted” fleet is converted to premium service packages over 3–5 years, this could add roughly 2–4% revenue uplift per installed base year across participating OEMs and integrators, translating into about 1.3 percentage points CAGR upside on top of baseline growth, especially in North America, Europe, and APAC industrial hubs where asset owners are increasingly comfortable with service-as-a-subscription models and remote condition monitoring.
Opportunity Impact Analysis
| Opportunity | (~) % Potential CAGR | Geographic Relevance | Execution Window |
|---|---|---|---|
| Lifecycle services and performance contracts | +1.3% | North America core, EU, APAC industrial hubs | Short term |
| Grid-support and ancillary services bundling | +1.1% | EU core, UK, US, Australia | Medium term |
| Hydrogen-ready and low-carbon fuel generators | +1.0% | EU, Japan, Korea, Middle East | Long term |
| Data center and digital infrastructure microgrids | +0.9% | US, Nordics, Ireland, India, SE Asia | Short term |
| Emerging-market utility and industrial consolidation | +0.8% | South Asia, Africa, ASEAN | Medium term |
| M&A-driven portfolio and channel integration | +0.7% | Global OEMs, regional specialists | Long term |
Challenges Analysis
Volatile metals and logistics costs
Volatility in copper, aluminum, and electrical steel prices, combined with episodic logistics disruptions, imposes ongoing friction on synchronous generator economics by destabilizing bill-of-materials baselines without completely freezing equipment orders, forcing OEMs into continuous hedging and pricing recalibration cycles; global power-equipment commentary indicates that copper and aluminum price swings exceeding 20% year-on-year are common, while shipping and freight rates can move by double-digit percentages within a quarter, introducing unpredictable variance in per-unit cost structures and tender profitability.
This forces manufacturers to increase safety margins in bids, shorten price-validity windows to 30–60 days, and negotiate escalation clauses, which collectively raise transaction complexity and can delay contract signature by months as buyers re-validate budgets, thereby dragging CAGR by around 1.2 percentage points relative to the technical demand potential; mitigation requires multi-year supplier diversification, inventory buffering strategies, and deeper commodity-risk management, which can take 2–4 years to normalize given the structural nature of global trade and energy-market volatility.
Challenges Impact Analysis
| Challenge | (~) % CAGR Friction | Geographic Relevance | Mitigation Horizon |
|---|---|---|---|
| Volatile metals and logistics costs | -1.2% | Global, APAC logistics corridors | Medium term |
| Complex grid integration engineering | -1.1% | EU regulatory hubs, India, US | Long term |
| Talent and skills shortage in rotating machinery | -1.0% | North America core, EU, APAC | Long term |
| Efficiency optimization and loss management | -0.9% | Global utilities, industrials | Medium term |
| Multi-vendor fleet complexity | -0.8% | Emerging markets, fragmented industrial bases | Long term |
| Infrastructure and manufacturing bottlenecks | -0.7% | Global, Asia manufacturing clusters | Medium term |
Geopolitical Impact Analysis
Geopolitical Realignment and Trade Barriers Reshaping Synchronous Generator Manufacturing
Geopolitical tensions are reshaping the synchronous generator market through metal supply concentration, tariff changes, localization and longer equipment qualification cycles. Generator manufacturing depends heavily on copper windings, electrical steel, forged components and cooling systems. The International Energy Agency reported that the three largest copper-refining countries controlled 59% of global output in 2024, exposing manufacturers to disruptions, trade restrictions and price volatility.
Copper availability is becoming a strategic issue for generator producers and utilities. In May 2025, the International Energy Agency estimated that announced mining projects could leave a 30% copper supply shortfall by 2035 under stated policies. Limited supply growth may increase procurement competition across generators, grids, renewable systems and data centres, encouraging longer-term contracts and qualification of recycled materials.
- In June 2025, the United States increased tariffs on imported steel and aluminium articles from 25% to 50%. Since generator frames, rotor assemblies, shafts and cooling structures use substantial metal inputs, higher duties can raise imported equipment costs, alter supplier selection and support regional manufacturing.
Europe is pursuing supply-chain independence through regulation. The European Union targets 40% processing and 25% recycling of strategic raw materials by 2030, while limiting reliance on any external country to 65%. These measures may strengthen sourcing for power equipment, but compliance, traceability and supplier qualification could extend delivery schedules.
Regional Analysis
Asia-Pacific dominates with a 38.40% share, supported by expanding electricity infrastructure.
In 2025, Asia-Pacific held the dominant position in the synchronous generator market, capturing more than a 38.40% share and generating approximately USD 1.65 billion in revenue. The region’s leadership reflects its large utility base, expanding industrial electricity use, hydropower development, thermal plant upgrades, and growing need for grid-stabilizing equipment.
- In April 2026, the International Renewable Energy Agency reported that Asia added 513.3 gigawatts of renewable capacity during 2025, representing 74.2% of worldwide additions, and reached 2,891 gigawatts of total renewable capacity. This expansion strengthens opportunities for hydro generators, synchronous condensers, excitation systems, and refurbishment services needed to maintain voltage and system stability.
The International Energy Agency also recorded 5.1% electricity-demand growth in China and around 3% growth across Southeast Asia during 2025. Continued electrification, manufacturing activity, data-centre construction, and cross-border grid development are expected to sustain regional demand for reliable synchronous generating equipment across utility and industrial projects over time.
Key Regions and Countries Covered
- North America
- The US
- Canada
- Europe
- Germany
- France
- The UK
- Spain
- Italy
- Russia & CIS
- Rest of Europe
- APAC
- China
- Japan
- South Korea
- India
- ASEAN
- Rest of APAC
- Latin America
- Brazil
- Mexico
- Rest of Latin America
- Middle East & Africa
- GCC
- South Africa
- Rest of MEA
Key Players Analysis
Synchronous generator manufacturers focus on improving power efficiency, operational reliability, cooling performance, and product customization to strengthen their competitive position. Leading companies such as Siemens Energy AG, GE Vernova, ABB Ltd., ANDRITZ AG, and Mitsubishi Electric Corporation maintain their presence through broad generator portfolios, established service networks, and long-term relationships with utilities and industrial customers.
Manufacturers also invest in localized production, automation, predictive maintenance, and refurbishment services to reduce delivery times and extend equipment life. Companies such as WEG S.A., Toshiba Energy Systems & Solutions Corporation, Nidec Corporation, and TMEIC Corporation strengthen their positioning by serving regional power projects and specialized industrial requirements.
Market Key Players
- ABB Ltd.
- Siemens Energy AG
- GE Vernova
- WEG S.A.
- ANDRITZ AG
- Mitsubishi Electric Corporation
- Toshiba Energy Systems & Solutions Corporation
- Meidensha Corporation
- Nidec Corporation
- TMEIC Corporation
- Ingeteam, S.A.
- CG Power and Industrial Solutions Limited
- Marelli Motori S.p.A.
- Jeumont Electric
- Ansaldo Energia S.p.A.
Key Development
- In March 2025, ANDRITZ AG received an order from BC Hydro to supply four 60 megavolt-ampere generators for the Bridge River 1 hydropower plant, increasing its installed generator capacity by 15%.
- In April 2025, WEG S.A. announced the supply of three 7,788 kilovolt-ampere generators, three hydraulic turbines, transformers, electrical panels, and substation equipment for the Paredinha Hydropower Plant in Brazil.
Report Scope
| Report Features | Description |
|---|---|
| Market Value (2025) | USD 4.3 Bn |
| Forecast Revenue (2035) | USD 6.8 Bn |
| CAGR (2026-2035) | 4.7% |
| Base Year for Estimation | 2025 |
| Historic Period | 2020-2024 |
| Forecast Period | 2026-2035 |
| Report Coverage | Revenue Forecast, Market Dynamics, Competitive Landscape, Recent Developments |
| Segments Covered | By Type (Salient-Pole Generators, Non-Salient-Pole/Cylindrical-Rotor Generators, and Others), By Prime Mover (Steam Turbines, Gas Turbines, Hydro Turbines, and Others), By Power Rating (Up to 1 MW, 1–10 MW, 10–100 MW, and Above 100 MW), By Cooling Method (Air-Cooled, Hydrogen-Cooled, Water-Cooled, and Oil-Cooled), By End User (Conventional Power Generation, Renewable Power Generation, Oil and Gas, Industrial Manufacturing, Utilities, and Others) |
| Regional Analysis | North America – The US & Canada; Europe – Germany, France, The UK, Spain, Italy, Russia & CIS, Rest of Europe; APAC– China, Japan, South Korea, India, ASEAN & Rest of APAC; Latin America– Brazil, Mexico & Rest of Latin America; Middle East & Africa– GCC, South Africa, & Rest of MEA |
| Competitive Landscape | ABB Ltd., Siemens Energy AG, GE Vernova, WEG S.A., ANDRITZ AG, Mitsubishi Electric Corporation, Toshiba Energy Systems & Solutions Corporation, Meidensha Corporation, Nidec Corporation, TMEIC Corporation, Ingeteam, S.A., CG Power and Industrial Solutions Limited, Marelli Motori S.p.A., Jeumont Electric, and Ansaldo Energia S.p.A. |
| Customization Scope | Customization for segments, region/country-level will be provided. Moreover, additional customization can be done based on the requirements. |
| Purchase Options | We have three licenses to opt for: Single User License, Multi-User License (Up to 5 Users), Corporate Use License (Unlimited Users and Printable PDF) |





































