


Report Overview
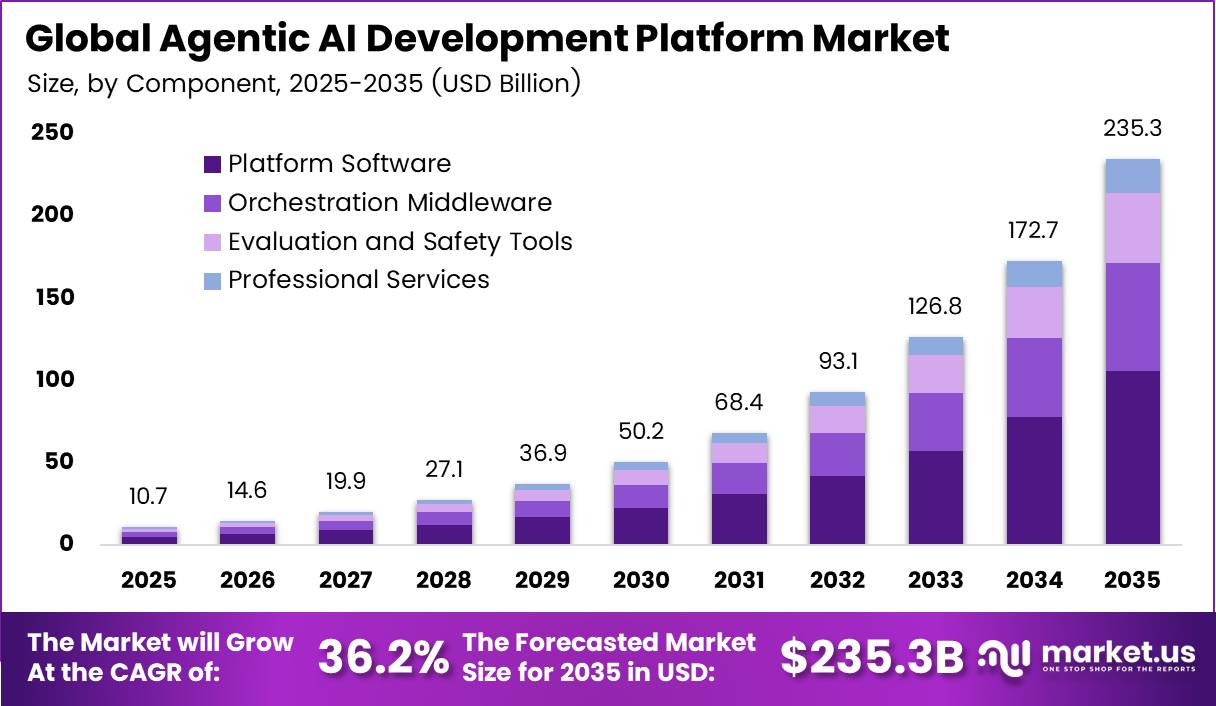
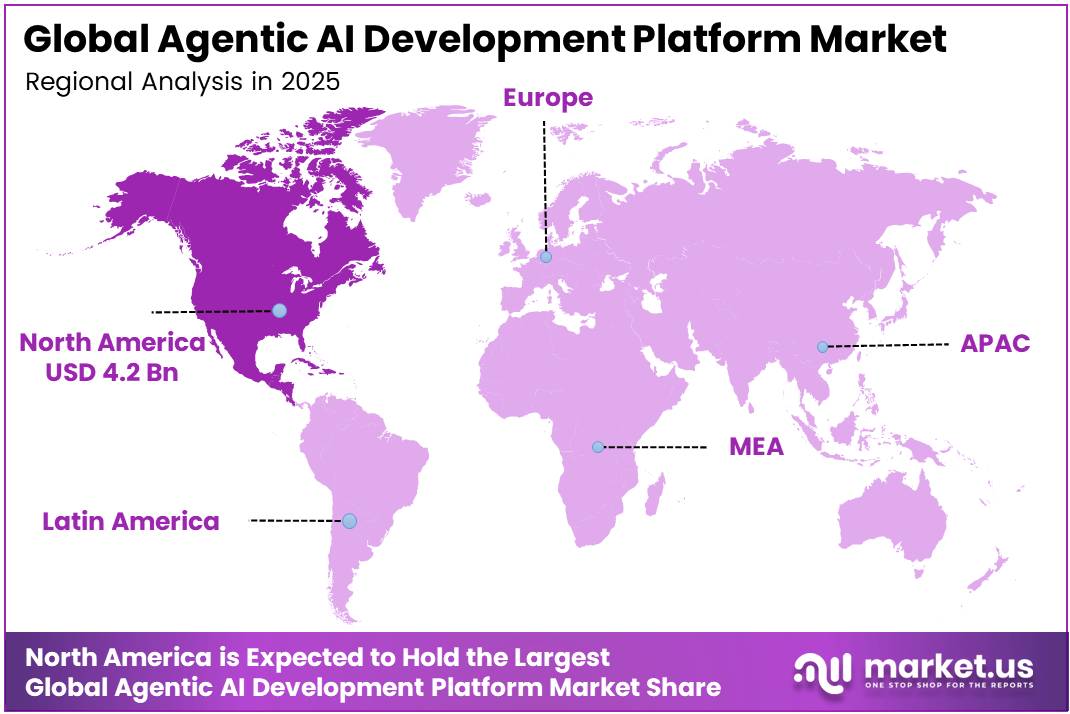
In 2025, the Global Agentic AI Development Platform Market was valued at USD 10.7 billion. The market is projected to grow at a CAGR of 36.2% during 2026–2035, reaching approximately USD 235.3 billion by 2035. North America dominated the global market in 2025, accounting for more than 38.8% of the total market share and generating approximately USD 4.2 billion in revenue.
Faster AI use in business drives this growth. The OECD reported that 20.2% of firms in its member countries used AI in 2025, up from 14.2% in 2024 and 8.7% in 2023, so adoption more than doubled in two years. In 2024, 40% of firms with 250 or more workers used AI, compared with only 11.9% of firms with 10 to 49 workers.
Large firms now want AI agents that finish whole workflows, not just chat tools, and smaller firms form the next wave of buyers. This shift creates strong demand for platforms that build, connect, test and govern AI agents. The region has the computing base that agentic platforms need.
The IEA estimates that the United States used about 45% of global data centre electricity in 2024, while China used about 25% and Europe about 15%. The IEA also expects US data centre power use to grow by about 240 TWh by 2030, a 130% rise from 2024, with global data centre demand reaching about 945 TWh by 2030. This deep cloud and compute capacity lets US vendors train models and run agents at scale for local buyers.
Key Takeaways
- The Global Agentic AI Development Platform Market was valued at USD 10.7 billion in 2025 and should reach USD 235.3 billion by 2035. at a 36.2% CAGR from 2026 to 2035.
- By component, Platform Software led with a 76.6% share in 2025.
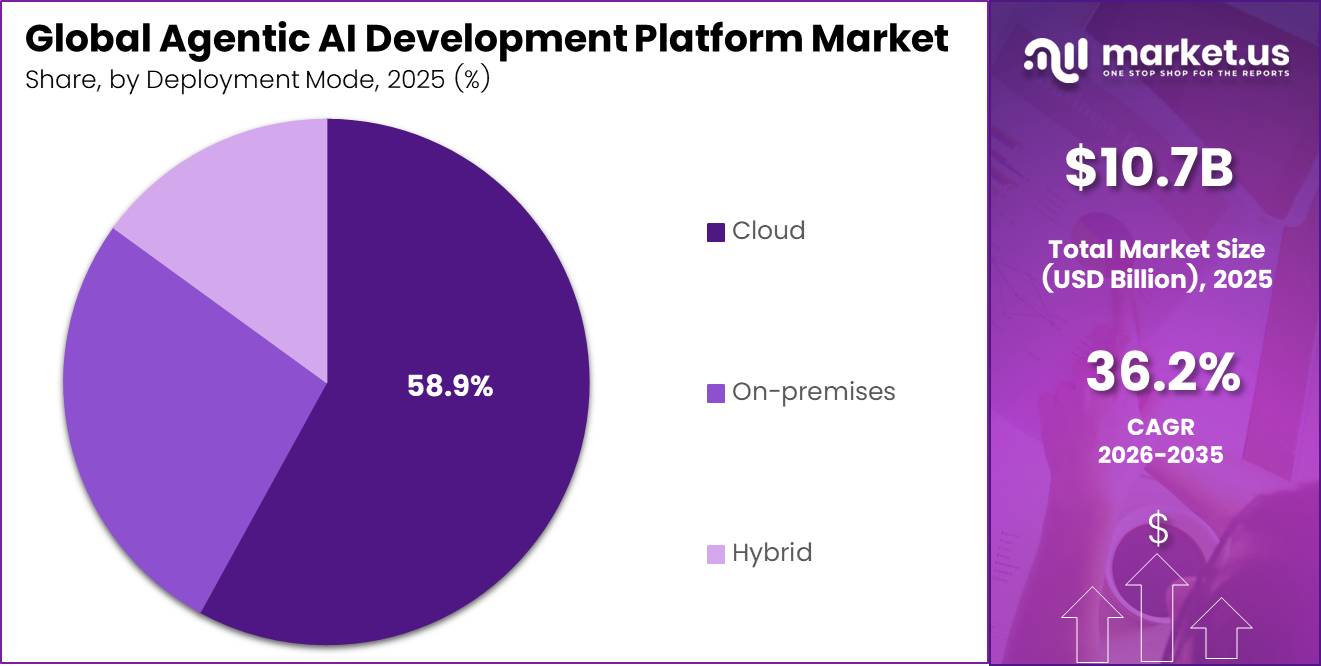
- By deployment mode, Cloud led with a 58.9% share in 2025.
- By end-user industry, BFSI led with a 72.5% share in 2025.
- North America led the market with a 38.8% share and USD 4.2 billion in revenue in 2025.
By Component
Platform Software dominates with 76.6% due to reusable agent building and deployment capabilities.
Platform Software leads because enterprises need one core environment to build, test, deploy, manage, and improve AI agents across many business teams. A common platform connects models, enterprise data, security controls, user access, and workflow tools, which reduces the need for separate point products.
Salesforce reported $37.9 billion in fiscal 2025 revenue, with subscription and support representing about 94% of total revenue, showing why recurring platform software remains the main commercial model for enterprise AI delivery.
Professional Services grows fastest because firms need expert help to move from small pilots to reliable business use. Teams must map workflows, clean data, connect older systems, set rules for human review, and measure outcomes. C3 AI reported that professional services represented 16% of revenue in fiscal 2025, versus 9% in fiscal 2026, which shows that implementation work can shift sharply during active deployment phases.
By Deployment Mode
Cloud dominates with 58.9% due to rapid, scalable access to AI resources.
Cloud leads because it gives enterprises fast access to computing power, model services, updates, and shared development tools without requiring large upfront hardware purchases. It also helps teams launch agent pilots across many sites, add users quickly, and connect with software already used for customer service, sales, and business operations.
Manhattan Associates increased cloud revenue from $337.2 million in 2024 to $408.1 million in 2025, a 21% rise, which shows strong buyer preference for subscription-based access to advanced business software. Hybrid deployment grows fastest because many organizations want cloud flexibility but cannot move every data set or core process outside their own environment.
This matters most where firms handle customer records, regulated data, production systems, or low-latency workloads. IBM reports that 86% of executives use hybrid cloud architectures to deploy AI, reflecting the need to run models, data, and controls across public cloud, private cloud, on-site systems, and edge locations.
By End User Industry
BFSI dominates with 72.5% due to high-volume regulated decision and service workflows.
BFSI leads because banks, insurers, payment firms, and financial service providers manage large volumes of repeatable, time-sensitive work that AI agents can support. Customer questions, fraud checks, onboarding, identity verification, claims handling, payment monitoring, and compliance reviews all create clear cases for automation with human oversight.
Retail and E-Commerce grows fastest because retailers face constant pressure to improve product discovery, order support, returns, merchandising and customer service while controlling operating costs. Salesforce found that 75% of retailers believe AI agents will be essential to compete within one year, and 76% plan to increase AI investment over the next year.
Key Market Segments
By Component
- Platform Software
- Professional Services
- Orchestration Middleware
- Evaluation and Safety Tools
By Deployment Mode
- Hybrid
- Cloud
- On-premises
By End User Industry
- BFSI
- Healthcare and Life Sciences
- Retail and E-Commerce
- Manufacturing
- Media and Entertainment
- Government and Public Sector
- Other
Geopolitical Impact Analysis
Trade tensions and conflict now shape the cost of the hardware that agentic AI platforms run on. Most agent platforms are software, but they depend on chips, servers, and network gear that cross many borders. The WTO reported that trade in AI-enabling goods rose 21.9% in 2025, from USD 3.43 trillion to USD 4.18 trillion. These goods made up 42% of global trade growth while holding only one sixth of total trade.
The WTO noted that chips, semiconductors and data transmission equipment escaped most new tariffs, which shielded GPU and server costs for platform vendors. Higher tariffs that took effect in August 2025 still hit related goods and services. In October 2025, the WTO cut its 2026 merchandise trade volume forecast to 0.5%, down from 1.8%.
In March 2026, the WTO set a baseline forecast of 1.9% trade volume growth for 2026. It warned that the Middle East war could cut 0.5 percentage points from that growth if energy prices stay high. Tension around the Strait of Hormuz raises power and transport costs for data centres that host agent workloads.
AI demand still offsets much of this pressure. The value of AI-enabling goods trade rose more than 40% year on year in the first quarter of 2026, while office and telecom equipment trade rose 44% in the same quarter. For buyers, this means cloud compute stays available. Vendors with exposure to energy prices and tariffs on non-exempt hardware carry the higher costs, which they may pass on to customers.
Regional Analysis
North America Leads on Compute and Enterprise Spend
North America dominates the Agentic AI Development Platform Market, holding a 38.8% share and generating USD 4.2 billion in revenue. The US hosts most of the model builders and platform vendors, including OpenAI, Anthropic, ServiceNow, IBM, Oracle and UiPath, so local buyers get early access to new agent tools, deep partner networks and strong support teams.
The region’s power base supports this lead. The IEA reports that natural gas supplies over 40% of US data centre electricity, while renewables supply 24%, nuclear about 20% and coal about 15%. The IEA expects natural gas to add over 130 TWh of yearly power for US data centres by 2030, with renewables adding another 110 TWh.
Asia Pacific is the fastest-growing region in the Agentic AI Development Platform Market. China leads regional compute growth, and the IEA expects Chinese data centre power use to rise by about 175 TWh by 2030, a 170% increase from 2024. Japan and South Korea push agent use in manufacturing and electronics, India supplies large engineering teams and a fast-growing base of service firms, and Australia and Singapore lead adoption in banking.
Key Regions and Countries
North America
- US
- Canada
Europe
- Germany
- France
- The UK
- Spain
- Italy
- Rest of Europe
Asia Pacific
- China
- Japan
- South Korea
- India
- Australia
- Rest of APAC
Latin America
- Brazil
- Mexico
- Rest of Latin America
Middle East and Africa
- GCC
- South Africa
- Rest of MEA
Market Dynamics
Drivers
| Driver | (~) % Impact on CAGR Forecast | Geographic Relevance | Impact Timeline |
|---|---|---|---|
| Enterprise workflow automation demand | +4.2% | North America, Europe, East Asia, India | Short term (2 years or less) |
| Agent-enabled software development | +3.1% | Global software-intensive economies | Short term (2 years or less) |
| Cloud-native model deployment | +2.5% | North America, Europe, Asia-Pacific | Medium term (2 to 4 years) |
| API and tool ecosystem expansion | +2.0% | Global | Short term (2 years or less) |
| Governed enterprise AI procurement | +1.7% | Europe, North America, Japan, Singapore | Medium term (2 to 4 years) |
| Multimodal automation adoption | +1.5% | Global | Medium term (2 to 4 years) |
Enterprise workflow automation demand
Enterprise demand for workflow automation is shifting agentic AI development platforms from experimental model-access tooling toward recurring, governed orchestration layers that connect models with enterprise applications, knowledge repositories, approval chains, and auditable tool calls.
The resulting shift supports an estimated +4.2% incremental contribution to the stated 36.2% baseline CAGR, as buyers consolidate fragmented automation pilots into governed platform commitments, reduce duplicated integration work, and redirect software budgets from bespoke implementation toward reusable agent templates and consumption-based operating models.
Restraints
| Restraint | (~) % Impact on CAGR Forecast | Geographic Relevance | Impact Timeline |
|---|---|---|---|
| Unclear liability for autonomous actions | -3.6% | Europe, North America, regulated global sectors | Short term (2 years or less) |
| Restricted data-use permissions | -2.8% | Europe, North America, India, Asia-Pacific | Short term (2 years or less) |
| Procurement approval freezes | -2.2% | Banking, healthcare, public sector, critical infrastructure | Short term (2 years or less) |
| Inference-cost budget constraints | -1.9% | Global | Medium term (2 to 4 years) |
| Cross-border data localization | -1.6% | Europe, India, Middle East, Southeast Asia | Medium term (2 to 4 years) |
| High-risk deployment prohibitions | -1.3% | European Union and aligned jurisdictions | Short term (2 years or less) |
Unclear liability for autonomous actions
Liability uncertainty becomes an immediate sales restraint when a platform enables an agent to transact, alter records, communicate externally, or initiate operational actions without a settled allocation of responsibility among the deploying enterprise, platform provider, model provider, systems integrator and downstream tool owner.
Consequently, the estimated -3.6% CAGR deduction mainly appears through delayed enterprise approvals, higher contract-negotiation expense, and expanded indemnity demands. Margins also compress from required audit logs, human override controls, insurance, and jurisdiction-specific compliance support.
Challenges
| Challenge | (~) % CAGR Friction Drag | Geographic Relevance | Mitigation Horizon |
|---|---|---|---|
| Reliable Agent Evaluation | -3.4% | Global | Medium term (2 to 4 years) |
| Compute Capacity Volatility | -2.7% | North America, Europe, East Asia | Medium term (2 to 4 years) |
| Fragmented Tool Interfaces | -2.3% | Global | Medium term (2 to 4 years) |
| Security Control Complexity | -2.1% | Global regulated sectors | Short term (2 years or less) |
| Specialist Talent Scarcity | -1.8% | North America, Europe, India, East Asia | Long term (4 years or more) |
| Power and Grid Bottlenecks | -1.5% | North America, Europe, East Asia | Long term (4 years or more) |
Reliable Agent Evaluation
Reliable agent evaluation is the central operational challenge because autonomous systems must be assessed not only for response quality but also for multi-step planning, tool selection, permissions handling, state retention, policy compliance, recovery from failed actions, and behavior under changing enterprise data.
The estimated -3.4% drag reflects longer implementation cycles, larger quality-assurance teams, higher cloud-testing and observability consumption, and conservative limits on agent autonomy until enterprises develop repeatable evidence that actions meet reliability thresholds.
Opportunities
| Opportunity | (~) % Potential CAGR Upside | Geographic Relevance | Execution Window |
|---|---|---|---|
| Vertical agent operating systems | +4.5% | North America, Europe, India, East Asia | Medium term (2 to 4 years) |
| Outcome-based automation pricing | +3.2% | Global | Medium term (2 to 4 years) |
| On-premises regulated deployments | +2.8% | Europe, North America, Middle East, India | Medium term (2 to 4 years) |
| Agent marketplace revenue sharing | +2.3% | Global software ecosystems | Long term (4 years or more) |
| Cross-platform agent observability | +2.0% | Global | Short term (2 years or less) |
| Industry-specific compliance templates | +1.7% | Europe, North America, Japan, Singapore | Medium term (2 to 4 years) |
Vertical agent operating systems
Vertical agent operating systems remain untapped rather than a current baseline driver because most production activity still concentrates on horizontal developer tooling, general-purpose workflow orchestration and broad enterprise copilots.
Capturing industry-specific white space requires deliberate creation of domain data connectors for healthcare, manufacturing, logistics, and public administration. The estimated +4.5% upside arises if platforms turn one-off services work into repeatable sector modules.
A credible 20% to 35% reduction in workflow configuration and validation effort per additional deployment can improve implementation gross margins, while packaged controls can shift unit economics from labor-heavy customization toward recurring platform, usage, and assurance revenue.
Key Players Analysis
Tier 1 market leaders combine model access, enterprise reach, and large budgets. IBM posted 2025 software revenue of USD 29.96 billion, up 10.6% as reported, and software now makes up about 45% of its total revenue. IBM raised R&D spending by 11.2% to USD 8.32 billion in 2025, closed 10 acquisitions that year, and reached software annual recurring revenue of USD 23.6 billion.
Accenture leads on services. In fiscal 2025, it tripled its advanced AI revenue, which covers generative, agentic, and physical AI, to USD 2.7 billion, while its generative AI bookings nearly doubled to USD 5.9 billion. These results follow a USD 3 billion multi-year AI investment that Accenture committed two years earlier. OpenAI, Anthropic, ServiceNow, Oracle and SAP complete this tier through their model and platform scale.
Tier 2 challengers win through focus on a single industry or a narrow service. UiPath bought Manchester-based Peak in March 2025 to launch its first agents built for specific industries, starting with retail and manufacturing pricing and inventory. Cognizant competes on large delivery teams for agent rollouts.
Neurons Lab focuses only on financial services. It has completed more than 100 implementations since 2019 with over 50 experts across Europe, which suits the BFSI segment that holds a 72.5% share. BotsCrew and Winder.AI build custom agents and machine learning systems for mid-sized buyers.
Top Key Players in the Market
- Neurons Lab
- BotsCrew
- Winder.AI
- OpenAI, L.L.C.
- Anthropic PBC
- Cognizant
- ServiceNow, Inc.
- International Business Machines Corporation
- Oracle Corporation
- SAP SE
- UiPath, Inc.
- Accenture
Recent Developments
- In February 2025, IBM completed its USD 6.4 billion acquisition of HashiCorp to strengthen hybrid cloud automation for AI workloads. ServiceNow signed a deal to acquire Moveworks for USD 2.85 billion in cash and stock to add an AI assistant and enterprise search to its agentic AI platform.
- In December 2025, ServiceNow completed its USD 2.85 billion acquisition of Moveworks and added Moveworks’ agentic Reasoning Engine to the ServiceNow AI Platform. Anthropic closed a USD 41.29 billion Series H-1 round at an estimated USD 965 billion valuation.
Report Scope
| Report Features | Description |
|---|---|
| Market Value (2025) | USD 10.7 Billion |
| Forecast Revenue (2035) | USD 235.3 Billion |
| CAGR (2026-2035) | 36.2% |
| Base Year for Estimation | 2025 |
| Historic Period | 2020-2024 |
| Forecast Period | 2026-2035 |
| Report Coverage | Revenue Forecast, Market Dynamics, Competitive Landscape, Recent Developments |
| Segments Covered | By Component (Platform Software, Professional Services, Orchestration Middleware, Evaluation and Safety Tools); By Deployment Mode (Hybrid, Cloud, On-premises); By End User Industry (BFSI, Healthcare and Life Sciences, Retail and E-Commerce, Manufacturing, Media and Entertainment, Government and Public Sector, Other) |
| Regional Analysis | North America: US, Canada; Europe: Germany, France, The UK, Spain, Italy, Rest of Europe; Asia Pacific: China, Japan, South Korea, India, Australia, Singapore, Rest of APAC; Latin America: Brazil, Mexico, Rest of Latin America; Middle East & Africa: GCC, South Africa, Rest of MEA |
| Competitive Landscape | Neurons Lab, BotsCrew, Winder.AI, OpenAI, L.L.C., Anthropic PBC, Cognizant, ServiceNow, Inc., International Business Machines Corporation, Oracle Corporation, SAP SE, UiPath, Inc., Accenture |
| Customization Scope | Customization for segments, region/country-level will be provided. Moreover, additional customization can be done based on the requirements. |
| Purchase Options | We have three licenses to opt for: Single User License, Multi-User License (Up to 5 Users), Corporate Use License (Unlimited Users and Printable PDF) |





























