


Report Overview
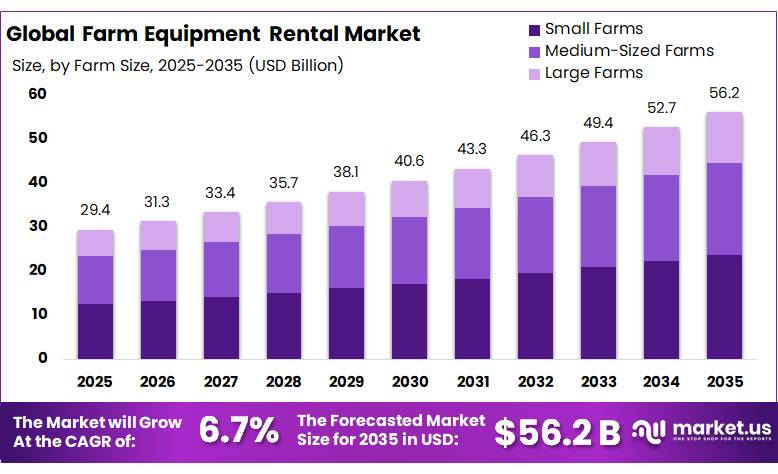
The Global Farm Equipment Rental Market size is expected to be worth around USD 56.2 Billion by 2035, from USD 29.4 Billion in 2025, growing at a CAGR of 6.7% during the forecast period from 2026 to 2035. In 2025, Asia Pacific held a dominant market position, capturing more than a 35.60% share, holding USD 10.46 Billion revenue.
The farm equipment rental industry is becoming an important part of agricultural mechanization as farmers seek access to tractors, harvesters, tillage machinery, sprayers, and precision equipment without carrying the full cost of ownership. Rental and custom-hire models allow machinery costs to be spread across several users while improving asset utilization. The need for flexible equipment access is especially relevant as machinery becomes more advanced and expensive.
- In the United States, farmers spent USD 21.0 billion on tractors and self-propelled machinery and another USD 8.3 billion on other farm machinery in 2024, according to USDA.
The industry’s operating environment is closely linked with farm profitability and capital-spending conditions. USDA reported total U.S. farm production expenditures of USD 477.6 billion in 2024, while farm services represented USD 55.3 billion, or 11.6% of total expenditure. Although total production expenses were forecast to decline to USD 450.4 billion in 2025, they were expected to remain above the long-term average.
Farm structure also creates a strong base for equipment-sharing services. USDA reported 115,030 U.S. farms with annual sales of USD 1 million or more in 2025, operating about 314.43 million acres, with an average size of 2,733 acres in this sales category. Large farms require high-capacity machinery during narrow planting and harvesting periods, while smaller operations often cannot economically justify owning every machine. This creates opportunities for rental fleets, dealerships, cooperatives, and specialized custom operators.
- Government-supported mechanization and modernization programmes also improve the long-term environment. Under the EU Common Agricultural Policy strategic plans, more than EUR 31 billion of public expenditure is planned for agricultural investments, representing an average 10% of total strategic-plan public expenditure, while an additional EUR 6.7 billion of national financing has been committed by participating countries. The European Commission also expects around 400,000 farms to benefit from investments that modernize infrastructure and agricultural practices.
Current machinery sales further underline the potential for rental alternatives. The Association of Equipment Manufacturers reported that U.S. agricultural tractor sales declined 8% year over year in August 2026, while combine sales fell 4%. Earlier, U.S. tractor sales had fallen 21.6% in May 2026, with combine sales down 56.1%. Weak new-equipment purchasing can encourage farmers to extend replacement cycles and use rented machinery when temporary capacity or specialized technology is required.
Key Takeaways
- Farm Equipment Rental Market size is expected to be worth around USD 56.2 Billion by 2035, from USD 29.4 Billion in 2025, growing at a CAGR of 6.7%.
- Tractors held a dominant market position, capturing more than a 38.50% share.
- 71–130 HP held a dominant market position, capturing more than a 31.30% share.
- Four-Wheel Drive held a dominant market position, capturing more than a 55.10%.
- Small Farms held a dominant market position, capturing more than a 42.30% share.
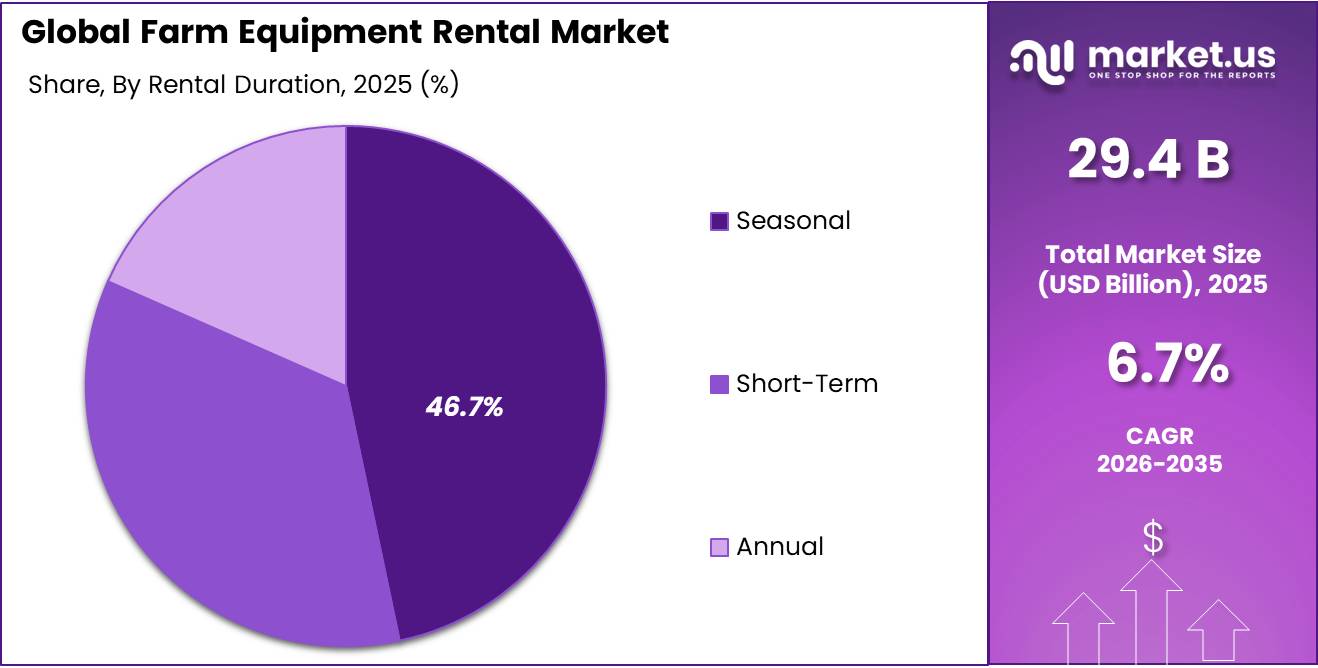
- Seasonal held a dominant market position, capturing more than a 46.00% share.
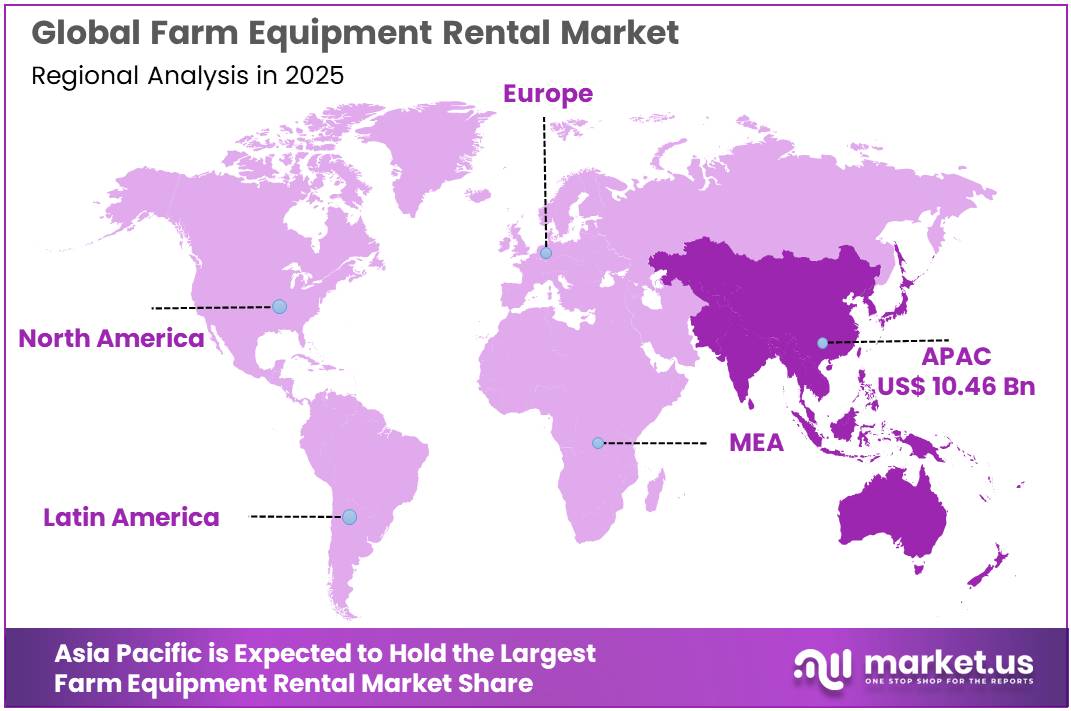
- Asia Pacific held the dominant position in 2025, capturing more than a 35.60% share and reaching USD 10.46 billion.
By Equipment Type Analysis
Tractors Dominate Farm Equipment Rental Market with 38.50% Share, Supported by Broad On-Farm Machinery Demand
In 2025, Tractors held a dominant market position, capturing more than a 38.50% share of the Farm Equipment Rental Market by equipment type. Tractors remain the most commonly rented farm machines because they support a wide range of activities, including land preparation, planting, spraying, hauling, and crop maintenance. Their ability to work with multiple attachments also makes rented tractors practical for farms that require additional machinery only during peak operating periods.
Official agricultural spending data also indicates the importance of tractor-related machinery in farm operations. According to the USDA National Agricultural Statistics Service, U.S. farmers spent USD 18.7 billion on tractors and self-propelled farm machinery in 2025. This level of spending shows the significant capital required for farm machinery and supports demand for rental services among operators seeking access to equipment without making a full ownership investment. USDA Ag Stats
Tractor rental is also supported by the large area requiring mechanized field operations. USDA reported in its 2025 Crop Production Summary, released in 2026, that U.S. farmers harvested 91.258 million acres of corn for grain during the 2025 crop year. Such large-scale cultivated acreage creates regular requirements for tractors during soil preparation, seeding, fertilizer application, crop protection, and transport activities. USDA Ag Stats
Harvesters represent an important equipment segment within the Farm Equipment Rental Market, supported by their high purchase cost, seasonal utilization, and critical role during narrow harvesting windows. Farmers generally require harvesting machinery for a limited period of the year, making rental and custom-hiring models economically attractive. Rental providers can also supply higher-capacity machines when farms need additional harvesting power during periods of favorable weather or unusually large crop volumes.
By Power Output Analysis
71–130 HP Tractors Lead the Farm Equipment Rental Market with 31.30% Share Due to Their Versatile Field Use
In 2025, 71–130 HP held a dominant market position, capturing more than a 31.30% share of the Farm Equipment Rental Market by power output. Equipment in this power range is widely used because it offers enough strength for plowing, planting, tillage, spraying, hauling, and operating medium-to-heavy attachments. For rental providers, these tractors are attractive because a single machine can serve several farming applications and different crop conditions.
Demand for this power category is supported by the scale of mechanized farming activity. According to the USDA National Agricultural Statistics Service, U.S. farmers planted 95.2 million acres of corn in 2025, while soybean planted area reached 83.4 million acres. Large cultivated areas create regular demand for tractors that can handle field preparation, seeding, crop protection, and transport work efficiently.
Less Than 30 HP equipment represents an important segment of the Farm Equipment Rental Market, particularly for light-duty farming activities, horticulture, landscaping, orchard work, livestock farms, and operations where compact machinery is easier to handle. These tractors generally suit jobs such as mowing, spraying, material movement, and working in narrow areas where larger equipment may not be practical.
Government agricultural statistics show a broad base of smaller farm operations that can support demand for compact rented machinery. For example, USDA reported 12,600 farm operations in Maryland in 2025, covering approximately 2.0 million acres, with an average farm size of 159 acres. Smaller operating areas can favor compact tractors because they provide sufficient power for routine field and property work while limiting fuel use, storage requirements, and operating complexity.
By Drive Type Analysis
Four-Wheel Drive Leads the Farm Equipment Rental Market with 55.10% Share, Supported by Heavy Field Operations
In 2025, Four-Wheel Drive held a dominant market position, capturing more than a 55.10% share of the Farm Equipment Rental Market by drive type. Four-wheel-drive equipment is widely preferred for rental because it provides better traction, pulling capacity, and stability during plowing, tillage, planting, and hauling. These machines are particularly useful on large farms, uneven land, and fields where soil conditions require stronger power delivery. For rental companies, four-wheel-drive tractors also offer wider application across different crops and seasonal operations.
The segment is supported by the large area managed through mechanized farming. In June 2025, the USDA National Agricultural Statistics Service estimated U.S. corn planted area at 95.2 million acres, while soybean planted area reached 83.4 million acres. These extensive crop areas require dependable tractors for land preparation, planting, spraying, and material movement, supporting demand for higher-traction rental machinery.
Two-Wheel Drive equipment remains an important part of the Farm Equipment Rental Market because it is suitable for routine agricultural work where heavy traction is not always required. These tractors are commonly used for planting support, spraying, mowing, light tillage, transport, and general farm maintenance. Their simpler operating structure and suitability for relatively firm field conditions make them practical rental options for farmers requiring machinery for short-duration or less demanding jobs.
Government statistics show a broad operating base for such equipment. In 2025, USDA estimated that U.S. growers expected to harvest 86.8 million acres of corn for grain, while soybean harvested area was estimated at 82.5 million acres. This scale of field activity creates substantial demand for tractors across crop establishment, maintenance, and transport operations, including jobs that can be performed efficiently with two-wheel-drive equipment.
By Farm Size Analysis
Small Farms Lead the Farm Equipment Rental Market with 42.30% Share as Rental Reduces Machinery Ownership Burden
In 2025, Small Farms held a dominant market position, capturing more than a 42.30% share of the Farm Equipment Rental Market by farm size. Small farms often need tractors, tillage machines, sprayers, and harvesting equipment for limited periods, which makes rental more practical than maintaining a full machinery fleet. The model helps operators gain access to modern equipment during planting and harvesting while keeping machinery investment and storage requirements under control.
The large number of smaller agricultural operations supports this segment. According to the USDA Economic Research Service, its America’s Farms and Ranches at a Glance: 2025 Edition, released in 2026, found that small family farms represented 86% of all U.S. farms based on 2024 Agricultural Resource Management Survey data. These farms operated 40% of U.S. agricultural land and generated 17% of agricultural production value. Their large presence creates a broad customer base for equipment rental and custom-hiring services.
Medium-Sized Farms form an important segment of the Farm Equipment Rental Market because their machinery requirements are higher than those of small farms, while purchasing every specialized machine may still be economically difficult. These farms commonly need additional tractors, planters, sprayers, combines, and tillage equipment during short seasonal windows. Rental services therefore provide a flexible way to expand machinery capacity without adding permanently underused assets.
Government data highlights the operating scale of this customer group. The USDA Economic Research Service reported in its 2025 Edition that 113,966 midsize family farms were operating in the United States based on 2024 survey data. Midsize family farms represented 6.1% of U.S. farms, operated 18.3% of agricultural acreage, and generated 18.4% of total agricultural production value.
By Rental Duration Analysis
Seasonal Rental Leads the Farm Equipment Rental Market with 46.00% Share as Machinery Demand Peaks During Planting and Harvesting
In 2025, Seasonal held a dominant market position, capturing more than a 46.00% share of the Farm Equipment Rental Market by rental duration. Seasonal rental is widely preferred because tractors, planters, sprayers, and harvesting machines are often required only during specific farming periods. Instead of purchasing machinery that may remain unused for much of the year, farmers can rent equipment during planting, crop-care, and harvesting seasons.
Official crop progress data highlights how concentrated farm machinery demand can become during peak seasons. According to the USDA National Agricultural Statistics Service, by May 25, 2025, U.S. farmers had planted 87% of corn acreage, while soybean planting had reached 76%. USDA also reported that 67% of corn had emerged and 50% of soybean acreage had emerged by the same date.
Short-Term rental represents an important part of the Farm Equipment Rental Market as farmers frequently need additional machinery for only a few days or weeks. This model is suitable for unexpected workload increases, equipment breakdowns, weather-related planting delays, harvesting pressure, or specialized jobs. It also allows farms to obtain extra tractors, sprayers, tillage equipment, or harvesters without entering longer rental agreements.
Key Market Segments
By Equipment Type
- Tractors
- Harvesters
- Balers
- Sprayers
- Planters and Seeders
- Other Equipment
By Power Output
- Less Than 30 HP
- 31–70 HP
- 71–130 HP
- 131–250 HP
- Above 250 HP
By Drive Type
- Two-Wheel Drive
- Four-Wheel Drive
By Farm Size
- Small Farms
- Medium-Sized Farms
- Large Farms
By Rental Duration
- Short-Term
- Seasonal
- Annual
Driver Analysis
Capex-Light Farm Operations
Farm-income compression is making access to machinery economically preferable to ownership for increasingly risk-conscious operators: USDA forecasts U.S. net farm income at USD 158.4 billion in 2026, down 2.6% nominally and 5.5% in real terms from 2025, while production expenses rise 4.5% to USD 492.8 billion and fuel-and-oil expenditure increases 28.8%. Farmers nevertheless spent USD 18.7 billion on tractors and self-propelled machinery and USD 7.5 billion on other farm machinery in 2025, equal to USD 26.2 billion of equipment outlay before repairs, fuel, insurance, storage, and financing.
Intermediate agricultural loan rates in the Kansas City Federal Reserve District remained about 7.3% in the first half of 2026, so a USD 300,000 financed machine can carry roughly USD 21,900 of first-year interest before principal, making hourly, daily, seasonal, or per-acre rental structurally attractive where annual use is insufficient to absorb depreciation.
The rental model converts fixed capital into variable operating cost, preserves liquidity for seed and fertilizer, transfers residual-value and maintenance risk to the fleet owner, and allows farmers to match machine capacity to crop calendars; for rental providers, this shifts value capture from one equipment sale to recurring utilization, delivery, operator, maintenance, insurance, and telematics revenue.
The model assigns this driver +2.1 percentage points because financial pressure is immediate across North America, Europe, and Australia, but the strongest growth accrues to operators that maintain 55–70% in-season utilization, bundle downtime guarantees, and dynamically price scarce harvest equipment rather than compete only on daily rates.
Drivers Impact Analysis
| Driver | (\~) % Impact on CAGR | Geographic Relevance | Impact Timeline |
|---|---|---|---|
| Capex-light farm operations | +2.1 pp | North America, EU, Australia | Short term (≤ 2 years) |
| Smallholder equipment access | +1.9 pp | India, Africa, Southeast Asia, EU | Long term (≥ 4 years) |
| Subsidized hiring networks | +1.6 pp | India core, EU spill-over | Medium term (2-4 years) |
| Labor-saving mechanization | +1.4 pp | North America, EU, Japan | Short term (≤ 2 years) |
| Precision equipment-as-service | +1.2 pp | North America, EU, Brazil, Australia | Medium term (2-4 years) |
| OEM fleet monetization | +0.9 pp | North America, EU, APAC | Medium term (2-4 years) |
Restraint Analysis
Peak-Season Fleet Imbalance
Agriculture concentrates equipment demand into weather-dependent planting and harvesting windows, creating an immediate structural mismatch between peak fleet requirements and full-year asset utilization: USDA defines prevented planting around whether a crop can be planted with proper equipment by a location-specific final planting date, while 2026 insurance standards require notice within 72 hours after that date, showing how narrow and commercially unforgiving the operating window is.
A custom-hiring study found 61.04% of beneficiary farmers reported non-availability of machinery during crop season, while a separate 2024 field study reported lack of timely peak-season availability among 81.42% of users, confirming that capacity can be simultaneously scarce during a short peak and idle outside it.
Fleet owners therefore face a binary margin problem: buying enough tractors, planters and combines to satisfy the peak increases depreciation, interest, insurance and storage per billed hour, but limiting fleet size causes lost bookings and pushes customers back toward ownership or informal contractors; the 2026 Iowa survey illustrates the utilization sensitivity through tractor-only rental averaging USD 0.34 per horsepower-hour and corn-head rental USD 11.60 per acre, rates that must recover capital cost over relatively few annual operating hours.
Weather can compress or cancel demand further, and machinery failure itself generally does not qualify a farmer for prevented-planting protection, shifting timing liability back to the renter and provider. The model assigns a -2.0-point short-term CAGR deduction because this imbalance directly caps transaction volume and fleet returns; regional relocation, multi-crop scheduling, flexible leases and off-season construction or transport work reduce the loss but cannot remove synchronized crop calendars.
Restraint Impact Analysis
| Restraint | (\~) % Impact on CAGR Forecast | Geographic Relevance | Impact Timeline |
|---|---|---|---|
| Peak-season fleet imbalance | -2.0 pp | Global; monsoon and grain belts | Short term (≤ 2 years) |
| High fleet financing cost | -1.8 pp | North America, EU, emerging APAC | Short term (≤ 2 years) |
| Repair and parts lock-in | -1.5 pp | North America, Africa, South Asia | Medium term (2-4 years) |
| Farmer affordability ceiling | -1.3 pp | India, Africa, Southeast Asia | Long term (≥ 4 years) |
| Rural logistics penalty | -1.1 pp | Africa, South Asia, Latin America | Long term (≥ 4 years) |
| Damage and liability exposure | -0.9 pp | Global rental fleets | Medium term (2-4 years) |
Opportunity Analysis
Precision-Tech Subscriptions
Precision capability sold through time-limited rental activation is an untapped monetization layer rather than a current rental driver because most providers still quote tractor, planter, sprayer or harvester hours without separately commercializing guidance, variable-rate application, machine vision, data processing and agronomic reporting; only 27% of U.S. farms and ranches used precision practices in 2023, and USDA data show autosteer adoption at 70% of large crop farms versus materially lower penetration among small farms, although small farms constitute more than 85% of U.S. farms.
This gap allows fleet operators to purchase one high-specification machine and spread its receiver, controller, sensor and software cost across multiple customers, then charge a base equipment fee plus feature activation, per-acre application, prescription-map preparation and post-job compliance reporting; a fleet serving 5,000 acres per season could add an independently estimated USD 8–20 per acre of precision-service revenue, creating USD 40,000–100,000 of incremental turnover without duplicating the tractor chassis.
Telematics can also automate billing, geofencing and preventive maintenance, while pooled agronomist support lowers the effective customer-acquisition and training cost across many farms. The +2.0-point upside assumes 10–15% of relevant rental transactions migrate to paid digital tiers by 2031 and gross margin on the software and analytics layer exceeds conventional iron-only rental margins by 8–15 percentage points; execution should begin within two years through OEM-neutral retrofit kits and interoperable data contracts, because the white space is converting underused digital capability into recurring subscription and outcome-based revenue, not simply meeting existing demand for rented machinery.
Opportunity Impact Analysis
| Opportunity | (\~) % Potential CAGR Upside | Geographic Relevance | Execution Window |
|---|---|---|---|
| Precision-tech subscriptions | +2.0 pp | North America, EU, Brazil, Australia | Short term (≤ 2 years) |
| Specialty-crop robotics fleet | +1.7 pp | US, EU, Japan, Australia | Medium term (2-4 years) |
| Africa micro-fleet networks | +1.6 pp | Sub-Saharan Africa | Medium term (2-4 years) |
| Conservation-equipment services | +1.3 pp | North America, EU | Short term (≤ 2 years) |
| Circular fleet financing | +1.1 pp | EU core, North America | Medium term (2-4 years) |
| Rental-platform roll-ups | +0.9 pp | India, Africa, Southeast Asia | Long term (≥ 4 years) |
Challenges Analysis
Seasonal Fleet Utilization
Farm-equipment rental economics are structurally exposed to narrow planting, spraying and harvesting windows: a tractor, planter, combine or baler can command high daily rates for 15–45 peak days yet generate limited billable hours through the remaining 320-plus days, while depreciation, insurance, yard rent, financing and preventive maintenance continue year-round; this is an operational challenge rather than a restraint because rental demand exists, but revenue concentration makes annual fleet utilization volatile.
A 100-machine fleet with an estimated 55% of annual rental revenue concentrated in a 90-day peak period can lose 8–15 percentage points of annual utilization when weather shifts fieldwork by only 7–14 days, forcing either discounting to retain bookings or expensive subcontracting when local capacity is insufficient.
The strategic response is multi-region fleet balancing, attachment-led cross-season use, dynamic pricing, guaranteed booking deposits and crop-calendar analytics: moving even 10% of a fleet between non-overlapping corn, wheat, forage and horticulture corridors can raise annual billable utilization by an estimated 5–9 points and lower fixed cost per billable hour by 6–12%.
FAO notes that machinery hire providers must align closely with farmers’ needs while managing business operations, quality control, operator training, maintenance and service delivery, illustrating why capacity orchestration—not simply adding equipment—is the scalable control point.
Challenges Impact Analysis
| Challenge | (\~) % CAGR Friction Drag | Geographic Relevance | Mitigation Horizon |
|---|---|---|---|
| Seasonal Fleet Utilization | -1.4 pp | North America, EU, India, APAC | Medium term (2-4 years) |
| Technician Capacity Gap | -1.2 pp | North America core, EU, Australia | Long term (≥ 4 years) |
| Parts Supply Volatility | -1.0 pp | North America, EU, APAC corridors | Medium term (2-4 years) |
| Rural Last-Mile Logistics | -0.9 pp | India, Africa, Southeast Asia | Long term (≥ 4 years) |
| Telematics Data Fragmentation | -0.8 pp | North America, EU, Brazil, Australia | Medium term (2-4 years) |
| Climate-Driven Demand Volatility | -0.7 pp | North America, South America, APAC | Long term (≥ 4 years) |
Geopolitical Impact Analysis
Russia–Ukraine War Reshapes Farm Equipment Rental Demand and Supply Conditions
The ongoing Russia–Ukraine war continues to influence the Farm Equipment Rental Market by raising uncertainty, damaging agricultural assets, disrupting fuel and machinery supply chains, and weakening farmers’ ability to invest in owned equipment. In war-affected areas, rental models can become more important because they allow farmers to access tractors and harvesters without committing large amounts of capital to replacement assets.
The World Bank’s fifth Rapid Damage and Needs Assessment estimated that, as of December 2025, Ukraine’s agriculture sector had suffered USD 12.1 billion in damage and USD 78.0 billion in losses. Machinery, equipment, storage assets, and logistics infrastructure were among the most affected areas. These losses reduce available farm machinery and increase the need for replacement, leasing, rental, and externally supplied equipment.
FAO reported in March 2026 that Ukraine’s 2025 cereal production reached about 60.8 million tonnes, while around 13% of agricultural households in frontline areas had lost access to cultivable land because of explosive hazards. EU Solidarity Lanes had also moved about 111 million tonnes of imports into Ukraine by July 2026, including fuel, vehicles, and fertilizers. Together, these pressures support flexible equipment access while keeping rental operators exposed to fuel costs, logistics delays, asset shortages, and security risks.
Regional Insights
Asia Pacific Leads the Farm Equipment Rental Market with 35.60% Share and USD 10.46 Billion Value
Asia Pacific held the dominant position in 2025, capturing more than a 35.60% share and reaching USD 10.46 billion. The region benefits from a large agricultural base, rising mechanization, farm consolidation, and the need to improve equipment access without full ownership.
Japan’s Ministry of Agriculture, Forestry and Fisheries reported 836,000 agricultural management entities in its final 2025 Census. Average cultivated land per entity increased to 3.6 hectares, while farms managing 20 hectares or more accounted for about half of cultivated land. This shift toward larger operating units supports demand for higher-capacity tractors and harvesting equipment, including rental and shared-use machinery.
North America is emerging as the fastest-growing regional segment, supported by high machinery costs, large commercial farms, and demand for temporary equipment capacity during planting and harvesting. USDA’s 2026 Farm Production Expenditures release covers spending on tractors, self-propelled machinery, other farm machinery, rent, fuel, and farm services, showing the substantial capital intensity of U.S. agriculture.
USDA also contacted nearly 40,000 producers for the 2025 Agricultural Resource Management Survey to measure farm costs and financial conditions. These conditions encourage operators to compare ownership with rental, especially for expensive or specialized machines used only during short seasonal windows.
Key Regions and Countries Insights
- North America
- US
- Canada
- Europe
- Germany
- France
- The UK
- Spain
- Italy
- Rest of Europe
- Asia Pacific
- China
- Japan
- South Korea
- India
- Australia
- Rest of APAC
- Latin America
- Brazil
- Mexico
- Rest of Latin America
- Middle East & Africa
- GCC
- South Africa
- Rest of MEA
Key Players Analysis
Deere & Company remains a major supplier of tractors, harvesters, precision agriculture systems, and connected farm machinery that can support dealer-led rental and leasing activity. In fiscal 2025, the company generated USD 45.68 billion in net sales and revenues and USD 5.03 billion in net income. Its Production & Precision Agriculture business recorded USD 4.74 billion in fourth-quarter sales, supported by large tractors, combines, planting equipment, and advanced farm technologies used across commercial farming operations.
CNH Industrial strengthens the Farm Equipment Rental Market through its Case IH, New Holland, and STEYR agricultural equipment portfolios. In 2025, the company reported USD 18.10 billion in consolidated revenues, while agricultural net sales reached USD 12.39 billion. Agriculture adjusted EBIT stood at USD 772 million, with a 6.2% adjusted EBIT margin. Its broad tractor, combine, hay, forage, and precision farming portfolio gives dealers and equipment-service providers a strong base for rental and flexible machinery-access programs.
AGCO Corporation serves the agricultural machinery sector through brands including Fendt, Massey Ferguson, PTx, and Valtra, supporting rental demand across tractors and precision equipment. In 2025, AGCO generated USD 10.08 billion in net sales and invested USD 487.7 million in research and development. The company also reported USD 740 million in free cash flow and operated through about 2,800 independent dealers and distributors across 140 countries, giving it broad access to machinery users and service networks.
Top Key Players Outlook
- Deere & Company
- CNH Industrial N.V.
- AGCO Corporation
- Kubota Corporation
- Mahindra & Mahindra Ltd.
- CLAAS KGaA mbH
- SDF Group
- Yanmar Holdings Co., Ltd.
- J.C. Bamford Excavators Ltd.
- Escorts Kubota Limited
- Titan Machinery Inc.
- United Rentals, Inc.
- Ashtead Group plc (Sunbelt Rentals)
- Flaman Group of Companies
- Pacific Ag Rentals LLC
Recent Developments
- In August 2026, Kubota announced new Agri Robo tractors, including 2 unmanned models of 100 HP and 105 HP and 3 manned models of 80 HP, 100 HP, and 105 HP, scheduled for launch in April 2027.
- In June 2026, Mahindra crossed cumulative production of 7 million tractors, showing the scale available to support dealers and equipment-access businesses. Mahindra also sold 526,403 tractors in FY2026, up 24.0%, while management planned 7 new product launches and 12 feature upgrades for FY2027, strengthening its future position across mechanization and rental-oriented equipment demand.
- In September 2026, CLAAS introduced new ARION 6, AXION 8, and AXION 9 tractors ranging from 165 HP to 450 HP in North America.
Report Scope
| Report Features | Description |
|---|---|
| Market Value (2025) | USD 29.4 Bn |
| Forecast Revenue (2035) | USD 56.2 Bn |
| CAGR (2026-2035) | 6.7% |
| Base Year for Estimation | 2025 |
| Historic Period | 2020-2024 |
| Forecast Period | 2026-2035 |
| Report Coverage | Revenue Forecast, Market Dynamics, Competitive Landscape, Recent Developments |
| Segments Covered | By Equipment Type (Tractors, Harvesters, Balers, Sprayers, Planters and Seeders, Other Equipment), By Power Output (Less Than 30 HP, 31–70 HP, 71–130 HP, 131–250 HP, Above 250 HP), By Drive Type (Two-Wheel Drive, Four-Wheel Drive), By Farm Size (Small Farms, Medium-Sized Farms, Large Farms), By Rental Duration (Short-Term, Seasonal, Annual) |
| Regional Analysis | North America – US, Canada; Europe – Germany, France, The UK, Spain, Italy, Rest of Europe; Asia Pacific – China, Japan, South Korea, India, Australia, Singapore, Rest of APAC; Latin America – Brazil, Mexico, Rest of Latin America; Middle East & Africa – GCC, South Africa, Rest of MEA |
| Competitive Landscape | Deere & Company, CNH Industrial N.V., AGCO Corporation, Kubota Corporation, Mahindra & Mahindra Ltd., CLAAS KGaA mbH, SDF Group, Yanmar Holdings Co., Ltd., J.C. Bamford Excavators Ltd., Escorts Kubota Limited, Titan Machinery Inc., United Rentals, Inc., Ashtead Group plc (Sunbelt Rentals), Flaman Group of Companies, Pacific Ag Rentals LLC |
| Customization Scope | Customization for segments, region/country-level will be provided. Moreover, additional customization can be done based on the requirements. |
| Purchase Options | We have three licenses to opt for: Single User License, Multi-User License (Up to 5 Users), Corporate Use License (Unlimited User and Printable PDF) |





































