


Report Overview
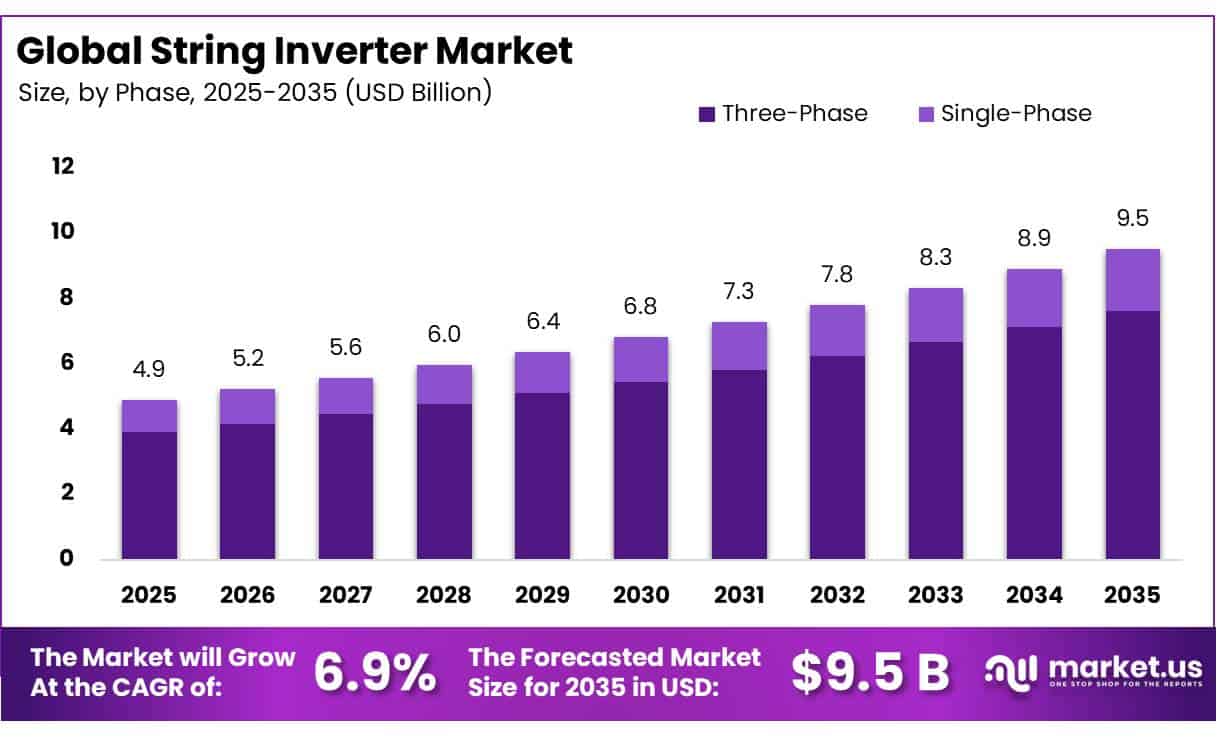
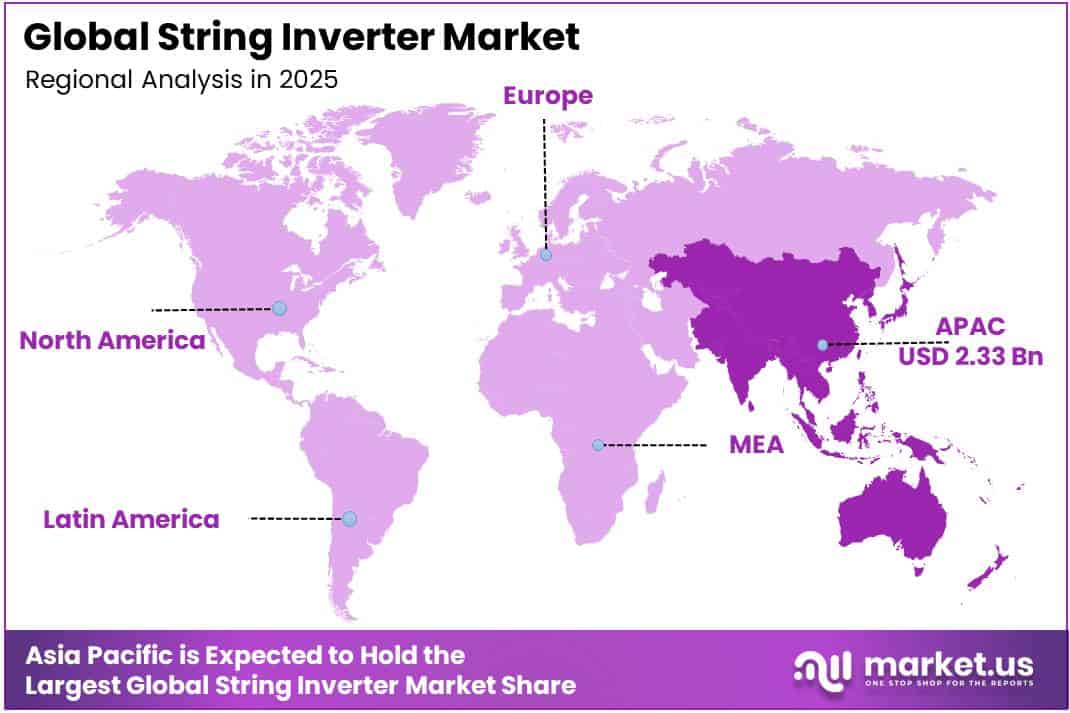
In 2025, the Global String Inverter Market was valued at USD 4.9 billion, and between 2026 and 2035, this market is estimated to register a CAGR of 6.9%, reaching about USD 9.5 billion by 2035. Asia Pacific held a dominant market position, capturing more than a 47.60% share, holding USD 2.33 billion in revenue.
The string inverter industry is expanding alongside solar photovoltaic deployment, as these power electronic systems convert direct current from module strings into grid-compatible alternating current.
- In April 2026, the International Energy Agency Photovoltaic Power Systems Programme reported that global photovoltaic capacity approached 3 terawatts in 2025, with about 698 gigawatts added during the year, while nearly 40 countries installed at least 1 gigawatt. This scale supports demand for efficient, managed string inverter platforms across distributed and utility installations.
Key Takeaways
- The global string inverter market was valued at USD 4.9 billion in 2025.
- The global market is projected to grow at a CAGR of 6.9% and is estimated to reach USD 9.5 billion by 2035.
- On the basis of phase, three-phase dominated the market, constituting 79.90% of the total market share.
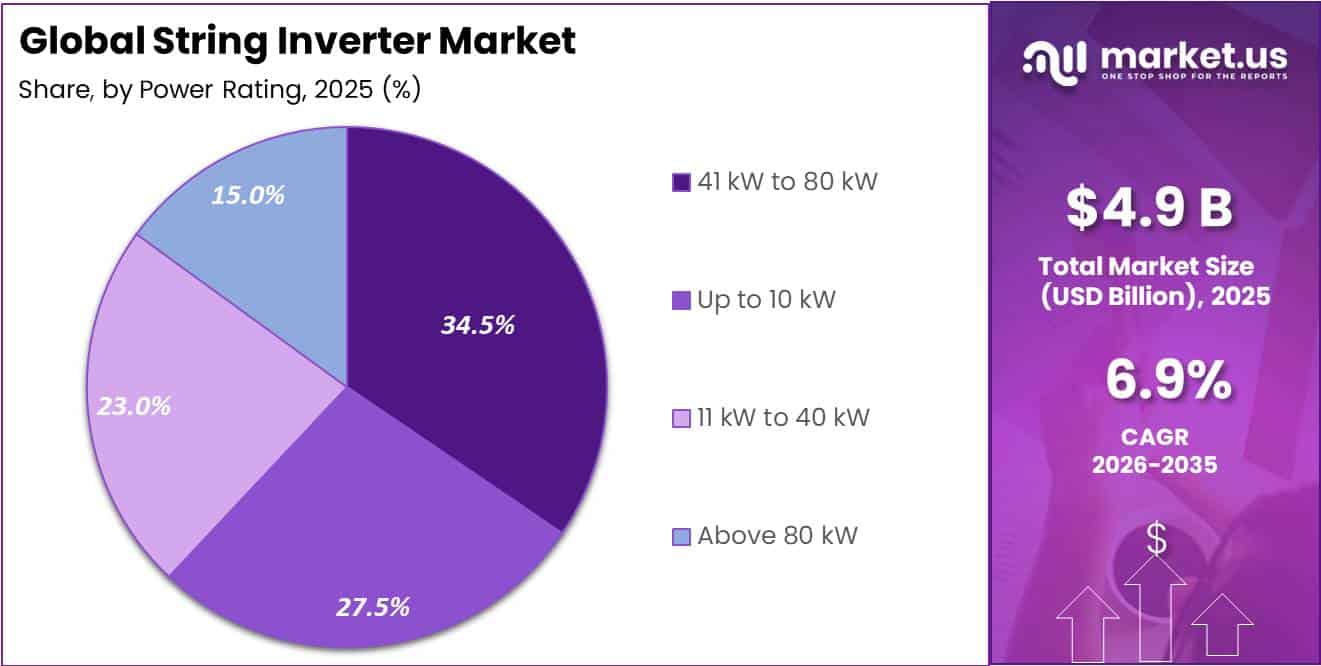
- Based on the power rating, 41 kW to 80 kW dominated the string inverter market, with a substantial market share of around 34.50%.
- Based on the end user, commercial and industrial (C&I) led the market, comprising 41.00% of the total market.
- Among the connection types, on-grid held a major share in the string inverter market, accounting for 77.50% of the market share.
- In 2025, Asia Pacific was the most dominant region in the string inverter market, accounting for 47.60% of the total global market.
Industrial momentum is also visible in the United States, where utility and commercial solar projects require reliable conversion, monitoring, and grid-support functions. In July 2026, the U.S. Energy Information Administration reported 2025 total solar photovoltaic capacity of 209,304.0 megawatts, including 149,798.5 megawatts at utility-scale facilities and 59,505.5 megawatts at small-scale facilities. This installed base increases opportunities for single-phase and three-phase string inverters across residential, commercial, industrial, and utility applications.
- In March 2026, Eurostat reported that renewables supplied 47.3% of European Union electricity generation in 2025. Solar accounted for 27.5% of renewable electricity and recorded 24.6% growth from the previous year. Higher solar penetration increases the importance of inverter efficiency, voltage management, remote diagnostics, reactive power capability, and compatibility with storage and modern grid requirements.
Government and regulatory initiatives are also shaping technology development. In July 2025, the Federal Energy Regulatory Commission approved reliability standards for inverter-based resources, requiring connected generators to ride through voltage and frequency disturbances. Separately, the U.S. Department of Energy currently lists $217 million for its Solar Energy Technologies Office Laboratory Call for fiscal years 2025 to 2027, $33 million for inverter-based resource management tools, and $26 million for solar and wind grid-services demonstrations, supporting advanced inverter research and reliable renewable integration.
Phase Analysis
Three-Phase dominates with 79.90% due to its suitability for higher-capacity commercial and utility solar systems.
In 2025, Three-Phase held a dominant market position, capturing more than a 79.90% share. Its leadership reflects strong use across commercial, industrial, and utility solar installations where higher power handling, balanced electrical loads, and efficient grid connection are important. Three-phase string inverters support larger photovoltaic arrays and can serve rooftop, carport, ground-mounted, and other distributed projects. Their scalability and compatibility with higher-capacity systems make them practical for developers seeking efficient conversion and reliable operation across demanding solar applications.
- In July 2026, according to the U.S. Energy Information Administration, 2025 small-scale solar photovoltaic capacity reached 40,474.8 megawatts in the residential sector, 16,031.4 megawatts in the commercial sector, and 2,999.3 megawatts in the industrial sector.
Single-Phase is the growing segment. Its adoption is supported by residential and smaller distributed solar systems where simpler electrical architecture and lower power requirements make single-phase equipment practical. These inverters provide straightforward installation, conversion, monitoring, and grid interaction for household photovoltaic systems. Continued expansion of rooftop solar and home energy systems is widening opportunities for compact string inverter solutions suited to residential electricity networks in many markets.
Power Rating Analysis
41 kW to 80 kW dominates with 34.50% due to strong suitability for commercial and industrial solar installations.
In 2025, 41 kW to 80 kW held a dominant market position, capturing more than a 34.50% share. This power band suits commercial rooftops, industrial facilities, carports, and smaller utility projects that need higher conversion capacity without moving into large centralised equipment. String inverters in this range offer scalable system design, multiple string inputs, remote monitoring, and easier maintenance, making them practical for businesses expanding photovoltaic capacity while managing installation space, operating costs, and grid connection requirements.
- In June 2026, according to SolarEdge, its Synergy Power Series covered 50 kW to 120 kW, supported 175% direct current oversizing, and could deliver up to 10% more energy when paired with the company’s power optimizers.
Up to 10 kW is the growing segment. Demand is supported by residential rooftops and smaller commercial photovoltaic systems where compact equipment, straightforward installation, and lower power requirements are important. These inverters match household and light-business electricity needs while supporting monitoring and grid interaction.
End User Analysis
Commercial and Industrial (C&I) dominates with 41.00% as businesses expand solar installations to manage energy costs and consumption.
In 2025, Commercial and Industrial (C&I) held a dominant market position, capturing more than a 41.00% share. This leadership reflects strong solar adoption across factories, warehouses, offices, retail facilities, data centers, and other business sites seeking lower electricity costs and greater energy control. String inverters suit these installations because they support modular system design, multiple photovoltaic strings, remote monitoring, and easier maintenance while allowing projects to expand capacity as energy demand grows.
- In July 2026, according to the U.S. Energy Information Administration, residential small-scale solar photovoltaic generation reached 7,212 thousand megawatthours in May 2026, while year-to-date generation totaled 28,405 thousand megawatthours and rolling 12-month generation reached 66,319 thousand megawatthours.
Residential is the growing segment. Demand is supported by expanding rooftop solar adoption, household electrification, energy storage integration, and interest in reducing grid electricity purchases. Residential string inverters provide compact power conversion, monitoring, safety functions, and compatibility with home photovoltaic arrays. Their modular design also supports different roof layouts and system sizes, making them suitable for homeowners seeking flexible solar installations and improved control over household energy production across diverse markets.
Connection Type Analysis
On-Grid dominates with 77.50% as grid-connected solar remains the preferred setup across major installations.
In 2025, On-Grid held a dominant market position, capturing more than a 77.50% share. Its leadership reflects the widespread use of grid-connected solar systems across residential, commercial, industrial, and utility installations. On-grid string inverters convert photovoltaic output for direct use and grid export while supporting monitoring, voltage control, and system protection. Their compatibility with established electricity networks and net-metering frameworks makes them practical for projects seeking reliable solar integration without depending entirely on standalone storage.
- In April 2026, according to the International Renewable Energy Agency, off-grid electricity capacity outside Eurasia, Europe, and North America expanded by 1.7 gigawatts during 2025, with solar power contributing 1.5 gigawatts of that increase.
Off-Grid is the growing segment. Demand is supported by remote communities, telecom sites, farms, islands, and other locations where grid access is limited or unreliable. Off-grid string inverters can operate with photovoltaic arrays, batteries, and backup generation to provide independent electricity supply. Continued deployment of decentralized renewable systems is widening opportunities for inverter solutions that support energy access, resilience, and flexible power management in areas beyond conventional grid infrastructure worldwide today.
Key Market Segments
By Phase
- Three-Phase
- Single-Phase
By Power Rating
- 41 kW to 80 kW
- Up to 10 kW
- 11 kW to 40 kW
- Above 80 kW
By End User
- Commercial and Industrial (C&I)
- Residential
- Utilities
By Connection Type
- On-Grid
- Off-Grid
Driver Analysis
PV Capacity Build-out and Inverter Content Demand
Solar deployment remains the primary volume engine for string inverters because every new PV installation requires power-conversion equipment, while distributed and segmented utility-scale plant layouts raise inverter-unit intensity relative to large centralized designs. Global solar PV additions reached roughly 602 GW in 2024, with utility-scale capacity accounting for approximately 382 GW and rooftop/distributed systems adding about 200 GW; cumulative global PV capacity reached around 2.25 TW by year-end.
China added about 315 GW of solar capacity in 2025, lifting its installed PV base to about 1.2 TW, while the national 2026 solar outlook remains substantial at an estimated 180–240 GW despite a post-policy-change normalization in installation momentum. In the United States, developers plan 43.4 GW of utility-scale solar additions in 2026 51% of planned new utility-scale generation capacity creating direct demand for high-power three-phase string inverters, monitoring gateways, skid integration, and long-term service agreements.
Drivers Impact Analysis
| Driver | (~) % Impact on CAGR Forecast | Geographic Relevance | Impact Timeline |
|---|---|---|---|
| PV capacity build-out | +2.1 pp | China, US, India, EU, MENA | Short term (≤ 2 years) |
| Utility-scale string shift | +1.3 pp | China, India, US, EU, MENA | Medium term (2–4 years) |
| Hybrid storage integration | +1.1 pp | US, EU, Australia, India | Medium term (2–4 years) |
| Rooftop solar incentives | +0.9 pp | India, EU, US, APAC | Short term (≤ 2 years) |
| Grid-code digitalization | +0.8 pp | EU, US, China, Australia | Medium term (2–4 years) |
| Local-content compliance | +0.5 pp | India, EU, US | Long term (≥ 4 years) |
Restraint Analysis
Grid Interconnection Delays
Grid congestion is the most material near-to-medium-term restraint because string inverter demand is ultimately recognized at system commissioning, not when a PV project enters development, secures land, or places a preliminary equipment order. The International Energy Agency has identified at least 3,000 GW of renewable projects waiting for grid connection globally, including around 1,500 GW in advanced stages, a backlog equivalent to roughly five times the solar-and-wind capacity added in 2022.
Europe faces similar friction, with grid-connection queues documented in at least 16 countries and approximately 120 GW of mature renewable projects plus 1.5 million household installations potentially lacking timely grid access by 2030. For inverter vendors, delayed energization extends receivables cycles, increases inventory-aging risk, weakens factory-load visibility, and lowers service-attachment conversion because EPCs defer procurement until connection certainty improves; the estimated -1.8 percentage-point CAGR drag reflects delayed revenue recognition rather than permanent destruction of every underlying PV opportunity.
Restraint Impact Analysis
| Restraint | (~) % Impact on CAGR | Geographic Relevance | Impact Timeline |
|---|---|---|---|
| Grid interconnection delays | -1.8 pp | US, EU, UK, Australia, India | Medium term (2–4 years) |
| Price compression | -1.5 pp | China, APAC, MENA, Latin America | Short term (≤ 2 years) |
| Trade and tariff disruption | -1.2 pp | North America, EU, India | Medium term (2–4 years) |
| Certification fragmentation | -0.9 pp | India, EU, US, Australia | Short term (≤ 2 years) |
| Heat and field-failure risk | -0.8 pp | MENA, India, Australia, LatAm | Long term (≥ 4 years) |
| Cybersecurity compliance | -0.6 pp | EU, US, Australia, Japan | Medium term (2–4 years) |
Opportunity Analysis
Storage-Ready Hybrid Platforms
Hybrid PV-storage products represent an upside opportunity rather than a baseline string-inverter driver because a large share of installed solar capacity still operates as a grid-export-only asset, while integrated storage, bidirectional conversion, backup operation, load optimization, and virtual-power-plant participation remain underpenetrated across residential, C&I, and smaller utility applications. Global battery-storage deployment reached 108 GW in 2025, up 40% year-on-year, with installed capacity approximately 11 times its 2021 level; about 80% of new capacity was utility-scale, leaving the remaining behind-the-meter segment as a relatively less-developed inverter-led value pool.
A manufacturer that converts a conventional 10–30 kW commercial string-inverter sale into a hybrid package can expand system revenue through battery interface hardware, energy-management software, ATS/backup equipment, monitoring, commissioning, and service coverage; a modeled hybrid configuration can generate 1.5–2.5 times the inverter hardware revenue of a basic grid-tied unit while lifting gross-margin potential by roughly 5–10 percentage points where software and service are attached.
The estimated +1.9 percentage-point CAGR upside is most achievable in the United States, Europe, Australia, India, and MENA, where demand charges, time-of-use tariffs, grid outages, curtailment risk, and peak-shaving economics can justify the additional capital cost, provided manufacturers secure battery OEM interoperability, bankable warranties, installer training, and financing partnerships before hybrid architecture becomes a commoditized standard.
Opportunity Impact Analysis
| Opportunity | (~) % Potential CAGR | Geographic Relevance | Execution Window |
|---|---|---|---|
| Storage-ready hybrid platforms | +1.9 pp | US, EU, Australia, India, MENA | Short term (≤ 2 years) |
| Inverter fleet software | +1.5 pp | EU, US, Japan, Australia | Medium term (2–4 years) |
| PV repowering retrofits | +1.3 pp | EU, US, Japan, China | Medium term (2–4 years) |
| MSME solar finance bundles | +1.1 pp | India, SE Asia, Africa, LatAm | Short term (≤ 2 years) |
| Cybersecure local supply | +1.0 pp | EU, US, India | Medium term (2–4 years) |
| Agrisolar and microgrids | +0.8 pp | India, MENA, Africa, LatAm | Long term (≥ 4 years) |
Challenges Analysis
Distributed Fleet O&M
Distributed string-inverter architectures improve redundancy but create an operational scaling problem because a 100 MW plant using 250 kW string inverters may require approximately 400 inverter assets, versus one or a small number of central conversion systems, each with separate communication addresses, cooling systems, connectors, firmware versions, alarms, and potential service events. This does not stop current deployments, but it raises lifetime operating complexity in harsh environments and can erode the levelized-cost advantage of distributed designs if fleet management is weak.
A field-service model that requires even one technician visit per 100 inverter-years can translate into four annual interventions for a 100 MW distributed fleet before accounting for communication faults, fan maintenance, pest damage, dust ingress, connector degradation, and firmware remediation; in MENA, India, Latin America, and Australia, travel distance and harsh operating conditions can raise the cost of each truck roll by 30–60% relative to dense urban C&I service areas.
The modeled -0.8 percentage-point CAGR friction arises from higher warranty provisioning, spare-parts buffers, training requirements, and customer skepticism about long-term serviceability; mitigation depends on predictive analytics, standardized field-replaceable units, regional spares hubs, digital work orders, remote commissioning, and O&M contracts priced on availability rather than reactive repair.
Challenges Impact Analysis
| Challenge | (~) % CAGR Friction Drag | Geographic Relevance | Mitigation Horizon |
|---|---|---|---|
| Power-electronics talent gap | -1.0 pp | EU, US, India, Japan | Long term (≥ 4 years) |
| Semiconductor sourcing volatility | -0.9 pp | APAC supply hubs, US, EU, India | Medium term (2–4 years) |
| Grid-forming capability transition | -0.9 pp | EU, US, China, Australia | Medium term (2–4 years) |
| Distributed fleet O&M | -0.8 pp | MENA, India, LatAm, Australia | Long term (≥ 4 years) |
| Cybersecurity patch burden | -0.7 pp | EU, US, Japan, Australia | Medium term (2–4 years) |
| Data and warranty analytics | -0.5 pp | Global OEMs, C&I markets | Medium term (2–4 years) |
Geopolitical Impact Analysis
Geopolitical Realignment and Trade Restrictions Reshaping String Inverter Supply Chains
Geopolitical tensions are reshaping the String Inverter Market through trade barriers, semiconductor exposure, supply chain concentration, and localization policies. The U.S. Department of Energy states that 80% to 100% of manufacturing capacity across each solar supply chain step is located in China or Southeast Asia. Disruptions can delay solar projects and inverter procurement.
Trade measures are increasing cost uncertainty. The Office of the United States Trade Representative raised Section 301 tariffs on Chinese solar wafers and polysilicon to 50%, effective January 1, 2025, while semiconductor tariffs increased to 50% in 2025. Because string inverters rely on power semiconductors, these measures can influence sourcing, economics, and supplier diversification.
- In April 2025, the U.S. Department of Commerce issued final antidumping and countervailing duty determinations on solar cells from Cambodia, Malaysia, Thailand, and Vietnam. Final dumping margins included 125.37% for Cambodian exporters and 111.45% for Trina Solar Thailand, increasing uncertainty for developers sourcing equipment from Southeast Asia.
In Europe, industrial policy is encouraging regional manufacturing. The European Commission reported in 2026 that the Net-Zero Industry Act targets domestic manufacturing capacity equal to up to 40% of annual deployment needs by 2030, while €445 million had supported solar manufacturing. These measures encourage localization, but inverter suppliers remain exposed to semiconductor availability, tariff changes, and sourcing shifts.
Regional Analysis
Asia Pacific dominates with 47.60% and USD 2.33 billion, while North America is the fastest-growing region.
In 2025, Asia Pacific held a dominant position in the String Inverter Market, capturing more than a 47.60% share and generating USD 2.33 billion. The region benefits from large-scale solar deployment, expanding distributed photovoltaic systems, and demand from commercial, industrial, and utility projects.
- In February 2026, China’s National Energy Administration reported that photovoltaic capacity reached 1.2 billion kilowatts, including 670 million kilowatts of centralized solar and 530 million kilowatts of distributed solar, supporting inverter demand across the region.
North America is the fastest growing region, supported by utility-scale solar expansion, distributed generation, grid modernization, and rising demand for power conversion. In February 2026, the U.S. Energy Information Administration reported that developers planned 86 gigawatts of new utility-scale generating capacity for 2026, with solar representing 51% of planned additions.
Key Regions and Countries Covered
- North America
- The US
- Canada
- Europe
- Germany
- France
- The UK
- Spain
- Italy
- Russia & CIS
- Rest of Europe
- APAC
- China
- Japan
- South Korea
- India
- ASEAN
- Rest of APAC
- Latin America
- Brazil
- Mexico
- Rest of Latin America
- Middle East & Africa
- GCC
- South Africa
- Rest of MEA
Key Players Analysis
String inverter manufacturers focus on grid-forming capability, power-density improvement, digital monitoring, and storage compatibility to strengthen competitiveness. In 2026, Huawei expanded FusionSolar9.0, including the SUN2000-506K string inverter and 3/7/11 MW transformer station, while its launch highlighted 1000 V AC architecture and grid-forming string inverter technology. SMA Solar Technology also broadened its portfolio, unveiling three-phase hybrid inverters from 5 kVA to 30 kVA with storage capacities from 3.2 kWh to 49 kWh for homes and small businesses.
Competition is increasingly shaped by product range, system integration, service reach, and software-led performance. Sungrow continues to offer string inverters spanning 2 kW to 352 kW across residential, commercial, and large-scale applications. SolarEdge expanded its MultiRange concept across its European commercial photovoltaic inverter portfolio in June 2026, while SMA reported a €1.41 billion order backlog at the end of March 2026. These moves reinforce competition around scalability, energy management, grid support, reliability, and performance.
Market Key Players
- Huawei Technologies Co., Ltd.
- Sungrow Power Supply Co., Ltd.
- SMA Solar Technology AG
- Growatt New Energy Technology Co., Ltd.
- GoodWe (Jiangsu GoodWe Power Supply)
- Ginlong Technologies (Solis)
- SolarEdge Technologies, Inc.
- Fronius International GmbH
- Sineng Electric Co., Ltd.
- Delta Electronics, Inc.
- SOFARSOLAR (Shenzhen)
- Chint Power Systems (Astronergy)
- FIMER S.p.A.
- Solax Power Network Technology
- TBEA Co., Ltd.
Key Development
- In April 2026, GoodWe launched its 4H Off-Grid Solution, combining the EO G2 Series off-grid inverter with the Lynx A G4 16 kWh low-voltage battery. The system was introduced for residential applications in locations with unstable or limited grid access, expanding GoodWe’s off-grid solar and storage portfolio.
- In January 2026, Fronius and Renon announced a new high-voltage direct current coupled solar and battery solution. The Fronius GEN24 and GEN24 Plus inverters, ranging from 3.8 kW to 10.0 kW, were certified with Renon Xtreme HV 1.0 battery systems under UL 9540 requirements, strengthening integrated residential solar-storage offerings in North America.
Report Scope
| Report Features | Description |
|---|---|
| Market Value (2025) | USD 4.9 Bn |
| Forecast Revenue (2035) | USD 9.5 Bn |
| CAGR (2026-2035) | 6.9% |
| Base Year for Estimation | 2025 |
| Historic Period | 2020-2024 |
| Forecast Period | 2026-2035 |
| Report Coverage | Revenue Forecast, Market Dynamics, Competitive Landscape, Recent Developments |
| Segments Covered | By Phase (Single-Phase and Three-Phase), By Power Rating (Up to 10 kW, 11 kW to 40 kW, 41 kW to 80 kW, and Above 80 kW), By End User (Residential, Commercial and Industrial (C&I), and Utilities), By Connection Type (On-Grid and Off-Grid) |
| Regional Analysis | North America – The US & Canada; Europe – Germany, France, The UK, Spain, Italy, Russia & CIS, Rest of Europe; APAC– China, Japan, South Korea, India, ASEAN & Rest of APAC; Latin America– Brazil, Mexico & Rest of Latin America; Middle East & Africa– GCC, South Africa, & Rest of MEA |
| Competitive Landscape | Huawei Technologies Co., Ltd., Sungrow Power Supply Co., Ltd., SMA Solar Technology AG, Growatt New Energy Technology Co., Ltd., GoodWe (Jiangsu GoodWe Power Supply), Ginlong Technologies (Solis), SolarEdge Technologies, Inc., Fronius International GmbH, Sineng Electric Co., Ltd., Delta Electronics, Inc., SOFARSOLAR (Shenzhen), Chint Power Systems (Astronergy), FIMER S.p.A., Solax Power Network Technology, TBEA Co., Ltd. |
| Customization Scope | Customization for segments, region/country-level will be provided. Moreover, additional customization can be done based on the requirements. |
| Purchase Options | We have three licenses to opt for: Single User License, Multi-User License (Up to 5 Users), Corporate Use License (Unlimited Users and Printable PDF) |





































