


Report Overview
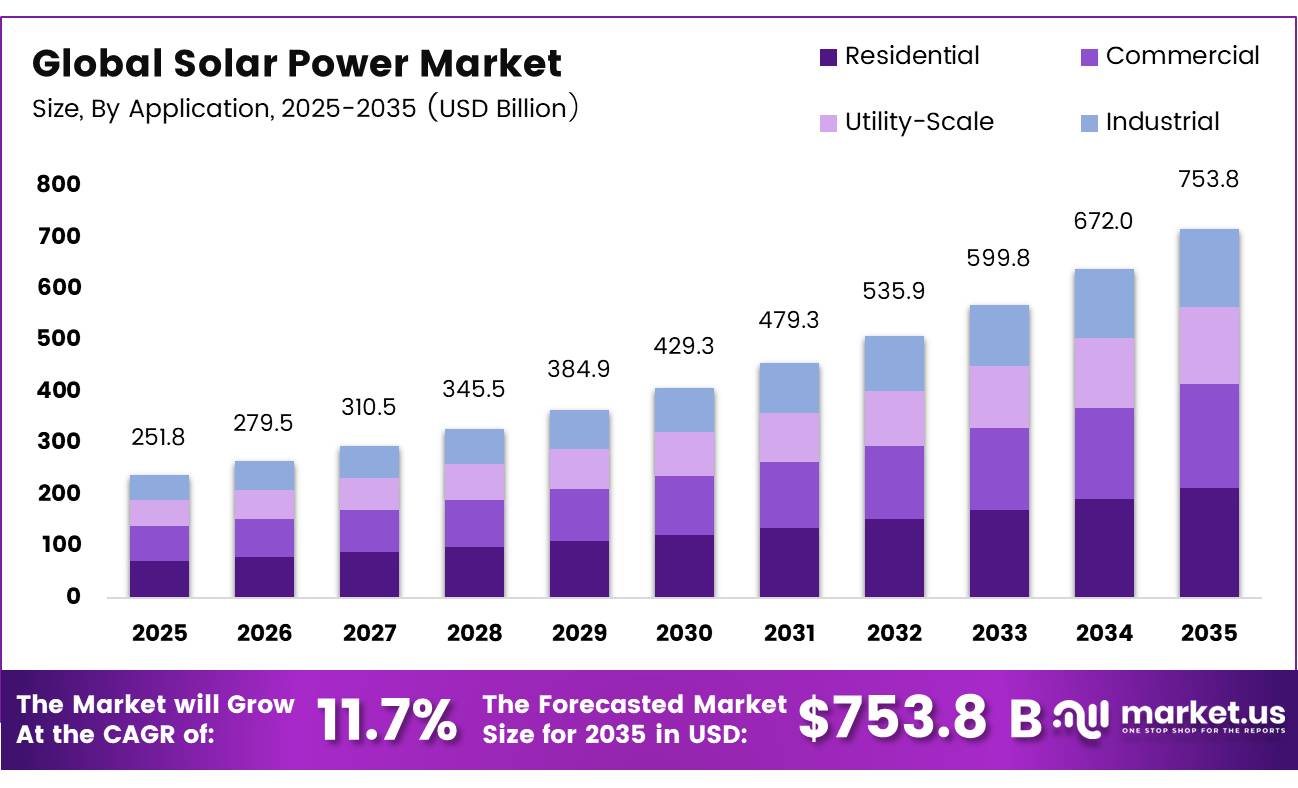
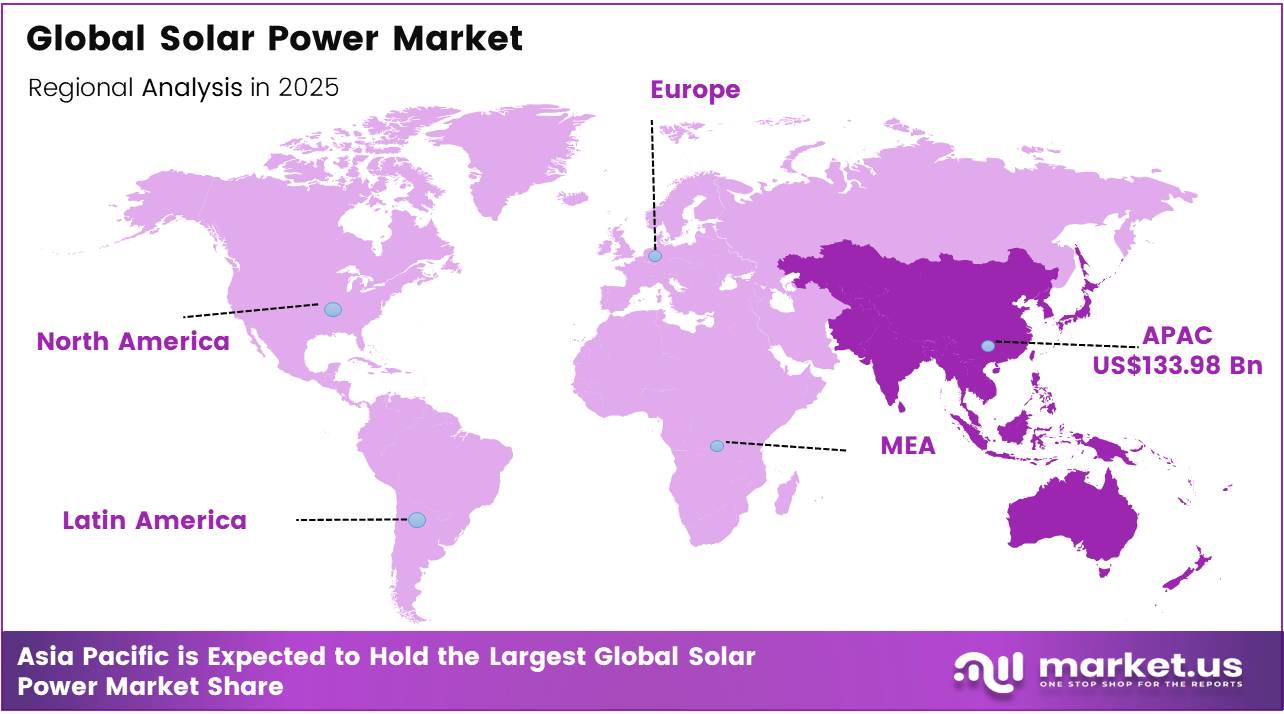
In 2025, the Global Solar Power Market was valued at USD 251.8 billion, and between 2026 and 2035, this market is estimated to register a CAGR of 11.7%, reaching about USD 753.8 billion by 2035. In 2025, Asia Pacific held a dominant market position, capturing more than a 53.20% share, holding USD 133.98 Billion revenue.
Solar Power is one of the most important pillars of the modern energy industry, offering a clean, scalable, and increasingly competitive alternative to conventional electricity generation. The sector includes utility-scale solar farms, rooftop systems, photovoltaic modules, inverters, trackers, storage solutions, and related engineering services.
- In 2025, worldwide solar photovoltaic installations increased by more than 600 GW, raising cumulative operating capacity to around 2,800 GW. This expansion is increasing demand for solar modules, inverters, trackers, mounting structures, engineering services, grid connections, maintenance, and digital plant-management systems.
- Solar PV generation recorded an unprecedented increase of around 600 TWh, bringing total annual output close to 2,700 TWh and lifting its contribution to more than 8% of global electricity generation. This performance shows that solar is moving beyond a supplementary energy source and becoming an important part of utility, commercial, industrial, and residential electricity supply.
Industry investment is being driven by lower module costs, relatively efficient permitting, broad public acceptance, and the need for additional electricity capacity. Global renewable installations reached about 800 GW, representing annual growth of 16%, while wind accounted for around 20% of the additions.
Solar Power remained the leading technology, although grid-connection delays, supply-chain pressures, changing policies, and financing constraints continue to affect project development. Future Solar Power opportunities remain strong across utility-scale farms, residential rooftops, commercial installations, battery-linked projects, smart inverters, power-purchase agreements, and grid modernization.
- The IEA expects renewable capacity to expand by approximately 4,600 GW through 2030, with solar PV contributing nearly 80% of the increase. This outlook supports long-term opportunities for manufacturers, developers, storage providers, transmission operators, software companies, and maintenance-service providers market.
- The European Union’s solar strategy established an objective of more than 380 GW of photovoltaic capacity by 2025 and an ambition of at least 600 GW by the end of the decade. The strategy supports solar-ready buildings and wider rooftop adoption, creating opportunities for installers, equipment suppliers, utilities, storage developers, and energy-service companies.
Key Takeaways
- The global Solar Power market was valued at USD 251.8 billion in 2025.
- The global market is projected to grow at a CAGR of 11.7% and is estimated to reach USD 753.8 billion by 2035.
- On the basis of Technology, the Solar Photovoltaic (PV) dominated the market, constituting 99.70% of the total market share.
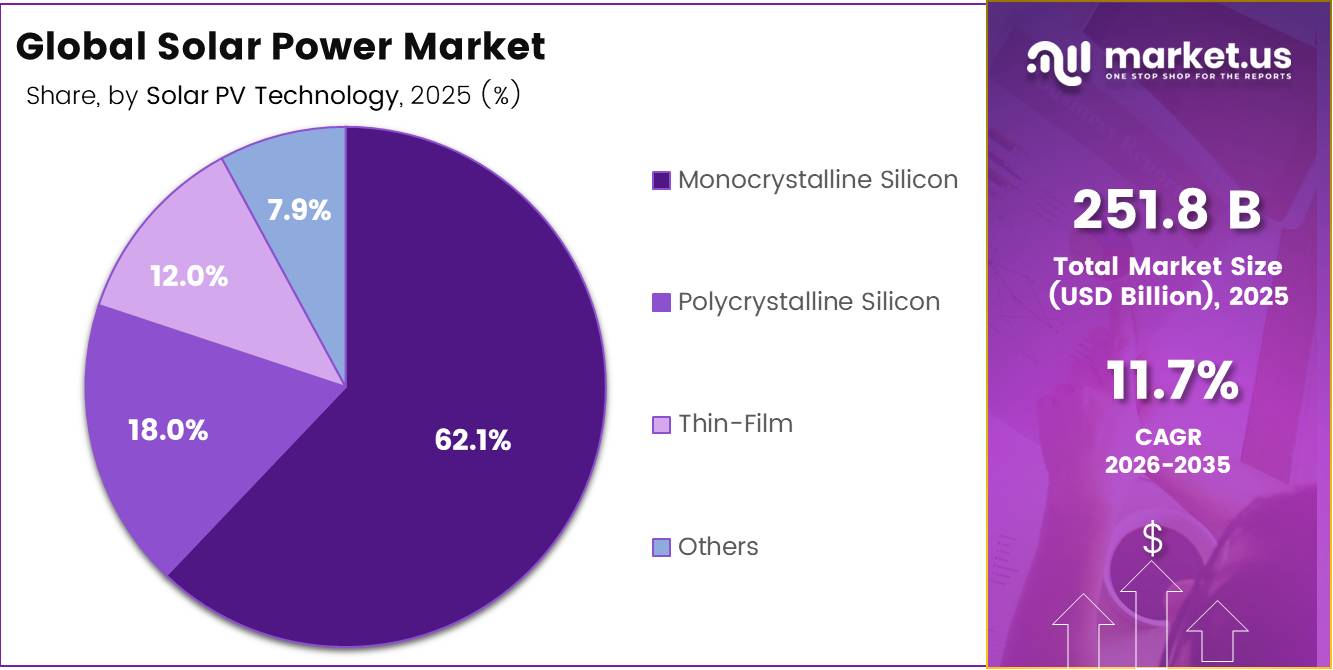
- Based on the By Solar PV Technology, the Monocrystalline Silicon dominated the Solar Power market, with a substantial market share of around 62.1%.
- Based on the Component, Solar Panels led the market, comprising 45.0% of the total market.
- Among the Installation, the Ground-Mounted held a major share in the Solar Power market, 58.7% of the market share.
- Among the Application, the Residential is the most considerable within the market, accounting for around 28.4% of the revenue.
- In 2025, the Asia Pacific was the most dominant region in the Solar Power market, accounting for 53.2% of the total global consumption.
Technology Analysis
Solar Photovoltaic (PV) represents dominant Segment in the Market.
In 2025, Solar Photovoltaic (PV) held the leading market position, capturing more than a 99.70% share. Its dominance reflects its suitability for large solar farms, commercial buildings, homes, and distributed electricity systems.
- The U.S. Energy Information Administration recorded 209,304 MW of total estimated solar PV capacity during the year. Utility-scale solar plants also generated 296,000 GWh of electricity, highlighting PV’s expanding role in mainstream power supply.
Concentrated Solar Power is the growing segment because thermal storage allows plants to supply electricity after sunset and during periods of higher grid demand. The U.S. Department of Energy targets an electricity cost of USD 0.05 per kWh for baseload CSP plants with at least 12 hours of thermal storage. DOE also reports that CSP electricity costs have declined by more than 50%, supporting continued technology development and future deployment.
Solar PV Technology Analysis
Monocrystalline Silicon a significant Solar PV Technology.
Monocrystalline silicon held the leading market position, capturing more than a 62.10% share. Its strong position comes from high power-conversion efficiency, proven reliability, and the ability to generate more electricity from limited installation space.
- The U.S. Department of Energy states that commercially produced silicon modules typically achieve 20% to 22% efficiency, while monocrystalline cells have exceeded 27% under laboratory conditions. Crystalline silicon modules can also operate for more than 25 years, with annual power degradation remaining below 1%.
Thin-film is the growing segment, supported by lightweight designs, flexible surfaces, lower-cost manufacturing potential, and expanding use in tandem and building-integrated solar applications. According to the U.S. Department of Energy, laboratory efficiency for perovskite thin-film cells increased from 3% in 2009 to 28% in 2026. The department has also awarded USD 44 million for thin-film research, manufacturing development, and demonstration projects, strengthening future commercialization opportunities.
Component Analysis
Solar Panels Are the Most Widely Used Separators.
Solar panels held the leading market position, capturing more than a 45.00% share. Panels remain the main electricity-producing component in residential, commercial, and utility-scale solar systems, keeping demand closely connected to new installations.
- The U.S. Energy Information Administration expects nearly 70 GW of solar capacity to begin operating during 2026–2027, increasing U.S. operating solar capacity by 49% compared with the end of 2025. This expansion supports sustained demand for efficient, reliable, and durable solar modules.
Energy Storage Systems are the growing component as developers increasingly pair batteries with solar plants to balance fluctuating output and supply stored electricity when sunlight declines. EIA expects battery capacity in the ERCOT region to increase from approximately 15 GW in 2025 to 37 GW by 2027, highlighting stronger investment in flexible and reliable solar power systems.
Installation Analysis
Ground-Mounted Held a Major Share of the Solar Power Market.
Ground-mounted solar held the leading market position, capturing more than a 58.70% share. Large sites allow developers to install extensive panel arrays, use tracking equipment, and connect projects directly to transmission infrastructure.
- The scale of this segment is reflected in U.S. utility-scale solar PV capacity, which reached 149,798.5 MW in 2025 and increased to 160,601.9 MW by May 2026. This steady expansion continues to support demand for land, modules, trackers, engineering services, and grid infrastructure.
Rooftop solar is the fastest-growing installation type as households and businesses seek greater control over electricity costs and supply reliability. The U.S. Energy Information Administration reported that Puerto Rico had 1,456 MW of rooftop solar capacity at the end of 2025. Around 3,850 systems were installed each month, bringing the total to 191,929 rooftop systems.
Application Analysis
Solar Powers Are Mostly Utilized in Residential segment.
Residential solar held the leading market position, capturing more than a 28.40% share. Its leadership is supported by widespread rooftop availability and growing household interest in producing electricity close to where it is consumed.
- The U.S. Energy Information Administration reported that estimated small-scale residential solar PV capacity reached 40,474.8 MW in 2025 and increased to 42,055.3 MW by May 2026. This represented an additional 1,580.5 MW within five months, showing continued household adoption.
Commercial solar is the fastest-growing application as businesses increasingly use rooftops and carports for on-site electricity generation. EIA data show that small-scale commercial PV capacity increased from 16,031.4 MW in 2025 to 16,945.2 MW by May 2026, adding 913.8 MW. This growth reflects stronger business interest in managing energy costs and using available property more efficiently.
Key Market Segments
By Technology
- Solar Photovoltaic (PV)
- Concentrated Solar Power (CSP)
By Solar PV Technology
- Monocrystalline Silicon
- Polycrystalline Silicon
- Thin-Film
- Others
By Component
- Solar Panels
- Inverters
- Mounting Systems and Trackers
- Energy Storage Systems
- Balance-of-System Components
By Installation
- Ground-Mounted
- Rooftop
- Floating Solar
- Building-Integrated Photovoltaics (BIPV)
- Others
By Application
- Residential
- Commercial
- Industrial
- Utility-Scale
Driver Analysis
Utility-scale PV cost deflation and grid parity
Over 2024–2025, global benchmark prices for utility‑scale solar PV projects have continued to fall, with levelized cost of electricity (LCOE) for large solar farms in high‑irradiance regions trending in the range of roughly 20–40 USD/MWh versus typical wholesale power prices of 50–100 USD/MWh, indicating structural grid parity or cost advantage in most major markets. Module ASPs that spiked in 2022 due to polysilicon shortages retreated through 2024–2025 as polysilicon capacity in China rose, leading to multi‑GW projects being bid at tariffs below conventional coal or gas plants in India, the Middle East, and parts of Latin America, with auction results showing tariff bids under 3 US cents/kWh in several cases.
Balance‑of‑system and soft costs have also dropped on a per‑watt basis as project sizes scale toward 500–1,500 MW clusters, increasing purchasing leverage and reducing EPC overhead per MW; utility‑scale CAPEX in some markets has approached or dipped below 500–600 USD/kW. This cost deflation directly impacts utility procurement strategies: utilities are transitioning from marginal, policy‑forced solar procurement to portfolio‑wide optimization, where solar is treated as a least‑cost resource to meet both energy and capacity needs, encouraging multi‑GW annual tender pipelines.
In North America, the ability to deliver utility‑scale solar below the marginal cost of gas‑fired generation strengthens the case for coal retirements and accelerates interconnection queue reform; in India and China, state‑backed developers deploy tens of GW annually as utility‑scale solar becomes a core pillar of capacity expansion plans, collectively adding several percentage points to the global solar market’s CAGR between 2026 and 2030.
Drivers Impact Analysis
| Driver | (~) % Impact on CAGR | Geographic Relevance | Impact Timeline |
|---|---|---|---|
| Utility-scale PV cost deflation and grid parity | +2.3% | North America core, EU, India, China | Medium term (2–4 years) |
| Policy incentives and decarbonization mandates | +2.7% | North America core, EU, APAC corridors | Short–Medium term (≤ 4 years) |
| Corporate PPAs and industrial decarbonization | +1.9% | North America core, EU, APAC corridors | Medium term (2–4 years) |
| Residential and C&I rooftop solar adoption | +1.6% | North America core, EU, India, Australia | Short–Medium term (≤ 4 years) |
| Storage-integrated solar and grid flexibility | +2.1% | North America core, EU, APAC corridors | Medium–Long term (≥ 3–5 years) |
| Technology advances in high-efficiency modules | +1.5% | China, EU, North America core | Long term (≥ 4 years) |
Restraint Analysis
Polysilicon and critical material price volatility
High‑purity polysilicon capacity remains concentrated in a few Chinese provinces, which collectively supply well over three‑quarters of global demand, creating geographic concentration risk; disruptions from power rationing, environmental inspections, or logistics issues can push lead times from 8–10 weeks toward 16–20 weeks and trigger rapid price spikes that ripple through wafers, cells, and modules.
These commodity swings compress module manufacturers’ gross margins, which in tight auction environments can be thin, forcing either tariff renegotiations or project repricing when EPCs can no longer absorb cost inflation; for developers, EPC budget contingencies are being raised by 5–10 percent to account for commodity risk, inflating turnkey CAPEX per kW and pushing levelized cost of electricity (LCOE) upward by several USD/MWh, enough to make some projects non‑competitive against gas or coal in markets without strong policy support.
Strategically, firms are diversifying supply, signing longer‑term offtake contracts, and pursuing vertical integration into wafers and cells to stabilize input pricing, but this requires significant CapEx potentially hundreds of millions of dollars for new polysilicon or ingot lines concentrating risk on balance sheets. The result is delayed FIDs for marginal projects, reduced appetite for merchant exposure, and tighter credit conditions as lenders stress‑test scenarios with 10–20 percent cost shocks; collectively, this volatility is modeled to shave roughly 2–3 percentage points from global solar CAGR versus a smooth cost‑decline trajectory.
Restraint Impact Analysis
| Restraint | (~) % Impact on CAGR | Geographic Relevance | Impact Timeline |
|---|---|---|---|
| Polysilicon and critical material price volatility | -2.4% | China, EU, North America core, APAC corridors | Short–Medium term (≤ 4 years) |
| Grid integration, transmission congestion, and curtailment | -2.1% | India, EU, US, select APAC corridors | Medium–Long term (≥ 3–5 years) |
| Land acquisition, permitting, and social acceptance barriers | -1.8% | India, EU, Latin America, Africa corridors | Medium term (2–4 years) |
| Trade barriers, tariffs, and localization mandates | -1.9% | US, EU, India, emerging markets | Short–Medium term (≤ 4 years) |
| Discom/utility financial stress and payment delays | -1.7% | India, parts of APAC, selected emerging markets | Medium term (2–4 years) |
| Skilled labour shortages and EPC capacity constraints | -1.5% | North America core, EU, APAC corridors | Short–Medium term (≤ 4 years) |
Opportunity Analysis
Solar-as-a-service and subscription models
Solar‑as‑a‑service and subscription‑based offerings represent a structurally distinct, largely untapped monetization model compared with today’s CAPEX‑heavy ownership and basic PPA frameworks; instead of selling hardware upfront, providers charge recurring usage fees, lease payments, or bundled “energy + services” subscriptions, similar to telecom or SaaS economics. In emerging markets and lower‑income household segments, where upfront system costs of 500–2,000 USD for small rooftop systems remain prohibitive, pay‑as‑you‑go (PAYGO), lease‑to‑own, and usage‑based billing can unlock new TAM by reducing initial cash outlay to tens of dollars per month while keeping margins healthy through standardized portfolios and economies of scale.
Even in developed markets, bundling solar with storage, EV charging, and smart‑home services into a monthly subscription priced at a discount to retail tariffs can shift solar from a capital investment to an operating expense decision, supporting cross‑sell and upsell strategies that push per‑customer lifetime value (LTV) well above hardware‑only models e.g., moving gross margin from 15–25 percent on a one‑off sale to 30–40 percent over 10–15 years via service revenues, maintenance, performance guarantees, and digital monitoring.
Customer acquisition costs (CAC), historically a major drag in residential solar, can fall through standardized offerings and digital channels; if CAC per kW of rooftop capacity is reduced by 20–30 percent via subscription bundles and integrated financing, the economics in previously marginal segments such as rented housing and SMEs becomes attractive.
Opportunity Impact Analysis
| Opportunity | (~) % Potential CAGR | Geographic Relevance | Execution Window |
|---|---|---|---|
| Solar-as-a-service and subscription models | +2.4% | North America core, EU, India, APAC emerging markets | Short–Medium term (≤ 4 years) |
| Distributed energy platforms and P2P trading | +2.1% | EU, North America core, APAC corridors | Medium term (2–4 years) |
| Agrivoltaics and vertical/urban solar formats | +1.8% | EU, Japan, North America core, India | Medium–Long term (≥ 3–5 years) |
| Rural microgrids and productive-use solar | +2.0% | APAC emerging markets, Africa corridors, Latin America | Medium term (2–4 years) |
| Integrated solar-plus-digital O&M and data monetization | +1.7% | North America core, EU, China, APAC corridors | Short–Medium term (≤ 4 years) |
| M&A roll-ups and platform consolidation of fragmented installers | +1.9% | North America core, EU, India, Australia | Medium–Long term (≥ 3–5 years) |
Challenges Analysis
Inventory overhang and price volatility
Excess upstream capacity and inventory overhang in polysilicon, wafers, and modules are creating a persistent, non‑terminal friction that depresses prices, distorts investment signals, and forces solar firms into a “quality‑driven survival” mode rather than an orderly growth trajectory; as of early 2026, industry analyses indicate polysilicon inventories in the range of roughly 570,000–600,000 metric tons, equivalent to around 300–316 GW of downstream module output at consumption rates of about 1,900 MT/GW, meaning the industry is sitting on more than a full year of supply at recent installation levels and facing the risk of sharp price corrections if production discipline falters.
Restructuring cycles, historically spanning 2–4 years in heavy industry and components sectors, are expected to drag on the market’s maximum attainable CAGR by around 1–1.5 percentage points through 2028 as overcapacity is digested and pricing stabilizes; however, they do not freeze sales outright, as demand remains strong, making inventory overhang and price volatility a classic operational challenge rather than a hard restraint.
Challenges Impact Analysis
| Challenge | (~) % CAGR Friction | Geographic Relevance | Mitigation Horizon |
|---|---|---|---|
| Inventory overhang and price volatility | -1.4% | China, APAC manufacturing hubs, EU | Medium term (2–4 years) |
| Grid flexibility and system stability limits | -1.3% | EU regulatory hubs, US, India, APAC corridors | Long term (≥ 4 years) |
| Global supply chain complexity and logistics risk | -1.1% | North America core, EU, APAC logistics corridors | Medium term (2–4 years) |
| Skilled workforce and leadership talent gaps | -1.2% | North America core, EU, APAC growth markets | Long term (≥ 4 years) |
| Policy uncertainty and market cycle reset | -1.0% | US, EU, India, emerging markets | Medium term (2–4 years) |
| Digital, cyber, and data governance risks | -0.9% | North America core, EU, China, APAC corridors | Long term (≥ 4 years) |
Geopolitical Impact Analysis
Geopolitical Realignment and Supply Chain Fragmentation Reshaping Solar Power Manufacturing.
Trade disputes are changing solar power sourcing as governments protect domestic manufacturers and reduce dependence on concentrated Asian supply chains.
- In April 2025, the U.S. Department of Commerce issued final decisions covering solar cells from Cambodia, Malaysia, Thailand, and Vietnam. “All-other” subsidy rates reached 534.67% for Cambodia, 263.74% for Thailand, 124.57% for Vietnam, and 32.49% for Malaysia. These duties may increase procurement uncertainty and push developers to diversify suppliers or secure modules earlier.
Europe is responding through stronger regional manufacturing policies. The European Commission reported that Chinese companies provided at least 75% of global manufacturing capacity across every major photovoltaic supply-chain stage in 2022. Under the Net-Zero Industry Act, the European Union aims to develop manufacturing capacity equal to as much as 40% of its annual net-zero technology deployment needs by 2030. This realignment creates opportunities for regional panel plants, component suppliers, recycling networks, and long-term procurement partnerships, although costs may remain uneven during the transition.
Regional Analysis
Asia Pacific Held the Largest Share of the Global Solar Power Market.
Asia Pacific held the leading market position, capturing more than a 53.20% share. Its dominance is supported by large manufacturing networks, expanding electricity demand, major utility-scale projects, and continued grid investment.
- China’s National Bureau of Statistics reported that national solar power capacity reached 1,201.73 GW at the end of 2025, rising 35.4% from the previous year. Solar electricity generation also increased 39.8% to approximately 1,173.24 TWh, demonstrating the scale of regional deployment and supporting demand for panels, inverters, engineering services, and energy storage.
Europe is the fastest-growing regional market as solar becomes increasingly important for energy security and lower-carbon electricity supply. The European Commission reported that EU solar generation reached a record 275 TWh in 2025, increasing 18%, while newly installed solar capacity totalled 56 GW. This progress is encouraging investment in rooftop systems, utility projects, grids, and flexible power technologies.
Key Regions and Countries Covered
- North America
- The US
- Canada
- Europe
- Germany
- France
- The UK
- Spain
- Italy
- Russia & CIS
- Rest of Europe
- APAC
- China
- Japan
- South Korea
- India
- ASEAN
- Rest of APAC
- Latin America
- Brazil
- Mexico
- Rest of Latin America
- Middle East & Africa
- GCC
- South Africa
- Rest of MEA
Key Players Analysis
Solar Power manufacturers focus on strengthening technology leadership, manufacturing efficiency, and supply chain resilience to remain competitive. A major priority is continuous product innovation, including the development of high-efficiency monocrystalline modules, bifacial panels, advanced cell architectures, and lightweight designs that improve energy yield, durability, and installation flexibility.
Vertical integration across polysilicon, wafers, cells, modules, inverters, and mounting systems helps reduce procurement risks and improve cost visibility during periods of raw material and freight volatility. Strategic capacity expansion, particularly across Asia Pacific, Europe, and North America, enables suppliers to serve growing utility-scale, commercial, and residential demand more effectively.
Manufacturers also emphasize recycling, traceable sourcing, digital performance monitoring, and intellectual property protection, while building long-term partnerships with developers, utilities, distributors, and engineering companies to strengthen customer relationships and secure participation in large solar project pipelines.
The Major Players In The Industry
- LONGi Green Energy Technology Co., Ltd.
- JinkoSolar Holding Co., Ltd.
- Trina Solar Co., Ltd.
- JA Solar Technology Co., Ltd.
- Tongwei Co., Ltd.
- Canadian Solar Inc.
- First Solar, Inc.
- Hanwha Qcells
- Risen Energy Co., Ltd.
- Sungrow Power Supply Co., Ltd.
- Huawei Technologies Co., Ltd.
- SolarEdge Technologies Inc.
- SMA Solar Technology AG
- Tata Power Solar Systems Ltd.
- Waaree Energies Ltd.
Key Development
- In April 2026, LONGi Green Energy announced that its HIBC solar cell reached 13% conversion efficiency, while its related crystalline-silicon module achieved 26.4%, setting new certified efficiency records and strengthening its position in high-performance photovoltaic technology.
- In June 2026, Sungrow launched the SG510HX utility-scale string inverter with 5 kW maximum output, 28% higher power density, and potential LCOE reduction of up to 1%, improving project economics and grid-support capability.
Report Scope
| Report Features | Description |
|---|---|
| Market Value (2025) | USD 251.8 Bn |
| Forecast Revenue (2035) | USD 753.8 Bn |
| CAGR (2026-2035) | 11.7% |
| Base Year for Estimation | 2025 |
| Historic Period | 2020-2024 |
| Forecast Period | 2026-2035 |
| Report Coverage | Revenue Forecast, Market Dynamics, Competitive Landscape, Recent Developments |
| Segments Covered | By Technology (Solar Photovoltaic (PV) and Concentrated Solar Power (CSP)), By Solar PV Technology (Monocrystalline Silicon, Polycrystalline Silicon, Thin-Film and Others), By Component (Solar Panels, Inverters, Mounting Systems and Trackers, Energy Storage Systems and Balance-of-System Components), By Installation (Ground-Mounted, Rooftop, Floating Solar, Building-Integrated Photovoltaics (BIPV) and Others), By Application (Residential, Commercial, Industrial and Utility-Scale) |
| Regional Analysis | North America – The US & Canada; Europe – Germany, France, The UK, Spain, Italy, Russia & CIS, Rest of Europe; APAC– China, Japan, South Korea, India, ASEAN & Rest of APAC; Latin America– Brazil, Mexico & Rest of Latin America; Middle East & Africa– GCC, South Africa, & Rest of MEA |
| Competitive Landscape | LONGi Green Energy Technology Co., Ltd., JinkoSolar Holding Co., Ltd., Trina Solar Co., Ltd., JA Solar Technology Co., Ltd., Tongwei Co., Ltd., Canadian Solar Inc., First Solar, Inc., Hanwha Qcells, Risen Energy Co., Ltd., Sungrow Power Supply Co., Ltd., Huawei Technologies Co., Ltd., SolarEdge Technologies Inc., SMA Solar Technology AG, Tata Power Solar Systems Ltd., Waaree Energies Ltd. |
| Customization Scope | Customization for segments, region/country-level will be provided. Moreover, additional customization can be done based on the requirements. |
| Purchase Options | We have three licenses to opt for: Single User License, Multi-User License (Up to 5 Users), Corporate Use License (Unlimited Users and Printable PDF) |





































