


Report Overview
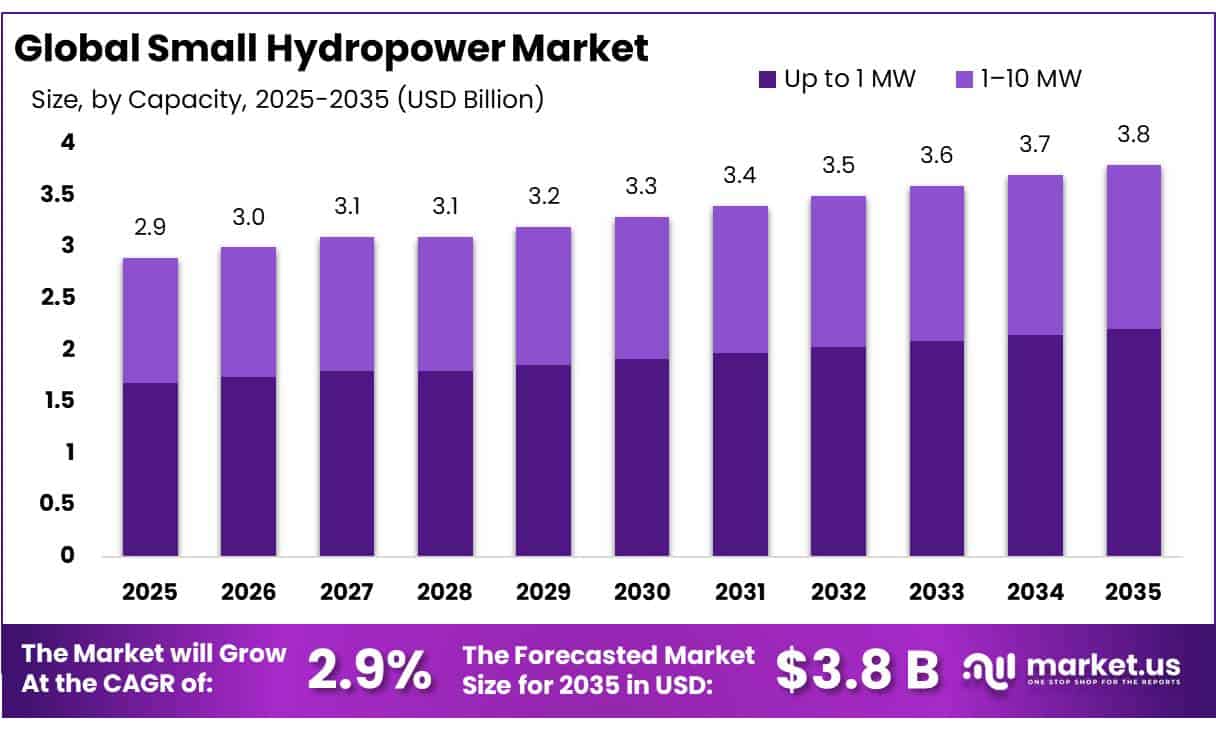
In 2025, the Global Small Hydropower Market valued at USD 2.9 billion, and between 2026 and 2035, this market is estimated to register a CAGR of 2.9%, reaching about USD 3.8 billion by 2035. Asia Pacific held a dominant market position, capturing more than a 45.2% share, holding USD 1.31 billion in revenue.
Small hydropower is an established renewable-energy technology that converts the energy of rivers, streams, canals and existing water infrastructure into electricity, generally with a smaller physical footprint than large reservoir-based projects. The United Nations Industrial Development Organization (UNIDO) generally uses projects of up to 10 MW for international small-hydropower comparison. Its latest comprehensive global assessment estimates installed small hydropower capacity at approximately 79 GW, while about 64% of identified global potential remains undeveloped.
- IRENA reported renewable hydropower capacity of approximately 1,296 GW at the end of 2025, excluding pure pumped storage. Renewable hydropower capacity increased by 18.4 GW during the year. Hydropower also remains important for electricity supply, accounting for around 14% of global electricity generation in 2024, according to the International Energy Agency. These figures support continued investment in turbines, generators, controls and water-management systems.
Key Takeaways
- Small Hydropower Market valued at USD 2.9 billion, and between 2026 and 2035, this market is estimated to register a CAGR of 2.9%, reaching about USD 3.8 billion by 2035.
- Up to 1 MW held a dominant market position, capturing more than a 58.1% share.
- Micro Hydropower held a dominant market position, capturing more than a 72.1% share.
- Civil Works/Construction held a dominant market position, capturing more than a 34.1% share.
- Run-of-River held a dominant market position, capturing more than a 55.1% share.
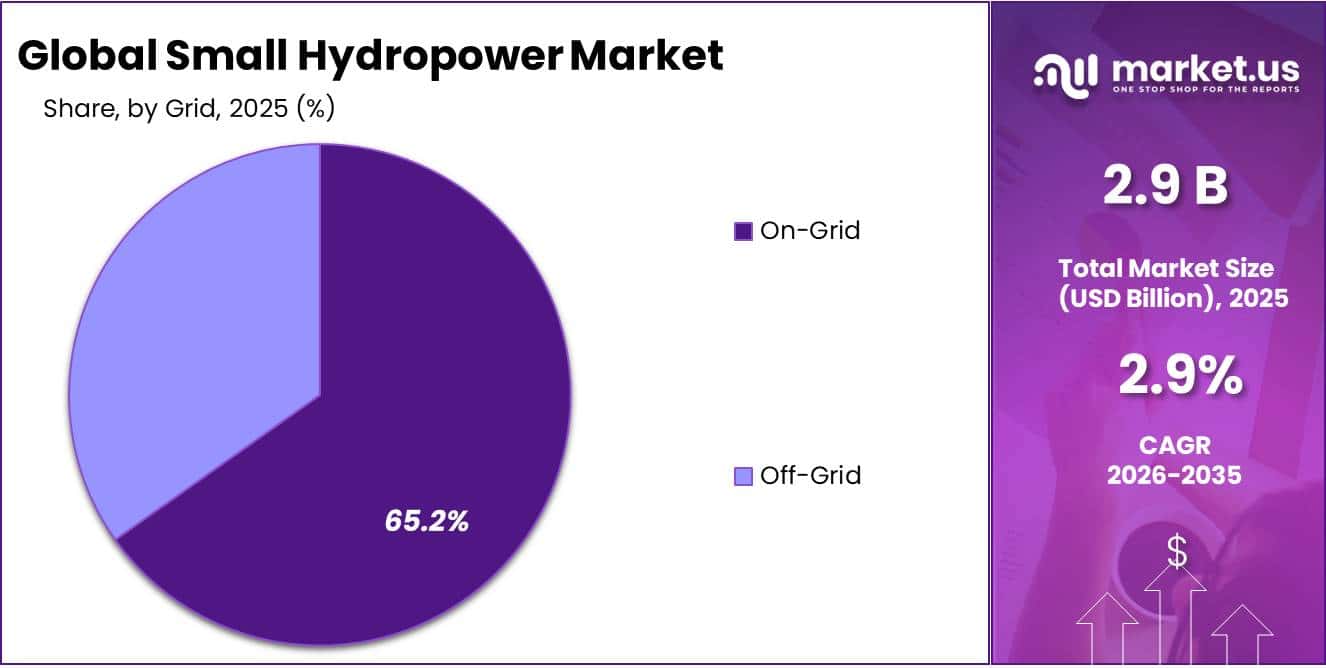
- On-Grid held a dominant market position, capturing more than a 65.2% share.
- Utilities & IPPs held a dominant market position, capturing more than a 62.9% share.
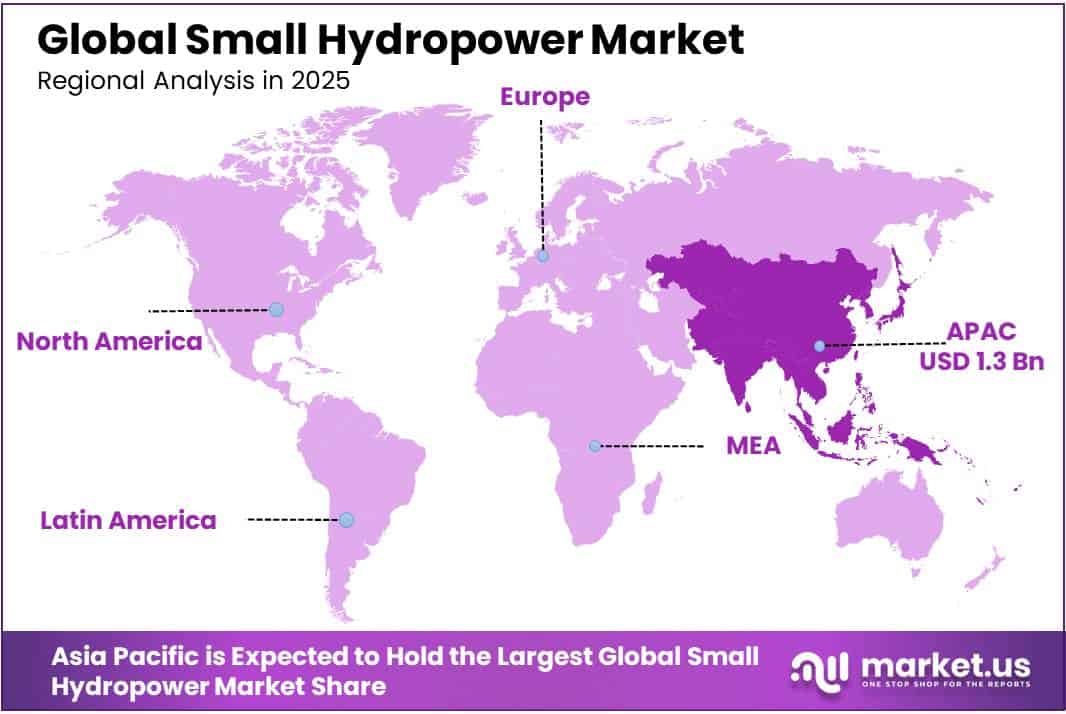
- Asia Pacific held a dominant market position, capturing more than a 45.2% share, valued at approximately USD 1.31 Billion.
The development opportunity is particularly visible in underserved regions. UNIDO estimates Africa has approximately 729 MW of installed small hydropower capacity against potential of about 15,714 MW. The Americas have approximately 6,937 MW installed against estimated potential of 25,294 MW. Such gaps create opportunities for run-of-river facilities, rehabilitation of older sites and generation from existing dams and water channels.
- The International Hydropower Association reported that worldwide hydropower capacity expanded by 28 GW in 2025, while the global development pipeline reached approximately 1,127 GW. Within that pipeline, pumped-storage projects account for around 621 GW, illustrating how water-based power is increasingly valued for flexibility as variable renewable generation expands.
Government initiatives are improving project economics and supporting modernization. The U.S. Department of Energy’s Hydroelectric Incentives program oversees more than USD 750 million in investment and includes support for qualifying small hydroelectric projects of up to 20 MW in areas with inadequate electricity service. Separately, nearly USD 430 million is being advanced for hydropower facility improvements, helping stimulate wider investment in equipment modernization and resilience.
Policy support is also visible in Europe, where the revised Renewable Energy Directive establishes a binding renewable-energy target of at least 42.5%, with an ambition to reach 45% by 2030. Such targets can support investment in existing hydro upgrades, low-head projects and decentralized renewable generation where environmental and permitting requirements can be satisfied.
Future growth opportunities are expected to concentrate on existing water infrastructure, canal-based installations, plant modernization, digital controls and distributed generation for underserved communities. The World Bank approved a USD 150 million concessional credit for small hydropower development in Uzbekistan, targeting up to 150 MW of supported capacity and more than 520 GWh of annual green electricity. At the broader industry level, the IEA expects more than 154 GW of new hydropower capacity to come online globally from 2025 to 2030, reinforcing long-term opportunities for small-hydro equipment suppliers, developers and engineering-service providers.
By Capacity Analysis
Up to 1 MW dominates the Small Hydropower Market with a 58.1% share.
In 2025, Up to 1 MW held a dominant market position, capturing more than a 58.1% share. This segment benefits from easier installation at small rivers, irrigation channels, municipal water networks and existing water infrastructure. Smaller systems are especially useful where electricity is required close to the point of consumption, reducing the need for major dams and extensive transmission infrastructure.
- Government-backed research also supports the practical use of this capacity range. In April 2026, the U.S. Department of Energy’s Oak Ridge National Laboratory stated that most in-conduit hydropower projects operate below 1 MW. ORNL reported 337 operating in-conduit hydropower facilities in the U.S., with combined capacity of 836 MW. It also identified around 1.41 GW of potential new conduit hydropower capacity. These conditions support continued deployment of compact turbines in municipal, agricultural and industrial water systems.
1–10 MW capacity is increasingly used for run-of-river plants, existing-dam upgrades and small utility-scale hydropower facilities. Projects in this range can provide more electricity than micro installations while remaining suitable for locations where very large dams are unnecessary or impractical. The segment also benefits from established turbine technology, long operating life and its ability to provide predictable renewable electricity where suitable water resources are available.
By Type Analysis
Micro Hydropower dominates the Small Hydropower Market with a 72.1% share.
In 2025, Micro Hydropower held a dominant market position, capturing more than a 72.1% share. Micro hydropower systems are widely suited to homes, farms, remote settlements and small communities because they can generate electricity from relatively small and continuous water flows. The U.S. Department of Energy defines micro hydropower plants as systems with capacity of up to 100 kW, showing their strong fit for localized electricity generation where larger power infrastructure may not be practical.
- Government-backed technology development is also improving the outlook for this segment. In 2025, the U.S. Department of Energy selected 12 technology developers to test new hydropower technologies. One selected project focused specifically on microhydro turbine systems operating at 10-to-100-kW scale for remote areas, small communities and off-grid applications. This development supports greater use of compact and efficient micro hydropower systems.
Mini Hydropower is increasingly used where electricity requirements are higher than micro-scale systems can serve but where large hydropower facilities are not required. These plants are well suited to river-based generation, regional grids and rural electrification because they can provide steady renewable electricity with relatively established turbine and generator technologies. The U.S. Department of Energy identifies small hydropower projects within the 100 kW to 10 MW range, supporting the wider commercial operating space in which mini hydropower projects are commonly developed.
By Component Analysis
Civil Works/Construction dominates the Small Hydropower Market with a 34.1% share.
In 2025, Civil Works/Construction held a dominant market position, capturing more than a 34.1% share. Civil construction forms the physical base of a small hydropower plant, covering water-intake structures, powerhouses, foundations, channels, access works, and water-conveyance systems. These activities remain important because many small hydro projects are developed by upgrading existing water infrastructure or adding generation facilities to irrigation and canal systems.
- A 2025 U.S. Bureau of Reclamation assessment provides a practical example of this construction requirement. The agency evaluated a new 3 MW hydropower facility at the Pishkun Supply Canal, where construction includes a new drop structure, powerhouse, intake structure, and penstock. The project also includes around 5 miles of new powerlines, while construction is scheduled to begin during the 2025–2026 winter period. Such projects show why civil works remain a major part of small hydropower development expenditure.
Electromechanical Equipment plays a central role in converting water flow into usable electricity and includes turbines, generators, governors, control systems, transformers, and automation equipment. Demand for these systems is being supported by both new small hydropower installations and the modernization of older plants. Modern equipment can improve operating efficiency, reduce maintenance requirements, and allow plant operators to respond more effectively to changing water flows and electricity demand.
By Technology Analysis
Run-of-River dominates the Small Hydropower Market with a 55.1% share.
In 2025, Run-of-River held a dominant market position, capturing more than a 55.1% share. The technology is widely suitable for small hydropower because it uses the natural movement and elevation drop of flowing water, reducing dependence on large storage reservoirs. The U.S. Department of Energy states that run-of-river, also known as diversion hydropower, channels part of a river through a canal or penstock to produce electricity and may operate without a dam. This makes the technology suitable for smaller rivers, canals and distributed power projects.
- Government data also show active small-scale use of this technology. In 2025, the U.S. Federal Energy Regulatory Commission reported that the Upper Greenwich hydropower project operates in run-of-river mode with 600 kW of installed capacity, while the Middle Greenwich project has 300 kW capacity. These projects demonstrate the practical role of run-of-river systems in small-scale electricity generation.
Reservoir/Storage technology remains important for small hydropower plants where water needs to be retained before passing through turbines. These systems can provide more control over water availability than purely flow-dependent installations and can help maintain electricity production when river flows change. The technology is particularly useful at existing dams, small impoundments and water-management infrastructure where hydropower equipment can be integrated without developing a completely new water system.
By Grid Analysis
On-Grid dominates the Small Hydropower Market with a 65.2% share.
In 2025, On-Grid held a dominant market position, capturing more than a 65.2% share. Grid-connected small hydropower plants remain widely preferred because they can supply renewable electricity directly into utility networks while providing stable generation alongside wind and solar power. These projects can be developed at rivers, existing dams, canals, and other water infrastructure, allowing utilities to expand renewable electricity supply without depending entirely on new large-scale reservoirs.
- Government statistics highlight the strong operating base available for grid-connected hydropower. In 2025, the U.S. had around 79,892 MW of conventional hydroelectric net summer generation capacity, while conventional hydropower produced approximately 247 billion kWh of electricity. In 2026, the U.S. Department of Energy also estimated that adding hydropower generation to existing non-powered dams could provide another 4.8 GW of reliable renewable electricity to the grid. These figures support continued opportunities for grid-connected small hydropower development.
Off-Grid small hydropower provides an important electricity option for rural and remote locations where extending the main transmission network is difficult or expensive. These systems can operate independently or as part of local mini-grids, using nearby rivers and streams to supply households, public facilities, farms, and small businesses. In 2025, UNIDO highlighted small hydropower as a primary electricity source in rural and off-grid areas, particularly for supporting mini-grids, agricultural activities, and local industries.
By End-Use Analysis
Utilities & IPPs dominate the Small Hydropower Market with a 62.9% share.
In 2025, Utilities & IPPs held a dominant market position, capturing more than a 62.9% share. Utilities and independent power producers remain major users of small hydropower because these projects provide stable renewable electricity and can complement variable solar and wind generation. Small plants can also be developed at existing dams, canals, and other water infrastructure, helping power producers expand renewable generation without constructing large reservoirs.
Government data show the importance of hydropower within utility electricity supply. In 2025, U.S. conventional hydropower generated approximately 245 billion kWh of electricity. The U.S. Energy Information Administration expects output to reach about 259 billion kWh in 2026. In addition, the U.S. Department of Energy’s Hydroelectric Production Incentive Program provides payments to qualified facilities for electricity that is generated and sold, directly supporting commercial hydropower operators and independent producers.
Industrial end users are increasingly considering small hydropower for on-site generation, particularly where factories and processing facilities already operate pressurized water pipelines, discharge systems, or other water-conveyance infrastructure. Such installations can recover energy from existing water flows, helping industrial operators reduce dependence on externally supplied electricity while making better use of existing infrastructure.
Key Market Segments
By capacity
- Up to 1 MW
- 1–10 MW
By Type
- Micro Hydropower
- Mini Hydropower
By Component
- Civil Works/Construction
- Electromechanical Equipment
- Electric Infrastructure
- Others (Penstock, Valves, O&M)
By Technology
- Run-of-River
- Reservoir/Storage
- In-Stream & Conduit
- Pumped/Other
By Grid
- On-Grid
- Off-Grid
By End-use
- Utilities & IPPs
- Industrial
- Commercial
- Residential & Rural Electrification
- Agriculture & Irrigation
Driver Analysis
Sovereign SHP Funding and Capital Subsidy Programs
India’s Union Cabinet approved a dedicated Small Hydro Power Development Scheme covering FY2026–27 through FY2030–31 with a total outlay of INR 2,584.60 crore, targeting roughly 1,500 MW of new capacity and projected to generate 51 lakh person-days of employment. The subsidy structure is tiered by geography: North Eastern states and international border districts receive financial assistance of INR 3.6 crore per MW or 30% of project cost, capped at INR 30 crore per project, while other regions receive INR 2.4 crore per MW or 20% of cost, capped at INR 20 crore. Administrative approval for implementation across the 1 MW to 25 MW capacity band was formally issued in May 2026, with the scheme window running to March 2031.
A separate INR 30 crore allocation funds Detailed Project Reports for a minimum of 200 projects, directly de-risking the pre-construction pipeline that historically stalled SHP bankability. Structurally, this shifts project economics from pure merchant-tariff dependency toward blended public-private capital stacks, materially compressing payback periods on projects in the 1,300 to 8,000 USD/kW cost band typical for small hydro, and is expected to pull forward capacity additions that would otherwise be deferred into the next decade.
Drivers Impact Analysis
| Driver | (~) % Impact on CAGR | Geographic Relevance | Impact Timeline |
|---|---|---|---|
| Sovereign SHP funding schemes and capital subsidy programs | +1.4% | India core, North East India/border states, Southeast Asia spill-over | Short term (≤2 years) |
| Non-powered dam (NPD) and brownfield retrofit monetization | +1.1% | North America core, Western Europe, China secondary | Medium term (2–4 years) |
| Grid-balancing demand from intermittent solar/wind penetration | +0.9% | EU core, APAC corridors, North America | Medium term (2–4 years) |
| EU permitting acceleration under RED III and acceleration-area designation | +0.7% | EU core (Germany, France, Italy, Nordics) | Short term (≤2 years) |
| Rural electrification and mini-grid financing (Mission 300, decentralized access programs) | +1.0% | Sub-Saharan Africa core, South Asia spill-over, South America spill-over | Long term (≥4 years) |
| Low-head/variable-speed turbine and digital O&M technology adoption | +0.6% | Global, concentrated in EU and North America manufacturing hubs, APAC deployment | Long term (≥4 years) |
Restraint Analysis
Environmental Litigation and Dam-Removal Momentum
Europe’s dam-removal movement has shifted from advocacy to executed policy, with over 500 river barriers removed across the continent in 2024 following the EU’s binding restoration law taking effect that year, and a further roughly 600 barriers dismantled in 2025, reconnecting an estimated 3,740 kilometers of previously fragmented river channel; because the EU Water Framework Directive prioritizes preserving “good ecological status” over incremental generation capacity, new SHP projects proposed on already-healthy river stretches face a structurally higher probability of rejection or multi-year appeal, and cumulative-impact assessments now increasingly applied to clusters of small plants on a single river system rather than each project in isolation are extending pre-construction risk assessment timelines by an estimated 12 to 18 months per contested site, which compounds financing costs through extended interest-during-construction charges and can push project-level IRR down by 150 to 250 basis points versus an uncontested greenfield build, ultimately deterring capital allocation toward EU river systems even as North American NPD retrofit activity partially offsets the regional drag.
Restraint Impact Analysis
| Restraint | (~) % Impact on CAGR | Geographic Relevance | Impact Timeline |
|---|---|---|---|
| Environmental litigation and dam-removal momentum under EU Water Framework Directive | -1.3% | EU core (Germany, France, Nordics), North America secondary | Medium term (2–4 years) |
| Construction commodity inflation (steel, copper, cement) | -1.1% | Global, most acute in South Asia/India, APAC manufacturing corridors | Short term (≤2 years) |
| Hydrological variability and climate-driven drought/flow disruption | -1.5% | South Asia, Sub-Saharan Africa, Southern Europe, South America | Long term (≥4 years) |
| Fragmented, multi-agency permitting and grid-interconnection delays | -0.8% | North America core, South Asia, Africa | Short term (≤2 years) |
| High-quality site exhaustion and diminishing greenfield resource pool | -0.9% | EU core, East Asia (China, Japan), North America | Long term (≥4 years) |
| Financing cost sensitivity to interest rate and currency volatility | -0.7% | Emerging markets (Africa, South Asia, Latin America) core, global secondary | Medium term (2–4 years) |
Opportunity Analysis
Green Hydrogen Electrolysis Co-Location
Co-locating electrolyzers directly at SHP sites to produce green hydrogen is not a current driver but a prospective new monetization model that converts curtailed or low-tariff SHP electricity into a higher-value chemical feedstock, effectively creating a second revenue stream from the same generation asset rather than depending solely on grid tariff realization; standalone green hydrogen production costs in India currently range from 4.4 to 4.8 USD/kg, with a policy-driven cost decline to roughly 2.4 USD/kg projected by 2030 as electrolyzer capex and renewable input costs fall, while several Indian states already offer capital subsidies of 25% to 35% specifically for renewable-linked hydrogen projects that reduce effective power costs by 20–22%.
Because SHP plants particularly those in remote hill and border regions with limited grid evacuation infrastructure often face curtailment or below-cost merchant tariffs, redirecting that otherwise-stranded generation into on-site electrolysis for local industrial or fertilizer offtake could convert a stranded-asset problem into a captive, higher-margin demand contract; this is a genuine white space because current market forecasts do not yet price in electrolyzer co-location, and the technology-cost curve (green hydrogen still carrying a 1.6 to 3.2 USD/kg premium over grey hydrogen) means the opportunity only becomes commercially unlocked in the second half of this decade as electrolyzer capex continues its projected decline.
Opportunity Impact Analysis
| Opportunity | (~) % Potential CAGR Upside | Geographic Relevance | Execution Window |
|---|---|---|---|
| Irrigation-canal and hydrokinetic dual-use monetization | +1.6% | South Asia core (India, Pakistan), APAC secondary | Medium term (2–4 years) |
| Green hydrogen electrolysis co-location at SHP sites | +1.2% | India, EU, East Africa | Long term (≥4 years) |
| Carbon credit and Renewable Energy Certificate stacking | +0.8% | Sub-Saharan Africa core, Latin America, South/Southeast Asia | Short term (≤2 years) |
| Digital twin/AI-enabled fleet management-as-a-service | +0.9% | Global, EU and North America first-mover, APAC scale-up | Medium term (2–4 years) |
| M&A roll-up of fragmented independent SHP asset portfolios | +1.1% | EU core, North America, India | Medium term (2–4 years) |
| Pumped-hydro/municipal water-supply hybrid storage integration | +1.0% | EU (Italy, Alps corridor), APAC, North America | Long term (≥4 years) |
Challenges Analysis
Multi-Year Permitting & EIA Cycles
The structural vulnerability stems from fragmented, multi-agency approval architecture in the United States, FERC licensing and exemption processing for low-impact facilities typically consumes 18 to 24 months, while comparable environmental impact assessment, water-use permission, and stakeholder consultation cycles in India and the EU frequently extend total pre-construction timelines by two to three years; this quantitatively compounds into an estimated 150 to 300 basis points of internal rate of return erosion per project due to extended pre-revenue carrying costs, idle capital deployment, and re-baselined engineering estimates that must be refreshed after regulatory delay windows exceeding 12 months, forcing sponsors to adopt phased-permitting strategies, parallel-track environmental studies, and dedicated regulatory-affairs teams embedded at the state or federal level to compress approval variance by an estimated 20-30% over a three-to-four-year horizon.
Challenges Impact Analysis
| Challenge | (~) % CAGR Friction Drag | Geographic Relevance | Mitigation Horizon |
|---|---|---|---|
| Multi-Year Permitting & EIA Cycles | -0.9% | North America (FERC licensing), EU regulatory hubs, India state clearances | Medium term (2-4 years) |
| Rural Skilled Manpower Deficit | -0.7% | APAC rural corridors (India, Nepal, Southeast Asia), Sub-Saharan Africa | Long term (≥ 4 years) |
| Hydrological Data & Site Variability Risk | -0.6% | Himalayan basin (India, Nepal, Bhutan), Andean region, Alpine Europe | Long term (≥ 4 years) |
| Civil Works Cost & Component Inflation | -0.8% | Global, acute in APAC logistics corridors and Latin America | Medium term (2-4 years) |
| Grid Interconnection & Transmission Bottlenecks | -0.5% | Remote APAC and African off-grid zones, rural EU/North America feeders | Medium term (2-4 years) |
| Climate-Driven Flow Volatility & Siltation | -0.6% | South Asia monsoon belt, East Africa, Andean glacial-fed rivers | Long term (≥ 4 years) |
Geopolitical Impact Analysis
The ongoing Russia–Ukraine war and Middle East conflicts are reshaping the Small Hydropower Market by increasing energy-security concerns, disrupting equipment supply chains and encouraging investment in decentralized renewable power. Small hydropower can support local grids because projects can operate close to demand centres and reduce dependence on imported fuels. The IEA reported in 2025 that Ukraine’s available dispatchable generation capacity fell from about 38 GW to 12 GW after attacks, highlighting the value of resilient distributed generation.
- In February 2026, the World Bank estimated Ukraine’s total reconstruction and recovery requirement at USD 588 billion over the next decade. Energy infrastructure remains a rebuilding priority, which can support investment in renewable assets, grid rehabilitation and generation.
Conflict-driven shipping disruption is increasing project risk. UNCTAD reported in March 2026 that ship transits through the Strait of Hormuz had fallen to a near halt and Brent crude moved above USD 90 per barrel. Higher fuel, freight and logistics costs can raise turbine, generator and construction expenses. The European Commission reported Russian gas represented 12% of EU gas imports in 2025, strengthening the case for domestic renewable sources, including small hydropower.
Regional Insights
Asia Pacific leads the Small Hydropower Market with a 45.2% share, reaching approximately USD 1.31 Billion.
In 2025, Asia Pacific held a dominant market position, capturing more than a 45.2% share, valued at approximately USD 1.31 Billion. The region benefits from a strong base of small hydropower projects, particularly across East and Southeast Asia.
- UNIDO reports that Asia has 50,406 MW of installed small hydropower capacity of up to 10 MW against 139,946 MW of identified potential. China represents more than 83% of Asia’s installed capacity. In addition, IRENA reported that renewable hydropower capacity increased globally by 18.4 GW in 2025, with 96% of the increase coming from China.
The regional landscape of the Small Hydropower Market is influenced by available river resources, rural electrification programs, renewable-energy policies, and investment in decentralized power generation. Asia Pacific remains the leading market due to its established hydropower infrastructure and large undeveloped resource base. Africa, meanwhile, is positioned for faster expansion as governments and development institutions increase investment in mini-grids, rural electricity access, and renewable power infrastructure.
Key Regions and Countries Insights
- North America
- US
- Canada
- Europe
- Germany
- France
- The UK
- Spain
- Italy
- Rest of Europe
- Asia Pacific
- China
- Japan
- South Korea
- India
- Australia
- Rest of APAC
- Latin America
- Brazil
- Mexico
- Rest of Latin America
- Middle East & Africa
- GCC
- South Africa
- Rest of MEA
Key Players Analysis
Voith GmbH & Co. KGaA remains a major hydropower technology supplier, with turbines installed in thousands of plants worldwide. In fiscal 2024/25, the Voith Group recorded EUR 4.846 billion in sales, EUR 5.447 billion in orders received, and employed 20,751 people. Its hydro position is supported by a large service base and modernization activity. In Africa alone, Voith Hydro reports 9,900 MW of installed capacity across 27 countries, supplying electricity that benefits around 30 million people and emerging markets.
ANDRITZ AG strengthened its hydropower business in 2025 as utilities increased investment in renewable generation and storage. Hydropower order intake reached EUR 2.516 billion, rising 15.9% from the previous year, while hydropower revenue increased 12.5% to EUR 1.730 billion. The business represented 22% of group revenue and 43% of the year-end order backlog. In Q1 2026, hydropower order intake accelerated further to EUR 1.877 billion, showing strong project demand across several international markets. This strengthens its position in hydropower equipment.
Siemens Energy AG serves the small hydropower industry through integrated hydro systems, automation, electrical equipment, modernization, and grid solutions. Its hydropower technologies are used in more than 1,000 plants worldwide and support over 5,000 MW of electrical capacity. In fiscal 2025, Siemens Energy generated EUR 39.1 billion in revenue, while order intake reached EUR 58.9 billion and backlog climbed to EUR 138 billion. This large engineering and service base supports hydro upgrades, digital controls, and grid-connected renewable projects.
Top Key Players Outlook
- Voith GmbH & Co. KGaA
- ANDRITZ AG
- GE Vernova
- Siemens Energy AG
- Toshiba Energy Systems & Solutions Corporation
- Bharat Heavy Electricals Limited (BHEL)
- Gilbert Gilkes & Gordon Ltd. (Gilkes)
- FLOVEL Energy Private Limited
- Mavel, a.s.
- Natel Energy, Inc.
- Kolektor Turboinstitut (Kolektor Group)
- AtkinsRéalis
- Hitachi Mitsubishi Hydro Corporation
- Dongfang Electric Corporation
- Ossberger GmbH + Co. KG
- Others
Recent Developments
- In April 2026, Hitachi Mitsubishi Hydro Corporation had around 650 employees, JPY 2 billion in capital, and ownership of 50% Hitachi, 30% Mitsubishi Electric, and 20% Mitsubishi Heavy Industries.
- In April 2026, Gilkes won another Japanese hydropower contract in partnership with a renewable-energy developer for a 1 MW run-of-river project using a 22.5-inch twin-jet Turgo turbine; the company had by then exported more than 20 turbines to Japan and was also assembling a 6.7 MW Turgo unit.
- In February 2026, GE Vernova completed the acquisition of the remaining 50% of Prolec GE for USD 5.275 billion; although this deal is focused on grid equipment rather than hydropower, it broadens the company’s electricity infrastructure capabilities.
Report Scope
| Report Features | Description |
|---|---|
| Market Value (2025) | USD 2.9 Bn |
| Forecast Revenue (2035) | USD 3.8 Bn |
| CAGR (2026-2035) | 2.9% |
| Base Year for Estimation | 2025 |
| Historic Period | 2020-2024 |
| Forecast Period | 2026-2035 |
| Report Coverage | Revenue Forecast, Market Dynamics, Competitive Landscape, Recent Developments |
| Segments Covered | By capacity (Up to 1 MW, 1–10 MW), By Type (Micro Hydropower, Mini Hydropower), By Component (Civil Works/Construction, Electromechanical Equipment, Electric Infrastructure, Others (Penstock, Valves, O&M)), By Technology (Run-of-River, Reservoir/Storage, In-Stream And Conduit, Pumped/Other), By Grid (On-Grid, Off-Grid), By End-use (Utilities And IPPs, Industrial, Commercial, Residential And Rural Electrification, Agriculture And Irrigation) |
| Regional Analysis | North America – US, Canada; Europe – Germany, France, The UK, Spain, Italy, Rest of Europe; Asia Pacific – China, Japan, South Korea, India, Australia, Singapore, Rest of APAC; Latin America – Brazil, Mexico, Rest of Latin America; Middle East & Africa – GCC, South Africa, Rest of MEA |
| Competitive Landscape | Voith GmbH & Co. KGaA, ANDRITZ AG, GE Vernova, Siemens Energy AG, Toshiba Energy Systems & Solutions Corporation, Bharat Heavy Electricals Limited (BHEL), Gilbert Gilkes & Gordon Ltd. (Gilkes), FLOVEL Energy Private Limited, Mavel, a.s., Natel Energy, Inc., Kolektor Turboinstitut (Kolektor Group), AtkinsRéalis, Hitachi Mitsubishi Hydro Corporation, Dongfang Electric Corporation, Ossberger GmbH + Co. KG, Others |
| Customization Scope | Customization for segments, region/country-level will be provided. Moreover, additional customization can be done based on the requirements. |
| Purchase Options | We have three licenses to opt for: Single User License, Multi-User License (Up to 5 Users), Corporate Use License (Unlimited User and Printable PDF) |





































