


Report Overview
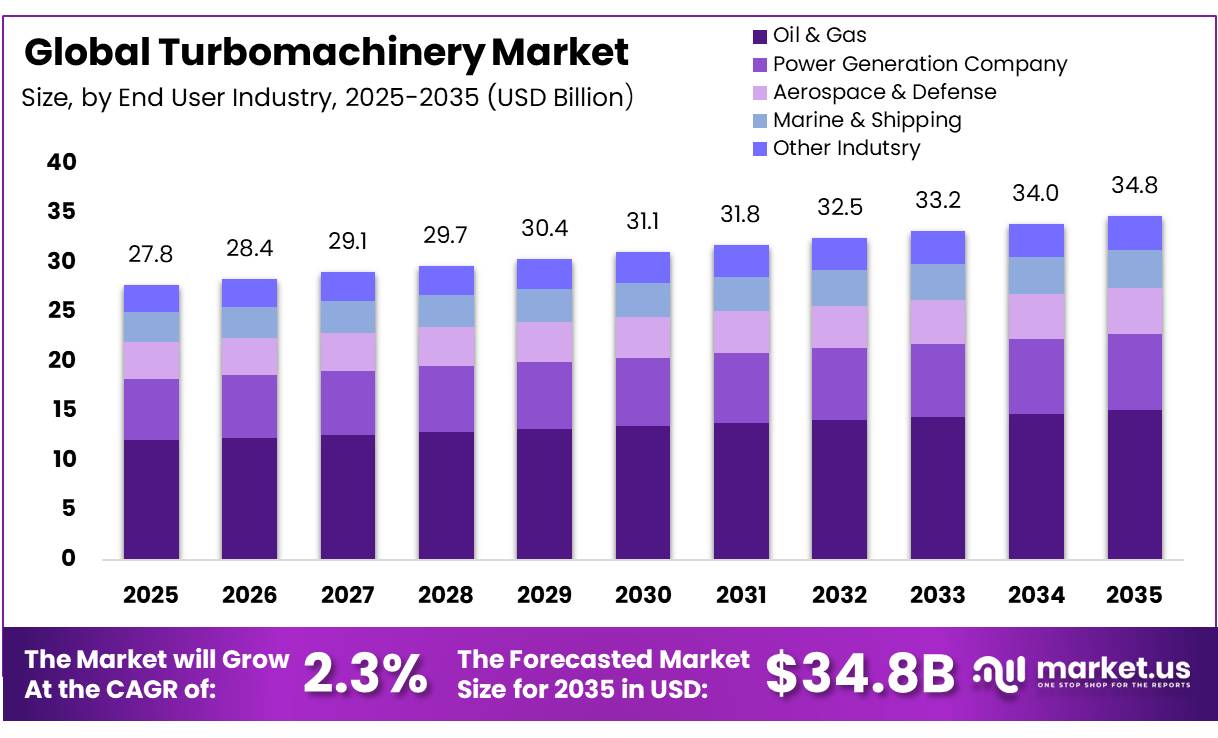
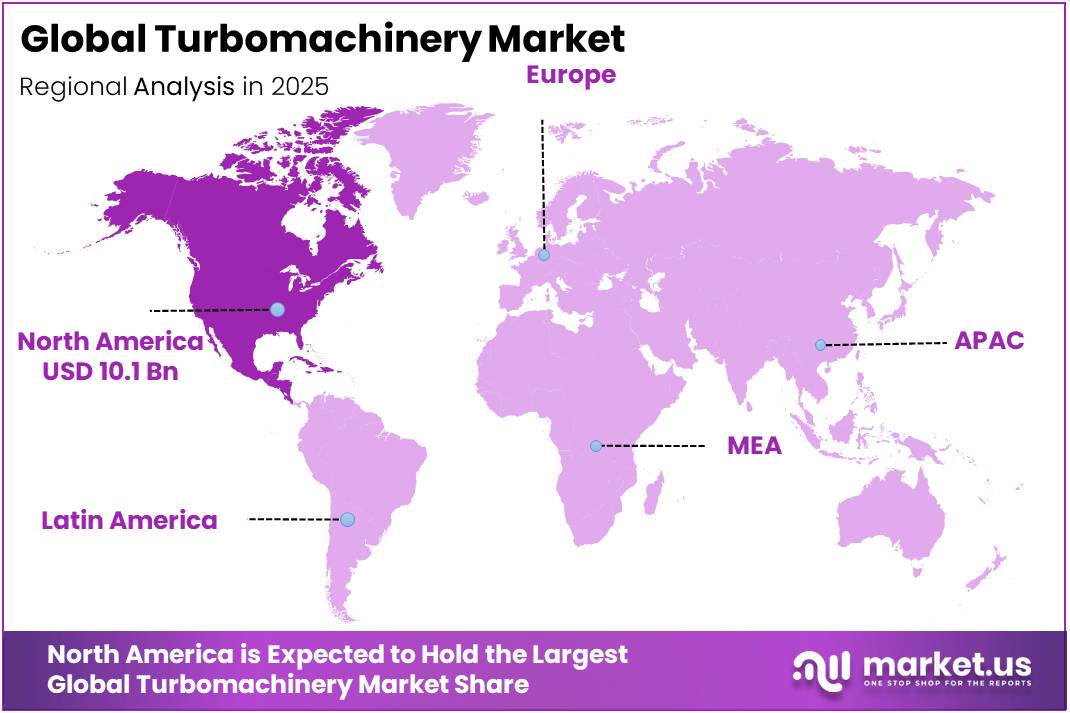
In 2025, the Global Turbomachinery Market was valued at USD 27.8 billion, and between 2026 and 2035, this market is estimated to register a CAGR of 2.3%, reaching about USD 34.8 billion by 2035. North America held a dominant market position, capturing more than a 36.34% share, holding USD 10.1 billion in revenue.
The turbomachinery market includes turbines, pumps, compressors, fans, blowers, and related rotating systems used to produce or consume mechanical power. It supports electricity generation, oil and gas processing, industrial manufacturing, aviation, marine operations, and water infrastructure.
- In July 2025, the International Energy Agency forecast global electricity demand growth of 3% in 2025 and 3.7% in 2026, strengthening requirements for efficient, reliable rotating equipment across expanding power systems.
Key Takeaways
- The global Turbomachinery market was valued at USD 27.8 billion in 2025.
- The global market is projected to grow at a CAGR of 2.3% and is estimated to reach USD 34.8 billion by 2035.
- On the basis of product type, power-producing machines dominated the turbomachinery market, constituting 65.56% of the total market share.
- Based on the end-user industry, the oil and gas segment led the market, comprising 43.45% of the total market.
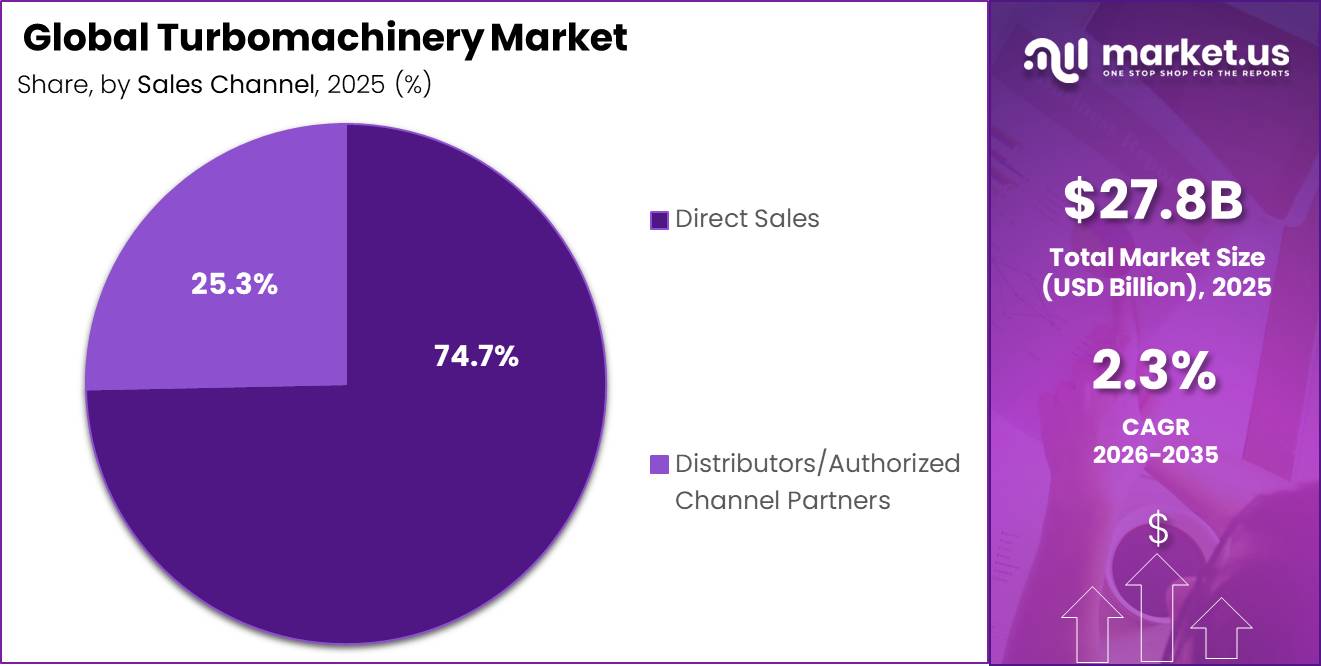
- Based on the sales channel, direct sales dominated the turbomachinery market, with a substantial market share of 74.67%.
- In 2025, North America was the most dominant region in the turbomachinery market, accounting for 36.34% of the total market share.
The industrial scenario is being shaped by rapid additions of renewable generation and grid-balancing assets. In April 2026, the Global Wind Energy Council reported that 165 gigawatts of wind capacity were installed during 2025, with 28,395 turbines commissioned across 57 countries. In June 2026, the International Hydropower Association stated that hydropower capacity increased by 28 gigawatts in 2025, including 11.7 gigawatts of pumped storage, creating demand for hydraulic turbines, pumps, generators, and modernization services.
Market growth is driven by rising power consumption, ageing equipment replacement, plant efficiency targets, digital maintenance, and the need for flexible generation. Operators increasingly use sensors, automated controls, remote diagnostics, and predictive analytics to reduce failures and schedule maintenance more accurately. Government efficiency rules are also influencing product design. The United States Department of Energy requires compressors manufactured and distributed from January 10, 2025, to meet federal energy conservation standards, encouraging upgrades in industrial compressed-air systems.
Future opportunities are expanding in large wind turbines, pumped storage, hydrogen-ready gas turbines, carbon capture compression, and high-efficiency industrial machinery. In January 2025, the United States Department of Energy announced a USD 6.25 million research opportunity focused on improving the aerodynamic performance of large wind turbines. Suppliers offering advanced materials, efficient blade and impeller designs, modular packages, and long-term aftermarket support can benefit as utilities and industrial operators modernize assets, strengthen energy security, and integrate additional renewable capacity across major regional energy markets.
Product Type Analysis
Power-Producing Machines lead with 65.56% while Power-Consuming Machines gain momentum
In 2025, Power-Producing Machines (Wind Turbines, Hydraulic Turbines, Gas Turbines, Steam Turbines) held a dominant market position, capturing more than a 65.56% share. Their leadership reflects broad use in utility power generation, renewable projects, industrial plants, and distributed energy systems. These machines convert fluid or wind energy into mechanical power and electricity. In February 2026, Siemens Energy reported bookings for 102 gas turbines during its first fiscal quarter, showing continued demand for generation equipment.
- For instance, in June 2026, according to Mitsubishi Power, the company signed a long-term parts and services agreement covering M501G gas turbines at the 1,200 MW Ilihan Combined Cycle Power Plant in the Philippines.
Power-Consuming Machines, including pumps, compressors, fans, blowers, and other systems, represent the growing segment. Expansion is supported by industrial electrification, process automation, water handling, gas movement, cooling, and ventilation requirements. Digital monitoring, efficient motors, improved impeller designs, and predictive maintenance are helping operators reduce energy use, improve reliability, and extend equipment life.
End User Industry Analysis
Oil & Gas leads with 43.45% as power generation companies expand turbine demand
In 2025, Oil & Gas held a dominant market position, capturing more than a 43.45% share. The industry depends on turbines, compressors, pumps, fans, and blowers for extraction, gas processing, pipeline movement, refining, and offshore operations. In June 2025, the International Energy Agency stated that upstream oil investment was expected to reach around USD 420 billion during the year. This spending supports rotating-equipment replacement, field development, efficiency upgrades, and long-term maintenance requirements.
- For instance, in January 2026, according to Mitsubishi Power, the company secured a contract to supply hydrogen-ready M701JAC gas turbines for Qatar’s Facility E power and desalination project, which will add 2.4 gigawatts of electricity generation capacity.
Power Generation Company is the fastest-growing segment as utilities add flexible capacity, modernize ageing plants, and integrate variable renewable power. Gas, steam, wind, and hydraulic turbines support dependable electricity supply, while digital controls and predictive maintenance improve availability. Rising power demand is also encouraging long-term service contracts, turbine upgrades, and investment in efficient generation assets.
Sales Channel Analysis
Direct Sales leads with 74.7% while authorized channel partners expand customer reach
In 2025, Direct Sales held a dominant market position, capturing more than a 74.7% share. Large turbines, compressors, pumps, and machinery trains usually require direct engineering discussions, performance guarantees, installation planning, and long-term service agreements. Original equipment manufacturers work closely with utilities, oil and gas operators, and industrial plant owners to configure equipment for site-specific pressure, flow, fuel, and operating conditions. This approach also provides direct access to spare parts, technical specialists, digital monitoring, and scheduled maintenance.
- For instance, in May 2026, according to Atlas Copco Group, Belgian compressed-air distributor LVC Solutions became part of the company, strengthening sales and service coverage for compressor customers in eastern Belgium.
Distributors/Authorized Channel Partners are the fastest-growing segment as customers seek quicker local access to compressors, pumps, blowers, replacement parts, and maintenance support. Authorized partners improve regional availability through local inventories, trained technicians, product selection, warranty handling, and faster field service. Their reach is valuable for small and medium-sized industrial users that do not require direct project-level engagement with global manufacturers.
Key Market Segments
Product Type
- Power-Producing Machines
- Wind Turbines
- Hydraulic Turbines
- Gas Turbines
- Sream Turbines
- Power-Consuming Machines
- Pumps
- Compressors
- Fans
- Blowers
- Others
End User Industry
- Oil & Gas
- Power Generation Company
- Aerospace & Defense
- Marine & Shipping
- Other Indutsry
Sales Channel
- Direct Sales
- Distributors/Authorized Channel Partners
Driver Analysis
Gas-fired peaker and mid‑merit turbomachinery build-out
Turbomachinery industry handbooks for 2026 highlight that the U.S. power sector continues to rely on simple‑cycle and combined‑cycle gas turbines for both summer and winter reliability, with multiple OEMs reporting active project pipelines in the 100–400 MW block size for peaking and mid‑merit duty; system planners often model capacity reserves of 15–20% above forecast peaks, which in practice means adding several gigawatts of new gas capacity across major ISOs as electrification of heating, EVs and data centers drives load growth.
Each additional GW of gas capacity typically embeds several large gas turbines plus auxiliary compressors and pumps, representing hundreds of millions of dollars in turbomachinery hardware and long‑term service agreements, and given that global turbomachinery market baselines for 2024–2026 are in the high‑20‑billion‑dollar range, incremental peaker investments can easily add mid‑single‑digit percentage growth layers over multi‑year build cycles.
Drivers Impact Analysis
| Driver | (~) % Impact on CAGR Forecast | Geographic Relevance | Impact Timeline |
|---|---|---|---|
| Gas-fired peaker and mid-merit turbomachinery build-out | +2.2% | North America core; Middle East; Asia power corridors | Medium term (2-4 years) |
| LNG value chain, gas compression and pipeline expansion | +1.9% | U.S. Gulf; Qatar; APAC LNG importers | Medium term (2-4 years) |
| Industrial decarbonization and high-efficiency retrofit cycles | +1.7% | EU; U.K.; North America; advanced APAC | Long term (≥ 4 years) |
| Aero-derivative and fast-ramping turbines for renewables balancing | +1.5% | Europe; North America; high-RE grids | Medium term (2-4 years) |
| Emerging markets power and industrialization demand | +1.4% | South & Southeast Asia; Africa; Latin America | Long term (≥ 4 years) |
| Digital twins, predictive maintenance and lifecycle service revenues | +1.2% | Global installed base hubs | Long term (≥ 4 years) |
Restraint Analysis
Tight decarbonization rules on new gas turbines
The evolving New Source Performance Standards for combustion turbines in the U.S., combined with European “fit for 55”‑aligned measures, increasingly expect new gas capacity either to be hydrogen‑ready, carbon‑capture‑compatible or subject to strict emissions performance standards over technology lifetimes, and proposed rules have contemplated stringent kg CO2/MWh thresholds that, once fully applied, make unabated gas less bankable beyond specific peaking or backup use cases.
Simultaneously, net‑zero‑aligned scenarios from grid operators and policy bodies push for steep reductions in unabated gas generation shares by 2035–2040, which directly constrains utility willingness to commit to 25–30‑year turbomachinery investments that might become stranded; this is reflected in cancellations or re‑scopings of multiple gigawatts of planned gas capacity in Europe and advanced U.S. markets over 2024–2026 as regulators scrutinize consistency with climate targets.
For OEMs, this restraint compresses the newbuild funnel and forces a tilt toward retrofits, services and industrial segments, cutting perhaps 2–2.5 percentage points off the potential CAGR that would have been achievable under a more permissive, demand‑driven build‑out, and even where projects proceed, compliance engineering and certification costs increase, squeezing margins and complicating risk‑sharing in long‑term service agreements.
Restraint Impact Analysis
| Restraint | (~) % Impact on CAGR Forecast | Geographic Relevance | Impact Timeline |
|---|---|---|---|
| Tight decarbonization rules on new gas turbines | -2.3% | EU; U.K.; select U.S. states | Long term (≥ 4 years) |
| Capital discipline and delayed gas project FIDs | -2.0% | North America; Middle East; APAC LNG corridors | Medium term (2-4 years) |
| Rotor forging and hot-section bottlenecks | -1.8% | Global OEM manufacturing hubs | Medium term (2-4 years) |
| Competition from renewables and storage CAPEX | -1.7% | Europe; North America; advanced APAC | Long term (≥ 4 years) |
| High interest rates and financing constraints | -1.5% | Global, with EM capex projects most exposed | Short term (≤ 2 years) |
| Aging workforce and OEM restructuring risk | -1.3% | Europe; North America OEM bases | Long term (≥ 4 years) |
Opportunity Analysis
Hydrogen and ammonia‑ready upgrade platforms
Hydrogen‑ and ammonia‑ready upgrade platforms constitute a clear white space because, while decarbonization is already a driver, most installed gas turbine fleets were designed around natural gas and only a small fraction are currently capable of sustained operation on high hydrogen blends or zero‑carbon fuels, yet OEM R&D announcements show rapid progress toward engines capable of up to 100% hydrogen or ammonia firing by the early 2030s, including a 2 MW gas turbine demonstrator running solely on liquid ammonia and rich‑dome combustion systems for controlling NOx.
The untapped upside lies in systematically packaging these capabilities into standardized upgrade kits—combustors, fuel systems, control logic and safety systems—that can be retrofitted into tens of gigawatts of existing capacity; if even 10–15% of the global turbomachinery fleet were converted over a 10‑year horizon, the incremental hardware and engineering TAM could easily reach into the tens of billions, adding a couple of percentage points of CAGR on top of baseline service and newbuild demand.
Strategically, capturing this upside requires OEMs to commit to clear “X% hydrogen‑ready” roadmaps, pre‑certify upgrade paths with regulators, and develop pricing and risk‑sharing models that align upgrade capex with expected carbon‑cost savings and policy incentives; early movers that establish de facto standards for hydrogen‑ and ammonia‑ready turbomachinery could expand their service revenue per unit by 20–30% over the asset life and defend share against alternative flexibility technologies, yielding the estimated 2.3 percentage point CAGR uplift where executed at scale.
Opportunity Impact Analysis
| Opportunity | (~) % Potential CAGR | Geographic Relevance | Execution Window |
|---|---|---|---|
| Hydrogen and ammonia-ready upgrade platforms | +2.3% | EU; U.K.; Japan; Korea; Gulf | Medium term (2-4 years) |
| Electrified and e-drive turbomachinery packages | +2.1% | Europe; North America; APAC industrial hubs | Medium term (2-4 years) |
| AI-augmented design and rapid customization | +1.9% | Global OEM design centers | Long term (≥ 4 years) |
| Modular, mobile and rental turbomachinery fleets | +1.8% | Middle East; Africa; APAC emerging markets | Short term (≤ 2 years) |
| Integrated carbon capture and turbo-compression solutions | +1.7% | Europe; North America; Middle East clusters | Long term (≥ 4 years) |
| Data-driven aftermarket and performance-sharing contracts | +1.5% | Global installed base hubs | Medium term (2-4 years) |
Challenges Analysis
Multi‑year gas turbine order backlogs
Gas turbine order books have stretched to unprecedented multi‑year lengths as global orders surged from 399 units and 58.2 GW in 2024 to 846 units and 100.3 GW in 2025, more than doubling in a single year and pushing average delivery timelines for a newly ordered large gas turbine to roughly 2031, meaning a five‑year‑plus wait from contract signing to commercial operation.
For power developers, mid‑frame and smaller turbines that once shipped in 12–18 months now require 18–36 months, forcing utilities and IPPs to lock in capacity years ahead of actual grid need and often before final interconnection or permitting is resolved, which introduces forecasting risk and ties up capital in deposits long before revenue materializes; this queue effect caps the number of projects OEMs can realistically commit to annually regardless of underlying demand strength, effectively rationing growth even as bookings remain robust.
Strategically, OEMs are responding with capacity expansion announcements, tiered allocation to strategic accounts, and encouraging customers to place non‑binding reservations earlier in the planning cycle, but because turbine manufacturing capacity additions themselves take 2–4 years to commission, this backlog-driven throughput ceiling will continue to shave an estimated 2+ percentage points off achievable CAGR until new capacity comes fully online in the back half of the decade.
Challenges Impact Analysis
| Challenge | (~) % CAGR Friction Drag | Geographic Relevance | Mitigation Horizon |
|---|---|---|---|
| Multi-year gas turbine order backlogs | -2.2% | North America; EU; Middle East; APAC | Medium term (2-4 years) |
| Superalloy and critical metals cost spikes | -1.8% | Global manufacturing hubs | Medium term (2-4 years) |
| Engineering and skilled trades shortage | -1.6% | Europe; North America; APAC OEM bases | Long term (≥ 4 years) |
| Manufacturing capacity mismatch vs demand | -1.5% | Global OEM production corridors | Medium term (2-4 years) |
| Legacy fleet servicing and parts obsolescence | -1.1% | Global installed base, EM concentration | Long term (≥ 4 years) |
| China supply chain localization competition | -1.0% | APAC; export corridors to EM | Long term (≥ 4 years) |
Geopolitical Impact Analysis
Critical-Material Controls and Energy Sanctions Reshaping Turbomachinery Supply Chains
Geopolitical tensions are reshaping the turbomachinery market through critical-material export controls, energy sanctions, and stronger domestic manufacturing policies. Wind turbines, generators, compressors, pumps, and industrial motors depend on specialized magnets, alloys, electronic controls, and precision components sourced through international supply networks. Any restriction on these inputs can affect equipment costs, delivery schedules, and supplier qualification.
In April 2025, China’s Ministry of Commerce introduced export controls covering seven groups of medium and heavy rare-earth materials, including samarium, gadolinium, terbium, dysprosium, lutetium, scandium, and yttrium. The controlled list includes samarium-cobalt magnets and terbium or dysprosium-containing neodymium-iron-boron magnet materials. These requirements may lengthen licensing and procurement processes for manufacturers using high-performance magnets in power-producing and power-consuming machines.
- Energy sanctions are also redirecting project activity and aftermarket demand. In July 2025, the European Union reduced the Russian crude-oil price cap from USD 60 to USD 47.6 per barrel and added 105 vessels to its restricted list, bringing the total to 444. It also prohibited transactions involving Nord Stream 1 and 2, including equipment and maintenance services. These measures can shift turbine, pump, and compressor demand toward alternative energy corridors.
Governments are responding by supporting localized material supply. In December 2025, the United States Department of Energy announced funding of up to USD 134 million for domestic rare-earth recovery and refining. Such initiatives create opportunities for regional magnet production, dual sourcing, equipment redesign, and more resilient turbomachinery manufacturing networks.
Regional Analysis
North America Leads with 36.34% and US$10.1 Billion
In 2025, North America held a dominant position in the turbomachinery market, capturing a 36.34% share valued at USD 10.1 billion. Regional strength came from electricity generation, oil and gas activity, industrial processing, and extensive replacement demand for turbines, pumps, compressors, fans, and blowers. In February 2026, the United States Energy Information Administration reported that developers planned to add 6.3 gigawatts of natural gas-fired capacity during 2026, supporting demand for gas turbines and compressor systems.
Canada also provided a strong renewable equipment base, as Statistics Canada reported in March 2026 that wind generation reached 50.5 million megawatt-hours in 2025. Asia Pacific remains an important growth region because of rapid power-system expansion. In February 2026, China’s National Bureau of Statistics stated that installed wind capacity reached 640.01 million kilowatts and hydropower capacity reached 448.02 million kilowatts at the end of 2025, creating substantial opportunities for turbine manufacturing, maintenance, and modernization across utilities.
Key Regions and Countries Covered
- North America
- The US
- Canada
- Europe
- Germany
- France
- The UK
- Spain
- Italy
- Russia & CIS
- Rest of Europe
- APAC
- China
- Japan
- South Korea
- India
- ASEAN
- Rest of APAC
- Latin America
- Brazil
- Mexico
- Rest of Latin America
- Middle East & Africa
- GCC
- South Africa
- Rest of MEA
Key Players Analysis
Turbomachinery manufacturers focus on improving equipment efficiency, operating reliability, digital integration, and service capabilities to maintain competitiveness. A key priority is the development of high-efficiency gas turbines, steam turbines, compressors, pumps, and blowers that can operate under demanding temperature, pressure, and load conditions.
General Electric through GE Vernova, Siemens Energy, Mitsubishi Heavy Industries, and Ansaldo Energia strengthen their positions through advanced turbine platforms, fuel-flexible systems, plant upgrades, and long-term service agreements. Baker Hughes, Elliott Group, and Kobe Steel compete through specialized compressor trains and integrated machinery packages for liquefied natural gas, refining, pipeline, and industrial applications.
Manufacturers also invest in predictive maintenance, automated controls, remote monitoring, and condition-based servicing to reduce downtime and extend equipment life. Atlas Copco and Howden focus on compressor and blower technologies, while Sulzer strengthens its position through pumps, repair services, and rotating-equipment support.
Market Key Players
- General Electric Company
- Siemens AG
- Mitsubishi Heavy Industries, Ltd.
- Everllence SE
- Atlas Copco AB
- Sulzer Ltd
- Baker Hughes Company
- Howden Group Holdings Limited
- Kobe Steel, Ltd.
- Elliott Group, Ltd.
- Caterpillar Inc.
- Ansaldo Energia S.p.A.
- Other Key Players
Key Development
- In February 2026, GE Vernova completed two High Efficiency upgrades on GT26 gas turbines at InterGen’s 800 megawatt Coryton Power Plant in the United Kingdom. The modernization improved plant efficiency and power output while providing an estimated annual carbon-emission reduction equivalent to approximately 67,500 tonnes.
- In February 2026, Ansaldo Energia secured a contract from Enerwave S.A. to upgrade the AE94.3A gas turbine at the Thisvi combined-cycle power plant in Greece. The project will improve output, efficiency, operating flexibility, and fuel consumption, while a renewed long-term service agreement will provide technical support for another 14 years.
- In July 2026, Everllence SE received an order to supply eight compressor trains for a new floating production, storage, and offloading vessel serving Azule Energy offshore Angola. The equipment package includes four centrifugal compressor trains and four process-gas screw compressor skids for onboard gas processing and export operations.
Report Scope
| Report Features | Description |
|---|---|
| Market Value (2025) | USD 27.8 Bn |
| Forecast Revenue (2035) | USD 34.8 Bn |
| CAGR (2026-2035) | 2.3% |
| Base Year for Estimation | 2025 |
| Historic Period | 2020-2024 |
| Forecast Period | 2026-2035 |
| Report Coverage | Revenue Forecast, Market Dynamics, Competitive Landscape, Recent Developments |
| Segments Covered | By Product Type (Power-Producing Machines (Wind Turbines, Hydraulic Turbines, Gas Turbines, Steam Turbines) , Power-Consuming Machines (Pumps, Compressors, Fans, Blowers, and Others)), By End User Industry (Oil & Gas, Power Generation Company, Aerospace & Defense, Marine & Shipping, and Other Industry), By Sales Channel (Direct Sales and Distributors/Authorized Channel Partners) |
| Regional Analysis | North America – The US & Canada; Europe – Germany, France, The UK, Spain, Italy, Russia & CIS, Rest of Europe; APAC- China, Japan, South Korea, India, ASEAN & Rest of APAC; Latin America- Brazil, Mexico & Rest of Latin America; Middle East & Africa- GCC, South Africa, & Rest of MEA |
| Competitive Landscape | General Electric Company, Siemens AG, Mitsubishi Heavy Industries, Ltd., Everllence SE, Atlas Copco AB, Sulzer Ltd, Baker Hughes Company, Howden Group Holdings Limited, Kobe Steel, Ltd., Elliott Group, Ltd., Caterpillar Inc., and Ansaldo Energia S.p.A., and other key players |
| Customization Scope | Customization for segments, region/country-level will be provided. Moreover, additional customization can be done based on the requirements. |
| Purchase Options | We have three licenses to opt for: Single User License, Multi-User License (Up to 5 Users), Corporate Use License (Unlimited Users and Printable PDF) |





































