


Report Overview
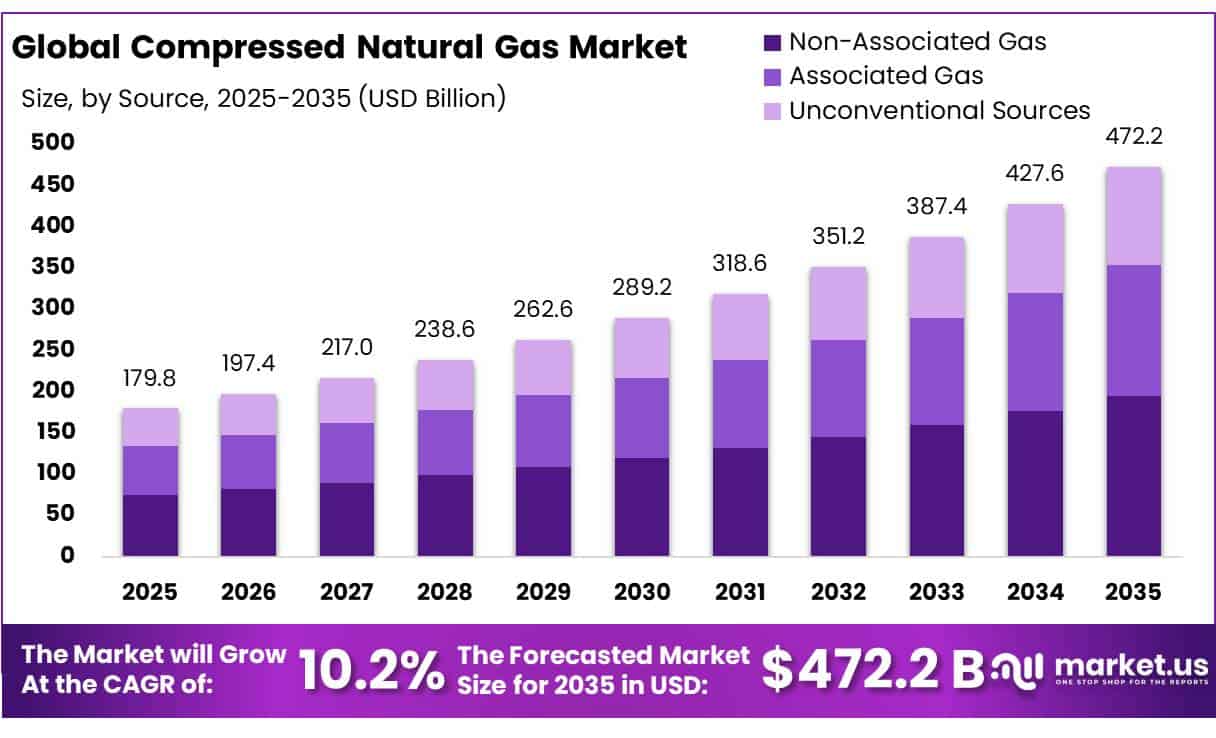
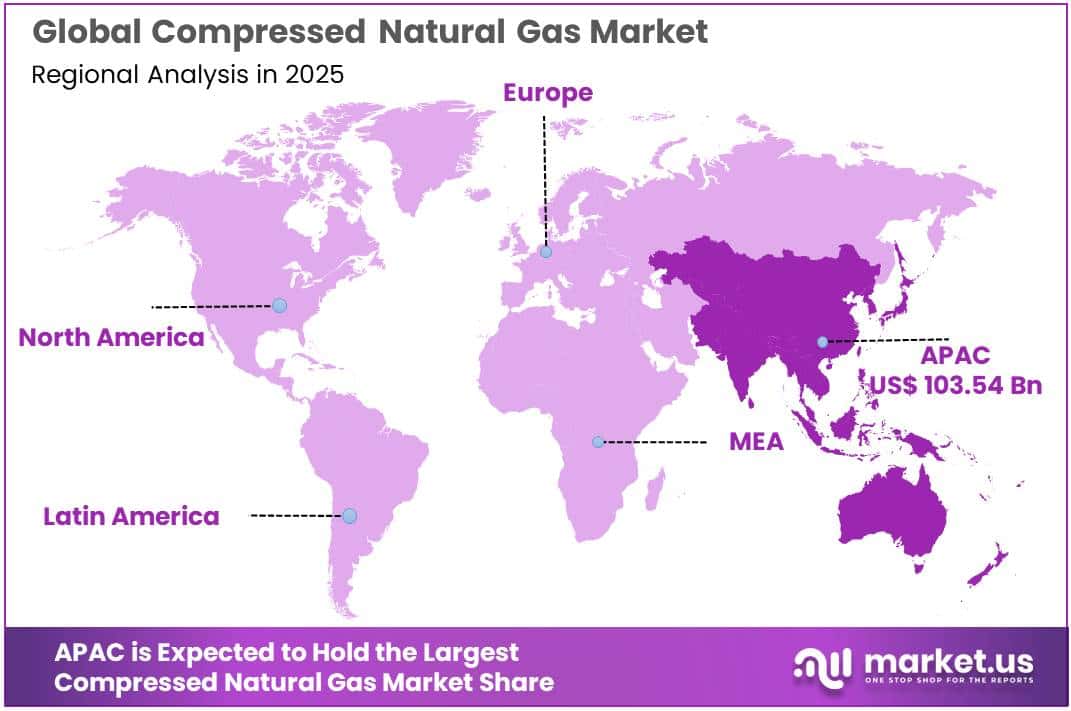
In 2025, the Global Compressed Natural Gas Market was valued at USD 179.8 billion, and between 2026 and 2035, this market is estimated to register a CAGR of 10.2%, reaching about USD 472.2 billion by 2035. Asia Pacific held a dominant market position, capturing more than a 57.60% share, holding USD 103.54 billion in revenue.
Compressed natural gas (CNG) is an established transport fuel produced by compressing natural gas to less than 1% of its volume at normal atmospheric pressure. It is typically stored onboard vehicles at pressures of up to 3,600 psi, while one gasoline-gallon equivalent contains about 5.66 pounds of CNG. These properties make CNG suitable for buses, refuse trucks, delivery fleets, utility vehicles, and regional heavy-duty transport. Its industrial strengths include mature engine technology, pipeline-based fuel supply, and fast-fill or time-fill station options.
- U.S. marketed natural gas production reached a record 118.5 Bcf/d in 2025, increasing by 5.3 Bcf/d from the previous year. Appalachia, Permian, and Haynesville together supplied 67% of total marketed production. This strong supply base supports CNG availability and encourages investment in compression equipment, cylinders, dispensers, and depot stations.
Key Takeaways
- Compressed Natural Gas Market was valued at USD 179.8 billion, to register a CAGR of 10.2%, reaching about USD 472.2 billion by 2035.
- Non-Associated Gas held a dominant market position, capturing more than a 41.00% share.
- Light-Duty Vehicles (LDVs) held a dominant market position, capturing more than a 50.20% share.
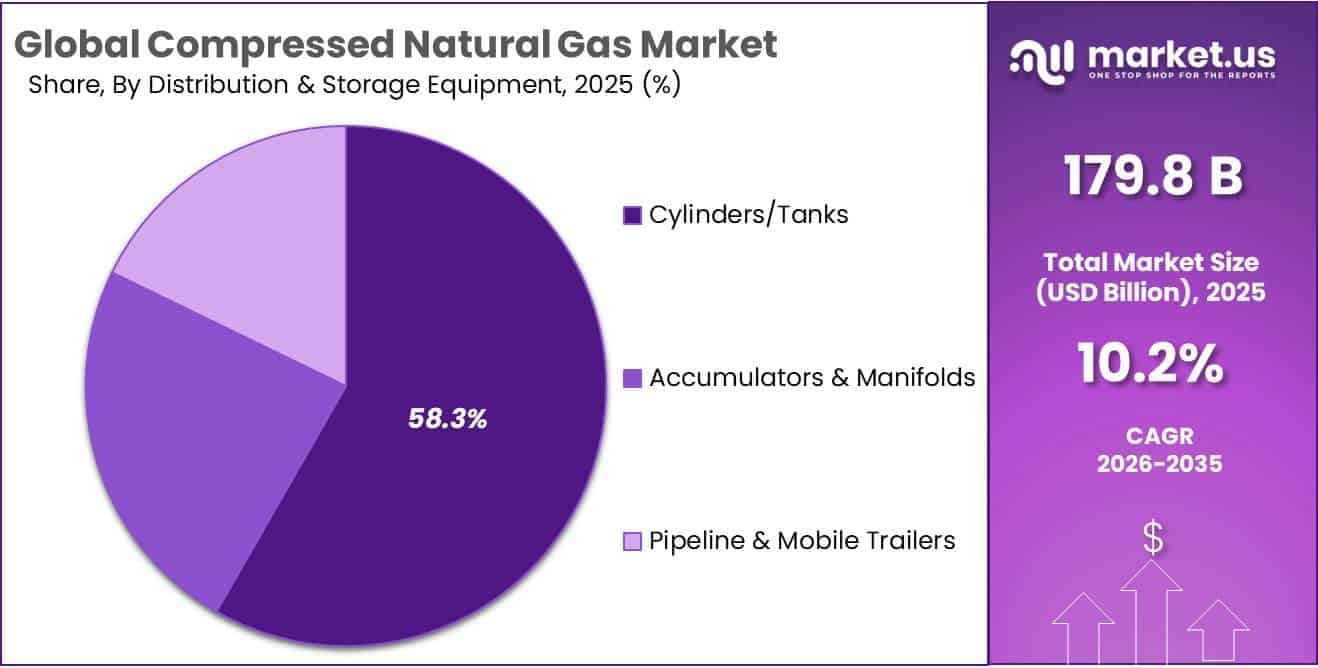
- Cylinders/Tanks held a dominant market position, capturing more than a 58.00% share.
- Asia Pacific held the dominant position in 2025, accounting for 57.60% of the Compressed Natural Gas market and generating about USD 103.54 billion.
Infrastructure remains an important market factor. The U.S. Department of Energy reports more than 700 public CNG stations, while a complete CNG station can cost up to USD 1.8 million depending on size and application. Smaller fueling units average about USD 10,000, including engineering, equipment, and installation. This range supports different deployment models, from private time-fill depots for transit and refuse fleets to public fast-fill stations. Future growth will depend on better corridor coverage, lower station costs, stronger compressor efficiency, reliable maintenance networks, and higher commercial fleet utilization.
- The Transport Project reports more than 23 million natural gas vehicles worldwide, while about 50 manufacturers in the U.S. and Canada produce around 100 light-, medium-, and heavy-duty NGV and engine models. High-mileage fleets remain attractive users because predictable routes and centralized refueling can improve station utilization.
The strongest future opportunity is renewable natural gas (RNG). The Transport Project states that RNG represented 79% of natural gas used for U.S. transportation in 2023, while the industry is targeting 80% by 2030 and almost 100% by 2050. RNG can be produced from landfill gas, wastewater, food waste, and agricultural residues, then injected into existing gas networks and compressed for vehicle use. U.S. policy also supports this pathway because RNG can qualify under the Renewable Fuel Standard. As carbon-reduction requirements tighten, CNG infrastructure capable of dispensing both conventional gas and RNG could remain commercially relevant while supporting lower-carbon transport and circular use of organic waste.
By Source Analysis
Non-Associated Gas dominates with more than 41.00% share, supported by strong gas-focused production
In 2025, Non-Associated Gas held a dominant market position, capturing more than a 41.00% share. The segment remains important for compressed natural gas production because it comes from reservoirs developed mainly for natural gas rather than as a by-product of crude oil extraction. Gas-focused producing regions provide a stable feedstock base for processing, compression, and CNG distribution.
- According to the U.S. Energy Information Administration, Appalachia produced 36.6 billion cubic feet per day of marketed natural gas in 2025, while Haynesville production averaged 14.9 billion cubic feet per day. This large supply from gas-rich producing areas supports continuous CNG availability for commercial fleets, public transport, and industrial users. The EIA also reported that total U.S. marketed natural gas production averaged 118.5 billion cubic feet per day in 2025, showing the depth of available gas supply for downstream applications.
Associated Gas is becoming an increasingly useful source for the compressed natural gas industry because it is produced alongside crude oil and can be captured, processed, and supplied to transportation and industrial markets instead of being wasted. In 2025, the Permian region produced an average of 27.7 billion cubic feet per day of marketed natural gas, with the U.S. Energy Information Administration stating that production growth in the basin was primarily driven by associated gas from oil production. Permian natural gas output increased by 2.7 billion cubic feet per day during the year. In its June 2026 analysis, the EIA also reported that Permian marketed natural gas production had reached 27.6 billion cubic feet per day in 2025.
By End-Use Application Analysis
Light-Duty Vehicles (LDVs) dominate with more than 50.20% share as everyday fleet use supports CNG demand
In 2025, Light-Duty Vehicles (LDVs) held a dominant market position, capturing more than a 50.20% share. The segment benefits from the regular use of passenger cars, vans, pickups, taxis, municipal vehicles, and other fleet vehicles that can return to a fixed location for refueling. CNG is particularly practical for vehicles with predictable daily routes because centralized refueling reduces dependence on a wide public station network.
- U.S. Energy Information Administration data released in July 2026 show that 53,149 million cubic feet of natural gas was delivered for vehicle fuel in 2025. Total U.S. natural gas consumption reached 33,522,688 million cubic feet during the same year, indicating a large domestic gas supply base that can support transportation applications. The U.S. EPA’s 2025 Automotive Trends Report, released in February 2026, also states that preliminary model-year 2025 data show continued improvement in new light-duty vehicle fuel efficiency. These conditions support the continued use of CNG in centrally managed LDV fleets.
Medium & Heavy-Duty Trucks are gaining importance in the compressed natural gas market as fleet operators look for fuel options suited to high annual mileage, fixed routes, and depot-based refueling. The U.S. Department of Energy states that medium- and heavy-duty natural gas vehicles are available directly from original equipment manufacturers and through qualified vehicle retrofitters. CNG is well suited to regional trucks, refuse vehicles, delivery fleets, and other applications that operate within areas supported by dependable fueling infrastructure. In 2025, U.S. natural gas consumption for vehicle fuel stood at 53,149 million cubic feet, providing a sizeable transportation-fuel base for commercial vehicle applications.
By Distribution & Storage Equipment Analysis
Cylinders/Tanks dominate with more than 58.00% share as high-pressure storage remains essential for CNG handling
In 2025, Cylinders/Tanks held a dominant market position, capturing more than a 58.00% share. Cylinders and tanks remain the core storage equipment in the CNG industry because natural gas must be kept under high pressure before it can be transported or supplied to vehicles.
The U.S. Department of Energy states that CNG is generally stored onboard vehicles at pressures of up to 3,600 psi, showing the importance of certified high-pressure cylinders in CNG systems. DOE guidance also notes that fast-fill stations commonly store compressed gas in storage vessels at around 4,300 psi so fuel can be transferred quickly to vehicles.
- In 2025, U.S. natural gas consumption for vehicle fuel reached 53,149 million cubic feet, according to the U.S. Energy Information Administration. This level of transportation demand supports continued requirements for durable cylinders, stationary storage vessels, and high-pressure tank systems across CNG fleets and fueling infrastructure.
The U.S. Department of Energy explains that fast-fill CNG stations move compressed gas into a series of high-pressure storage vessels, with gas commonly held at about 4,300 psi before dispensing. DOE also identifies 3 types of CNG fueling infrastructure, including time-fill, fast-fill, and combination-fill systems, each requiring different storage and pressure-management arrangements. In 2025, U.S. vehicle-fuel natural gas consumption totaled 53,149 million cubic feet, highlighting the operating scale of natural gas transportation infrastructure that relies on pressure-control and distribution equipment.
Key Market Segments
By Source
- Non-Associated Gas
- Associated Gas
- Unconventional Sources
By End-Use Application
- Light-Duty Vehicles
- Medium & Heavy-Duty Trucks
- Buses & Coaches
- Industrial & Power Generation
By Distribution & Storage Equipment
- Cylinders/Tanks
- Accumulators & Manifolds
- Pipeline & Mobile Trailers
Driver Analysis
High-Mileage Fleet Fuel Savings
CNG’s most durable demand driver is fleet total-cost-of-ownership rather than passenger-car consumer preference, because fuel savings compound rapidly across vehicles travelling 50,000–150,000 km annually and can offset the heavier tank system, reduced payload flexibility, and initial powertrain premium within a relatively short operating cycle. U.S. Department of Energy fleet evidence indicates that CNG can remain economically viable even with approximately 20% lower fuel economy than diesel and an incremental $40,000–50,000 cost for the natural-gas fuel system and tanks on a tractor, provided fleets achieve sufficient utilisation and fuel-price savings.
For a medium-duty delivery truck consuming 35–50 diesel-litre-equivalent per 100 km, a modeled net fuel advantage of only $0.15–0.25 per litre-equivalent produces $7,500–25,000 of annual savings at 50,000–100,000 km utilisation, supporting central-fuelling investments and multi-year vehicle procurement contracts. This shifts market value away from fragmented retail passenger demand toward contracted bus, refuse-collection, airport, last-mile, municipal, taxi, and regional-haul fleets, where operators can use time-fill systems overnight, maintain 70–90% station utilisation, and monetize lower fuel volatility through predictable per-kilometre transport pricing.
Drivers Impact Analysis
| Driver | (~) % Impact on CAGR | Geographic Relevance | Impact Timeline |
|---|---|---|---|
| India CGD station expansion | +2.3 pp | India core, South Asia spill-over | Short term (≤2 years) |
| High-mileage fleet fuel savings | +1.8 pp | India, Pakistan, Latin America, U.S. fleets | Short term (≤2 years) |
| Urban air-quality compliance | +1.5 pp | India metros, China, Latin America, EU cities | Medium term (2–4 years) |
| Bio-CNG blending mandates | +1.3 pp | India, EU, North America | Medium term (2–4 years) |
| OEM bi-fuel vehicle scale | +1.1 pp | India, APAC, Latin America | Medium term (2–4 years) |
| Corridor refuelling build-out | +1.0 pp | North America, India, Europe, APAC | Medium term (2–4 years) |
Restraint Analysis
EV substitution in passenger/last-mile fleets
The single largest structural headwind to CNG’s baseline growth is direct unit substitution by battery-electric vehicles, whose per-kilometre running cost of roughly ₹1–2.5 on home charging already undercuts CNG’s typical ₹2.5–4.5 per km, a gap of nearly 40-60% that widens further as residential electricity tariffs remain flat while CNG pricing tracks natural-gas benchmarks that have hovered near $2.75-2.80/MMBtu through mid-2026 with periodic seasonal spikes.
Fleet operators ride-hailing, last-mile delivery, and municipal bus segments are the most exposed because their high daily mileage means the total-cost-of-ownership breakeven against EVs, typically cited at 3-5 years of ownership, is reached faster at fleet-level utilization, accelerating conversion decisions within a 12-24 month replacement-cycle window rather than over a full vehicle lifetime.
Government EV push measures, including expanded PM E-Drive scheme allocations that rose from roughly 5% to 25% of related budget outlays in 2026, further tilt new-vehicle purchase economics away from CNG retrofits and factory-fitted CNG variants. The strategic consequence for CNG OEMs and kit manufacturers is margin compression on new-vehicle attach rates, forcing a pivot toward retrofitting the existing petrol/diesel parc rather than counting on sustained new-CNG-vehicle sales growth, while CGD entities face slower throughput growth per station than previously underwritten in station-expansion CapEx models.
Restraint Impact Analysis
| Restraint | (~) % Impact on CAGR | Geographic Relevance | Impact Timeline |
|---|---|---|---|
| EV substitution in passenger/last-mile fleets | -2.3 pp | India urban core, EU, China, North America | Short term (≤2 years) |
| Feedstock price volatility (gas cost pass-through) | -1.6 pp | Global; India, EU, North America | Short term (≤2 years) |
| Refueling infrastructure and waiting-time bottleneck | -1.7 pp | India tier-2/3 cities, Latin America, SE Asia | Medium term (2–4 years) |
| Vehicle boot-space/payload and OEM model limitations | -1.1 pp | India, APAC | Medium term (2–4 years) |
| Cylinder testing, safety-compliance and retrofit cost burden | -0.9 pp | India, EU, Latin America | Short term (≤2 years) |
| Pipeline gas allocation and city-gas-distribution supply constraints | -1.3 pp | India, select EU and APAC markets | Medium term (2–4 years) |
Opportunity Analysis
Bio-CNG/RNG Premium Network
A typical biogas upgrading plant converting agricultural residue, food waste, manure, or municipal organic waste can produce transport-grade biomethane of roughly 95–98% methane, while a 10–20 tonne/day bio-CNG facility can displace approximately 3.5–7.0 million litres of diesel-equivalent energy annually, depending on vehicle duty cycle and gas quality.
- The addressable value pool includes gate-fee income, digestate sales, bio-CNG margin, renewable-energy certificates, and contracted fleet premiums; modelling a ₹6–12/kg green-gas uplift on 15–25 tonnes/day of throughput produces incremental annual gross revenue of roughly ₹1.6–11.0 crore before carbon-attribute value.
Integration into existing CNG networks can avoid duplicating retail-station CapEx, while a 10–20% green-fuel premium can be targeted at corporates with Scope 1 logistics commitments, municipal fleets, and export-linked manufacturers; however, companies must establish feedstock contracts, gas-quality control, mass-balance certification, and methane-leak monitoring rather than assuming that existing CNG demand will automatically pay for renewable supply.
Opportunity Impact Analysis
| Opportunity | (~) % Potential CAGR | Geographic Relevance | Execution Window |
|---|---|---|---|
| Bio-CNG/RNG premium network | +2.1 pp | India, EU, North America, Brazil | Medium term (2–4 years) |
| Fleet-energy subscription | +1.7 pp | India, Latin America, SE Asia | Short term (≤2 years) |
| Hub-and-spoke heavy fleets | +1.5 pp | India freight corridors, North America, MENA | Medium term (2–4 years) |
| Flare-gas virtual pipelines | +1.3 pp | Africa, MENA, Latin America, Central Asia | Long term (≥4 years) |
| Smart-station monetisation | +1.0 pp | India, APAC, Latin America | Short term (≤2 years) |
| CGD asset roll-ups | +1.2 pp | India, North America, Southeast Asia | Medium term (2–4 years) |
Challenges Analysis
Compressor Uptime and Spare-Parts
CNG retail depends on high-pressure compression equipment operating consistently at approximately 200–250 bar, yet compressor downtime remains a recurring operational challenge because critical componentsvalves, seals, pistons, filters, dryers, control systems, and cascade assemblies face accelerated wear under high duty cycles, variable inlet pressure, moisture exposure, and peak-hour loading. India’s CNG network has expanded from 7,395 stations in November 2024 toward an estimated 8,600-plus in 2026, but station rollout does not automatically create local service capacity, spare-parts inventory, or predictive-maintenance discipline; the national target of about 17,500–17,700 stations by 2030 implies an additional 8,900–9,100 stations requiring compressor commissioning, calibration, and lifecycle support within four years.
A compressor outage of 24–48 hours at a 3-tonne-per-day urban station can defer 3–6 tonnes of fuel sales, push customers into neighbouring queues, and reduce trust among taxi or freight fleets that operate on thin route-utilisation margins; a modest 3% annual availability loss can therefore erase much of the gross-margin benefit expected from higher throughput. The strategic response is not simply purchasing more compressors: operators need regional spare-parts hubs, vendor service-level agreements targeting 95–98% equipment availability, remote vibration and temperature monitoring, dual-compressor redundancy at high-volume sites, and standardized component specifications that can reduce repair lead times from weeks to days.
Challenges Impact Analysis
| Challenge | (~) % CAGR Friction | Geographic Relevance | Mitigation Horizon |
|---|---|---|---|
| Compressor uptime and spare-parts | -1.2 pp | India, Latin America, SE Asia | Medium term (2–4 years) |
| Qualified technician scarcity | -1.0 pp | India, APAC, Africa, Latin America | Medium term (2–4 years) |
| Gas-quality consistency management | -0.9 pp | India, EU, APAC import markets | Medium term (2–4 years) |
| Network utilization imbalance | -1.1 pp | India metros, North America, EU | Medium term (2–4 years) |
| Methane-emissions measurement burden | -0.8 pp | EU, North America, export-linked APAC | Long term (≥4 years) |
| Bio-CNG blending integration | -0.7 pp | India, EU, North America | Long term (≥4 years) |
Geopolitical Impact Analysis
The International Energy Agency reported that disruption through the Strait of Hormuz affected flows representing almost 20% of global LNG supply in 2026. Between March and June, LNG loadings from Qatar and the UAE fell by 35 billion cubic metres year over year. These disruptions can raise natural gas input costs for CNG stations, fleet operators, and city gas distributors, especially in import-dependent Asian and European markets.
The Russia-Ukraine war also continues to reshape gas trade. Russian pipeline deliveries to the European Union fell by 90% between 2021 and 2025, encouraging Europe to depend more heavily on LNG and alternative suppliers. This stronger competition for gas cargoes can indirectly influence CNG pricing in other importing regions. At the same time, supply diversification is providing some relief.
The U.S. Department of Energy reported LNG exports of 502.8 billion cubic feet in May 2026, reaching 33 countries. Overall, geopolitical instability is supporting CNG as a cleaner transport fuel, but uncertain gas prices, shipping risks, and supply disruptions may limit short-term adoption and fleet conversion decisions.
Regional Insights
Asia Pacific held the dominant position in 2025, accounting for 57.60% of the Compressed Natural Gas market and generating about USD 103.54 billion. The region benefits from dense cities, large bus and taxi fleets, and continued investment in city gas distribution. India provides an infrastructure example: the Petroleum and Natural Gas Regulatory Board reported 8,980 CNG stations across 312 geographical areas as of May 2026. Earlier government data showed that India’s CNG station network had reached 7,720 stations in 2025, compared with 738 in 2014. China’s extensive gas-fuelled commercial vehicle base further supports regional consumption and reinforces Asia Pacific’s leading position.
North America is emerging as the fastest-growing regional segment, supported by fleet-based CNG use, domestic gas production, and refuelling infrastructure. U.S. marketed natural gas production reached a record 118.5 Bcf per day in 2025, increasing by 5.3 Bcf per day from the previous year.
- The U.S. Department of Energy recorded 1,385 public and private CNG stations in 2025, while EIA data showed 53,149 million cubic feet of natural gas delivered for vehicle fuel during the year. These supply and infrastructure advantages support CNG adoption in refuse trucks, transit fleets, municipal vehicles, and other high-mileage commercial applications where predictable routes improve fuel economics.
Key Regions and Countries Insights
- North America
- US
- Canada
- Europe
- Germany
- France
- The UK
- Spain
- Italy
- Rest of Europe
- Asia Pacific
- China
- Japan
- South Korea
- India
- Australia
- Rest of APAC
- Latin America
- Brazil
- Mexico
- Rest of Latin America
- Middle East & Africa
- GCC
- South Africa
- Rest of MEA
Key Players Analysis
Shell plc remains an important gas supplier supporting the wider CNG value chain through upstream production, LNG trading, and mobility infrastructure. In 2025, Shell sold 73 million tonnes per annum of LNG across 30 countries and produced about 2.8 million barrels of oil equivalent per day. Its global scale gives the company access to diversified natural-gas supply and trading routes. This position supports fuel availability for transport markets where natural gas is compressed and distributed through CNG refuelling networks. Globally.
Exxon Mobil Corporation supports the CNG market mainly through large-scale natural-gas production and LNG development. In 2025, its worldwide natural gas production available for sale averaged 8,442 million cubic feet per day, while total oil-equivalent production reached 4.736 million barrels per day. The company also completed mechanical work on Train 1 of Golden Pass LNG during 2025.
TotalEnergies SE has a strong position in global natural gas and LNG, supporting CNG markets through diversified supply, trading, and infrastructure. In 2025, the company recorded around 44 million tonnes of LNG sales and maintained more than 19 million tonnes per year of contracted regasification capacity in Europe. It also exported 19 million tonnes of U.S. LNG during the year. This integrated gas portfolio improves supply flexibility and supports transport markets that depend on reliable natural gas for CNG production.
Top Key Players Outlook
- Shell plc
- Exxon Mobil Corporation
- Chevron Corporation
- TotalEnergies SE
- PetroChina / CNPC
- Gazprom PJSC
- Eni S.p.A.
- BP plc
- Clean Energy Fuels Corp.
- Equinor ASA
- Indraprastha Gas Limited
- Mahanagar Gas Limited
- Snam S.p.A.
- Trillium CNG
- GAIL (India) Limited
Recent Developments
- In March 2026, Eni confirmed that Enilive had 1.65 million tonnes of annual biofuel production capacity at the end of 2025, with around 2 million tonnes under construction across 5 projects, alongside its biomethane activities.
- In June 2026, Equinor and partners approved more than NOK 4 billion for the TWIN development at Troll, expected to add around 11 billion standard cubic metres of gas. These developments strengthen Equinor’s gas availability and indirectly support CNG supply chains where reliable pipeline gas is compressed for transport and fleet applications.
- In May 2026, Clean Energy Fuels Corp expanded its network with 6 new stations, taking its North American fueling network to more than 600 locations. Its first-quarter 2026 RNG sales reached 67.4 million gallons, up 33.2% year over year, showing stronger utilization of its natural-gas fueling platform.
Report Scope
| Report Features | Description |
|---|---|
| Market Value (2025) | USD 179.8 Bn |
| Forecast Revenue (2035) | USD 472.2 Bn |
| CAGR (2026-2035) | 10.2% |
| Base Year for Estimation | 2025 |
| Historic Period | 2020-2024 |
| Forecast Period | 2026-2035 |
| Report Coverage | Revenue Forecast, Market Dynamics, Competitive Landscape, Recent Developments |
| Segments Covered | By Source (Non-Associated Gas, Associated Gas, Unconventional Sources), By End-Use Application (Light-Duty Vehicles, Medium And Heavy-Duty Trucks, Buses And Coaches, Industrial And Power Generation), By Distribution And Storage Equipment (Cylinders/Tanks, Accumulators And Manifolds, Pipeline And Mobile Trailers) |
| Regional Analysis | North America – US, Canada; Europe – Germany, France, The UK, Spain, Italy, Rest of Europe; Asia Pacific – China, Japan, South Korea, India, Australia, Singapore, Rest of APAC; Latin America – Brazil, Mexico, Rest of Latin America; Middle East & Africa – GCC, South Africa, Rest of MEA |
| Competitive Landscape | Shell plc, Exxon Mobil Corporation, Chevron Corporation, TotalEnergies SE, PetroChina / CNPC, Gazprom PJSC, Eni S.p.A., BP plc, Clean Energy Fuels Corp., Equinor ASA, Indraprastha Gas Limited, Mahanagar Gas Limited, Snam S.p.A., Trillium CNG (Love’s), GAIL (India) Limited |
| Customization Scope | Customization for segments, region/country-level will be provided. Moreover, additional customization can be done based on the requirements. |
| Purchase Options | We have three licenses to opt for: Single User License, Multi-User License (Up to 5 Users), Corporate Use License (Unlimited User and Printable PDF) |





































