


Report Overview
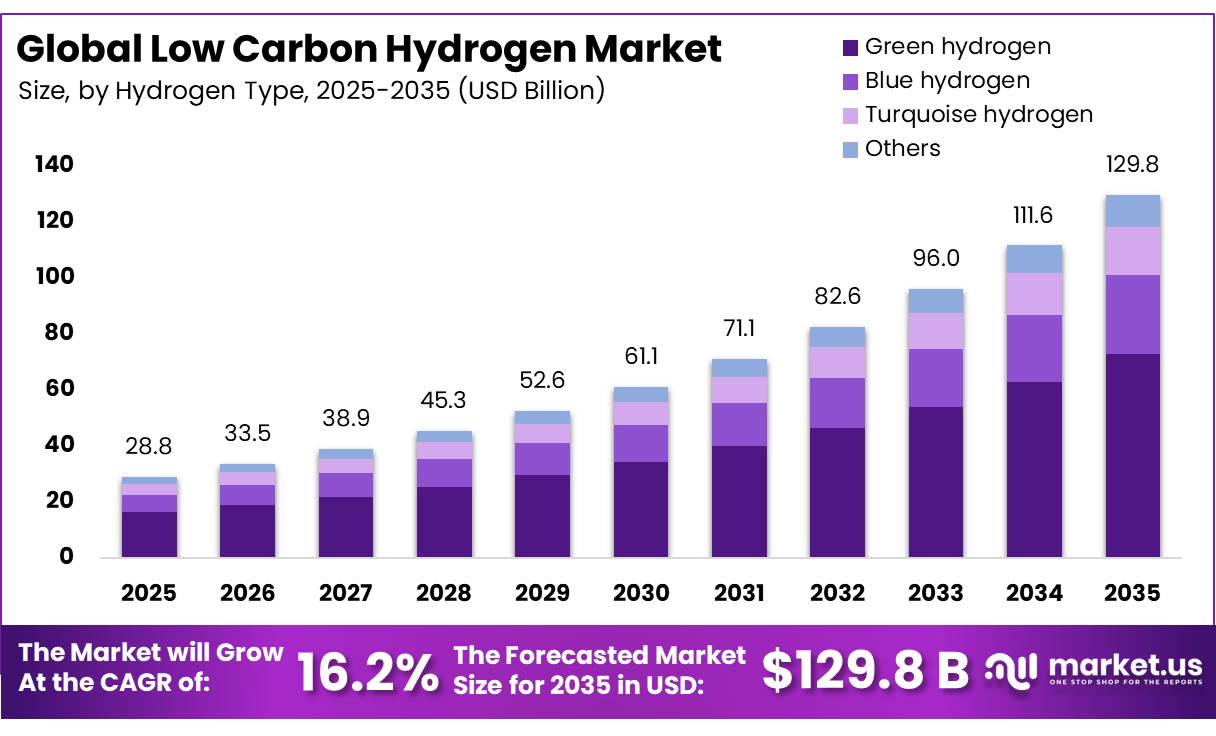
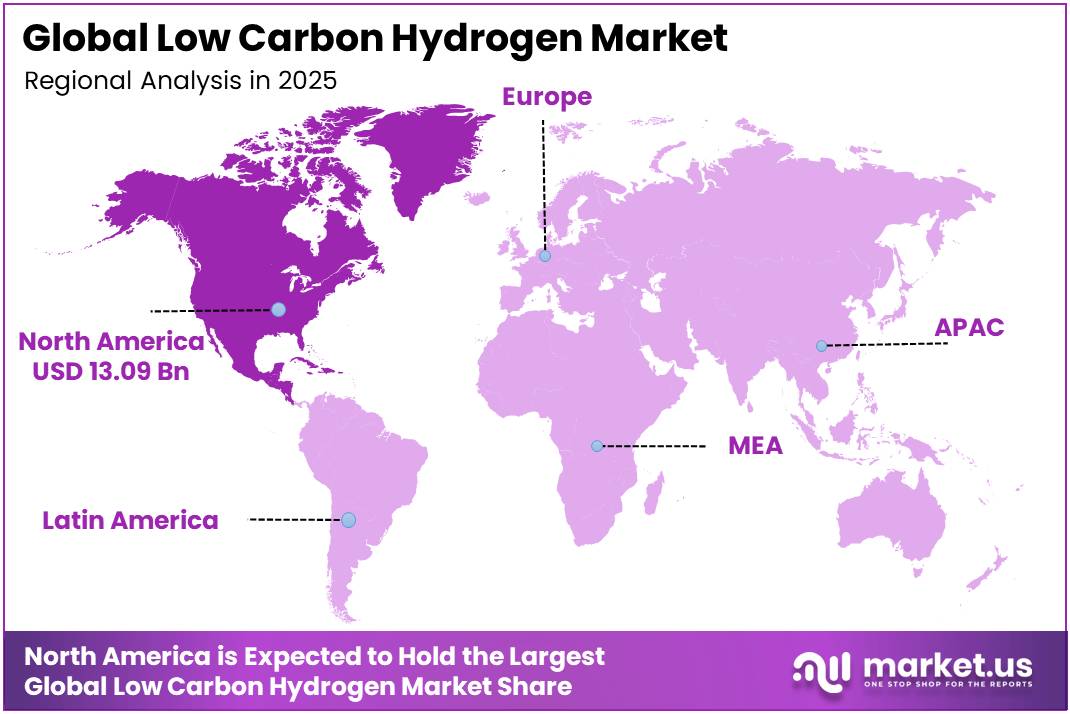
In 2025, the Global Low Carbon Hydrogen Market was valued at USD 28.8 billion, and between 2026 and 2035, this market is estimated to register a CAGR of 16.2%, reaching about USD 129.8 billion by 2035. In 2025, North America led the market, achieving over 45.4% share with a revenue of USD 13.09 Billion.
Low-carbon hydrogen is becoming a key pillar of the global energy transition as industries work to reduce greenhouse gas emissions while maintaining reliable energy and chemical feedstock supplies. It includes hydrogen produced through renewable-powered electrolysis, natural gas with carbon capture and storage, and other low-emission production pathways. The industry is steadily expanding beyond its traditional applications in refining and ammonia production into steelmaking, chemicals, power generation, heavy transport, aviation, and shipping.
- According to the International Energy Agency (IEA), in 2025 Global Hydrogen Review 2025, global hydrogen demand reached almost 100 million tonnes in 2024, increasing by 2% from the previous year, while low-emissions hydrogen production grew by 10% in 2024 and is expected to reach around 1 million tonnes in 2025.
Key Takeaways
- The Global Low Carbon Hydrogen Market was valued at USD 28.8 billion in 2025.
- The market is projected to grow at a CAGR of 16.2% and is estimated to reach USD 129.8 billion by 2035.
- On the basis of hydrogen type, Green hydrogen dominated the market, constituting 56.2% of the total market share.
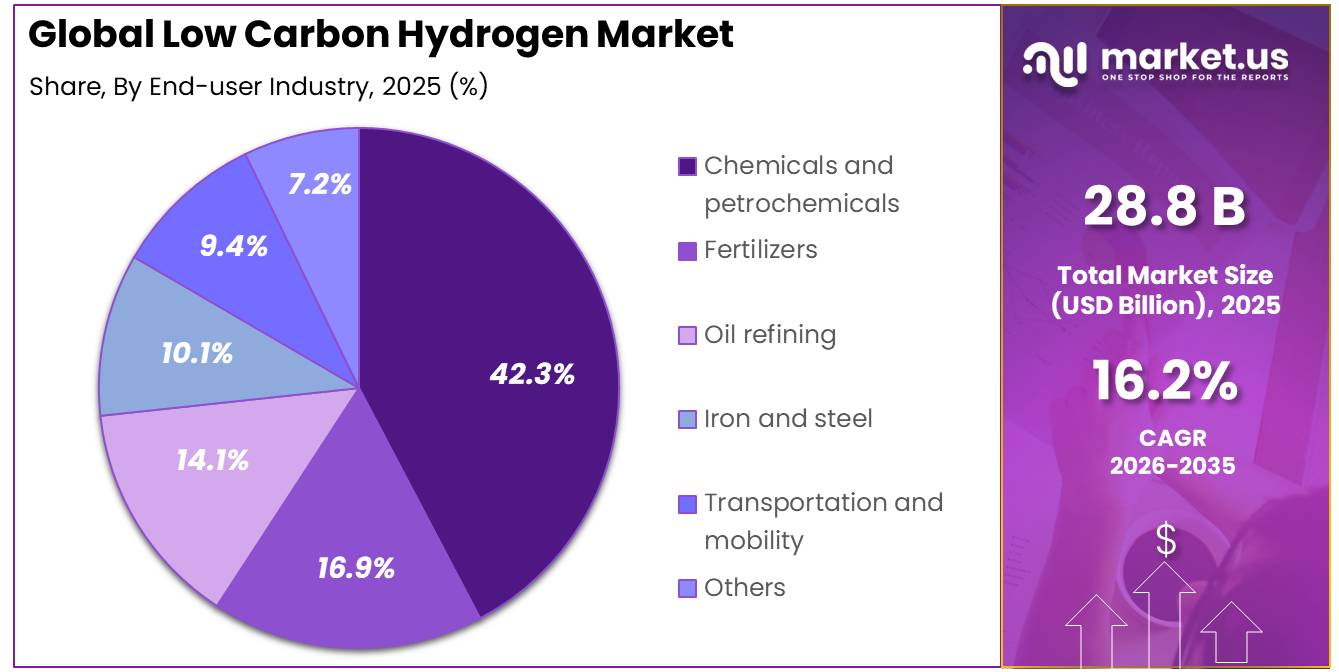
- Based on the end-user industry, Chemicals and petrochemicals dominated the market, with a substantial market share of around 42.3%.
- In 2025, North America was the most dominant region in the market, accounting for 45.4% of the total global consumption.
The industrial landscape is being strengthened by supportive government policies, large-scale infrastructure development, and collaborations between energy companies, utilities, and industrial manufacturers. Although conventional hydrogen continues to account for the majority of production, many developed economies are accelerating the deployment of low-carbon hydrogen through production incentives, carbon pricing mechanisms, and funding programs.
- In May 2026, according to the European Commission, 9 hydrogen projects across 7 European countries were selected to receive EUR 1.09 billion in financing. These projects are expected to install nearly 1.1 GW of electrolyzer capacity and produce more than 1.3 million tonnes of hydrogen during their first 10 years of operation.
According to the International Energy Agency (IEA), in 2025 Global Hydrogen Review 2025, more than 200 committed low-emissions hydrogen production projects have reached final investment commitment worldwide, while around 10 million tonnes of low-emissions hydrogen production capacity could become operational by 2030 if announced projects move forward as planned. These initiatives are encouraging the development of electrolyzers, hydrogen hubs, storage facilities, and international supply chains across multiple regions.
The industry’s growth is being driven by stricter climate policies, rising renewable electricity generation, corporate net-zero commitments, and increasing demand for cleaner industrial feedstocks. Sectors including steel, fertilizers, chemicals, refining, maritime transport, and aviation are actively evaluating hydrogen as a practical solution for reducing process emissions where direct electrification remains difficult.
According to the International Energy Agency, in 2025 Global Hydrogen Review 2025, hydrogen production currently consumes around 290 billion cubic metres of natural gas and approximately 90 million tonnes of coal equivalent annually. These figures highlight the significant opportunity to replace carbon-intensive hydrogen production with lower-emission alternatives while improving long-term industrial sustainability.
Future growth opportunities are expected to emerge from expanding electrolyzer manufacturing capacity, declining renewable electricity costs, hydrogen pipeline development, ammonia-based international trade, and long-duration energy storage solutions. Industrial clusters are increasingly integrating renewable power, carbon capture technologies, and hydrogen production into unified decarbonization projects that improve operational efficiency and reduce emissions.
According to the International Energy Agency (IEA), in 2025 Global Hydrogen Review 2025, cumulative firm hydrogen offtake agreements account for less than 2 million tonnes per year, representing only about 5% of the announced production potential expected by 2030. This indicates considerable room for future commercial expansion as long-term purchase agreements, supportive regulations, and industrial investments continue to strengthen the global low-carbon hydrogen ecosystem.
Hydrogen Type Analysis
Green Hydrogen Leads with a 56.2% Share, Supported by Expanding Electrolyser Projects.
In 2025, green hydrogen held a dominant market position, capturing more than a 56.2% share. Its leadership was supported by rising renewable electricity availability, stronger emission-reduction policies and increasing demand from refining, chemicals, steel and sustainable-fuel production. According to the European Commission, renewable hydrogen proposals submitted under the European Hydrogen Bank represented approximately 6.3 GW of electrolyser capacity and could produce more than 7.3 million tonnes of renewable hydrogen. These government-supported projects demonstrate how large-scale electrolysis development is strengthening green hydrogen’s commercial position.
Blue hydrogen is the fastest-growing segment of the low-carbon hydrogen market. In 2026, the segment continued gaining attention because it allows established natural-gas producers and industrial facilities to reduce production-related emissions through carbon capture, utilisation and storage. Its growth is particularly relevant in regions with accessible natural gas, developed pipeline networks and suitable carbon-storage locations. The International Energy Agency indicates that fossil-based hydrogen with carbon capture can remain commercially competitive in gas-rich markets, making blue hydrogen a practical transition option for refineries, ammonia plants and other heavy industries while renewable hydrogen infrastructure develops.
End-user Industry Analysis
Chemicals and petrochemicals dominate with a 42.3% share due to their established hydrogen demand
In 2025, Chemicals and petrochemicals held a dominant market position, capturing more than a 42.3% share. The segment remained the largest user of low-carbon hydrogen because hydrogen is an essential feedstock for ammonia, methanol, petroleum refining and other chemical processes. In April 2026, the European Commission’s Hydrogen Mechanism registered 47 renewable or low-carbon ammonia projects and 37 renewable or low-carbon methanol projects, indicating expanding low-carbon hydrogen use across major chemical-production processes
Fertilizers are the fastest-growing segment in the low-carbon hydrogen market. Fertilizer manufacturers are increasingly considering renewable and low-carbon hydrogen to reduce emissions from ammonia production, which traditionally depends on hydrogen derived from natural gas. Growth is being supported by government procurement programs, carbon-reduction policies and rising demand for lower-emission fertilizers. The IEA reported in 2026 that progress in low-emissions hydrogen procurement was occurring mainly in refining and fertilizers, supported by policies and regulations.
Key Market Segments
By Hydrogen Type
- Green hydrogen
- Blue hydrogen
- Turquoise hydrogen
- Others
By End-user Industry
- Chemicals and petrochemicals
- Fertilizers
- Oil refining
- Iron and steel
- Transportation and mobility
- Others
Driver Analysis
Production subsidies and tax credits scaling project bankability
The clearest 2026 growth driver is direct revenue support, because low carbon hydrogen still faces a material cost gap against unabated fossil-based hydrogen and most projects do not clear investment committees without visible downside protection. The U.S. DOE states that the Section 45V Clean Hydrogen Production Tax Credit provides up to $3.00/kg for 10 years, tiered by lifecycle carbon intensity, while DOE’s PEM electrolyzer cost record still places modeled clean hydrogen production at about $5–$7/kg and DOE’s broader hydrogen production program keeps an interim affordability target of $2/kg by 2026 and $1/kg by 2031.
In Europe, the Commission’s hydrogen auction framework explicitly uses fixed €/kg premiums to bridge the gap between production cost and buyer willingness to pay, and the 2025 auction drew 61 bids from 11 countries seeking over €4.8 billion against a €1.2 billion budget, implying excess supply of investable projects once subsidy visibility exists. Strategically, this shifts business models from speculative merchant production toward quasi-contracted infrastructure-style cash flows, lowers weighted average cost of capital, and brings forward FIDs in regions where grants, tax credits, or premium auctions can underwrite the first 5–10 years of production economics.
Driver Impact Analysis
| Driver | (~) % Impact on CAGR Forecast | Geographic Relevance | Impact Timeline |
|---|---|---|---|
| Production subsidies and tax credits scaling project bankability | +2.8% | North America core, EU core, Australia | Short term (≤ 2 years) |
| Hydrogen demand mandates and certification rules creating bankable offtake | +2.3% | EU core, Japan/Korea adjacency, India spill-over | Medium term (2-4 years) |
| Electrolyser capex compression and manufacturing scale-up | +2.0% | China core, EU selective, North America selective, Australia | Medium term (2-4 years) |
| FID conversion of announced projects into committed supply | +1.7% | EU, China, North America, Middle East, Australia | Short term (≤ 2 years) |
| Port, pipeline, storage and bunkering infrastructure clustering | +1.5% | EU port corridors, Singapore-led APAC corridors, North America Gulf Coast | Medium term (2-4 years) |
| Cost competitiveness gains from carbon pricing and industrial decarbonization pressure | +1.2% | EU core, selected APAC import corridors | Long term (≥ 4 years) |
Restraint Analysis
Power cost volatility
Electricity remains the dominant cost input for green and other electrolysis-linked low-carbon hydrogen, so even modest wholesale power dislocations translate into large delivered hydrogen cost swings; this is the clearest near-term restraint because DOE’s Hydrogen Shot still frames competitiveness around a $1/kg aspiration, while IRENA’s latest power-cost evidence shows that although most new renewables are cheaper than new fossil alternatives, 2024 LCOEs still rose slightly for solar PV, onshore wind, and offshore wind, meaning the direction of renewable capex is not uniformly easing at the same speed as hydrogen developers need.
In operating terms, a 10 USD/MWh increase in effective renewable or grid-linked electricity procurement can raise hydrogen production cost by roughly $0.45–$0.60/kg for merchant or partially contracted electrolyser projects, and when that combines with lower-than-planned utilisation rates, fixed-cost absorption worsens sharply, often pushing levelised hydrogen cost 20%–35% above bid assumptions and compressing project IRRs by 200–400 basis points. The strategic consequence is delayed offtake conversion, more conservative lender sizing, smaller first-wave plants, and a preference for subsidised clusters over open-market deployment, which justifies a modeled -2.4 percentage-point drag on 2026 baseline CAGR in regions where power-price certainty is still weaker than subsidy visibility.
Restraint Impact Analysis
| Restraint | (~) % Impact on CAGR Forecast | Geographic Relevance | Impact Timeline |
|---|---|---|---|
| Power cost volatility | -2.4% | EU, North America, APAC import hubs | Short term (≤ 2 years) |
| Tight RFNBO / 45V compliance | -1.9% | EU core, U.S., export corridors | Medium term (2-4 years) |
| Slow FID-to-build conversion | -2.2% | Global, especially EU and North America | Medium term (2-4 years) |
| Electrolyser supply concentration | -1.5% | EU, U.S., India, APAC corridors | Short term (≤ 2 years) |
| Offtake and price-gap risk | -2.0% | EU, North America, Japan-Korea import chain | Medium term (2-4 years) |
| Infra and hub rollout delays | -1.7% | U.S. hubs, EU backbone zones, export ports | Long term (≥ 4 years) |
Opportunity Analysis
E-fuels and methanol integration
This is not a baseline driver because current low-carbon hydrogen deployment is still concentrated in conventional refining and ammonia pathways, whereas synthetic fuels and low-carbon methanol represent adjacent TAM expansion into shipping, aviation intermediates, and chemical feedstocks that require downstream integration and carbon-sourcing orchestration that many hydrogen producers have not yet built. With low-emissions hydrogen still below 1 Mt of demand globally but policy architecture broadening, developers that vertically integrate hydrogen with captured CO2, methanol synthesis, or e-fuel upgrading can move from commodity-like hydrogen gross margins toward premium molecules that may increase realized revenue per kilogram-equivalent by 1.8x to 3.0x and raise project IRR by roughly 300 to 600 basis points, particularly in the EU where the Hydrogen and Decarbonised Gas Market Package and European Hydrogen Bank are designed to improve investment security and connect supply with demand; this opens a realistic upside pathway to convert 8% to 12% of 2035 low-carbon hydrogen demand into higher-value derivatives, especially around ports and export corridors where offtake concentration lowers logistics cost per ton by 10% to 20%.
Opportunity Impact Analysis
| Opportunity | (~) % Potential CAGR Upside | Geographic Relevance | Execution Window |
|---|---|---|---|
| Hydrogen-as-a-Service for SME industry | +2.8% | EU, UK, North America core | Short term (≤ 2 years) |
| E-fuels and methanol integration | +3.4% | EU core, North America, APAC export hubs | Medium term (2-4 years) |
| Midstream storage and pipeline tolling | +2.1% | EU, U.S. hub states, UK | Medium term (2-4 years) |
| Certification-led import arbitrage platforms | +1.9% | EU, UK, Japan/Korea-linked exporters | Short term (≤ 2 years) |
| Industrial cluster roll-up and M&A | +2.6% | U.S. Gulf Coast, Northwest EU, India emerging | Medium term (2-4 years) |
| Power-system flexibility and capacity services | +1.7% | EU high-renewables markets, UK, select U.S. ISOs | Long term (≥ 4 years) |
Challenges Analysis
Electrolyser Supply Localization Gaps
Official European hydrogen policy now explicitly links scale-up to manufacturing capacity, including the electrolyser partnership target of 17.5 GW per year in Europe by 2025, yet the wider market still faces a difficult transition from announced capacity to reliably delivered stacks, power electronics, membranes, catalysts, compressors, and balance-of-plant modules at utility scale. That gap creates a realistic friction of 4 to 9 months in equipment lead times for large projects, 8% to 15% capex escalation risk when localized content requirements or public funding conditions force supplier reshuffling, and 3 to 6 percentage points of commissioning underperformance in year one when integrators substitute across vendors with uneven field experience. Corporates therefore have to move beyond lowest-cost procurement into dual-sourcing, frame agreements for long-lead components, regional assembly partnerships, and earlier factory acceptance testing, because low-carbon hydrogen demand can still advance under current policies but growth remains mechanically slower if manufacturing ecosystems mature more slowly than project sanctioning pipelines.
Challenges Impact Analysis
| Challenge | (~) % CAGR Friction Drag | Geographic Relevance | Mitigation Horizon |
|---|---|---|---|
| Certification Accounting Complexity | -1.4% | EU regulatory hubs, North America policy markets, export corridors | Medium term (2-4 years) |
| Electrolyser Supply Localization Gaps | -1.1% | EU manufacturing clusters, North America core, APAC equipment corridors | Medium term (2-4 years) |
| Hydrogen Network Buildout Lag | -1.8% | EU industrial corridors, U.S. hub regions, Northeast Asia import nodes | Long term (≥ 4 years) |
| Port and Derivatives Handling Bottlenecks | -0.9% | EU ports, Asian import terminals, Middle East export gateways | Medium term (2-4 years) |
| Skilled Workforce Depth Shortfall | -0.8% | North America core, EU engineering centers, emerging export markets | Long term (≥ 4 years) |
| Upstream Emissions Data Volatility | -1.0% | EU low-carbon pathways, LNG-linked importers, gas-based hydrogen regions | Medium term (2-4 years) |
Geopolitical Impact Analysis
War Disruptions Reshape the Low Carbon Hydrogen Market
The 2026 Middle East conflict is creating immediate supply pressure across the low carbon hydrogen value chain. The International Energy Agency states that the Middle East accounts for around one-sixth of global hydrogen production, more than 10% of global ammonia and urea production, and nearly 17% of methanol output. Refinery and petrochemical shutdowns, damaged hydrogen units, and disrupted exports through the Strait of Hormuz have reduced the availability of hydrogen-based chemicals, fertilisers, and refined products.
The disruption is also increasing market and investment uncertainty. In March 2026, the World Bank reported that crude oil prices had risen by nearly 40% from February, Asian LNG shipment prices had increased by almost two-thirds, and nitrogen fertiliser prices had climbed by nearly 50%. These shocks are adding pressure to hydrogen projects already affected by high production costs, uncertain demand, complex regulations, and insufficient infrastructure.
Over the longer term, the conflict strengthens the case for locally produced renewable hydrogen. Electrolysis can use domestic renewable electricity to produce fertilisers, methanol, shipping fuels, and aviation fuels, reducing exposure to imported fossil energy. However, the IEA explains that low-emissions hydrogen remains more expensive than fossil-based hydrogen in most regions. Government support, storage facilities, transport networks, and stronger demand policies will therefore remain necessary before hydrogen can make a meaningful contribution to energy security.
Regional Analysis
North America Leads the Low Carbon Hydrogen Market
North America held the dominant market position, capturing 45.4% of the Low Carbon Hydrogen Market and generating USD 13.09 billion, based on the supplied market estimate. The region benefits from established refining and chemical demand, extensive natural gas systems, carbon storage potential, renewable resources, and experienced engineering companies. In January 2025, the U.S. Department of Energy confirmed that qualifying clean hydrogen projects can receive a production tax credit of up to USD 3.00 per kilogram. This incentive improves long-term project economics and strengthens regional investment in electrolysis, natural gas reforming with carbon capture, hydrogen storage, transportation networks, and industrial consumption.
Asia Pacific is expected to be the fastest-growing regional market, supported by large-scale manufacturing, government planning, industrial decarbonisation, and expanding renewable power. The IEA reported in 2025 that China represented 65% of global installed electrolyser capacity and projects reaching final investment decision. China also hosted nearly 60% of worldwide electrolyser manufacturing capacity, creating advantages in equipment availability and supply-chain scale. Commercial deployment is moving toward larger facilities, as a 500 MW electrolyser project was commissioned in China during 2025.
Key Regions and Countries Covered
- North America
- The US
- Canada
- Europe
- Germany
- France
- The UK
- Spain
- Italy
- Russia & CIS
- Rest of Europe
- APAC
- China
- Japan
- South Korea
- India
- ASEAN
- Rest of APAC
- Latin America
- Brazil
- Mexico
- Rest of Latin America
- Middle East & Africa
- GCC
- South Africa
- Rest of MEA
Key Players Analysis
ENGIE is strengthening its low-carbon hydrogen position through production, transport, storage, and industrial-use projects. The group is developing renewable hydrogen projects across Europe, including the HyGreen Provence project, which is designed around a 250 MW electrolyzer to support industrial decarbonization in southern France. ENGIE’s integrated capabilities across renewable power, infrastructure, chemicals, and heavy industry worldwide markets.
Siemens Energy supports the low-carbon hydrogen market through proton exchange membrane electrolyzers, project engineering, and hydrogen-ready power technologies. Its Berlin electrolyzer factory was designed with 1 GW of annual production capacity. The company also supplies technology for 100 MW-class hydrogen plants and modular systems that can scale for large industrial projects.
RWE is building a strong low-carbon hydrogen platform by combining renewable electricity, electrolysis, storage, and long-term industrial supply. The company is involved in around 30 hydrogen projects and operates a 14 MW pilot electrolyzer in Lingen that can produce up to 270 kilograms per hour. RWE also agreed to supply approximately 30,000 metric tons of green hydrogen annually to TotalEnergies.
Plug Power operates across electrolyzers, hydrogen production, fuel distribution, and fuel-cell systems. In 2025, the company shipped more than 185 MW of GenEco electrolyzers, lifting cumulative shipments above 317 MW. Plug Power’s vertically integrated model supports customers requiring equipment, fuel supply, and operating services, particularly in material handling, industrial processing, mobility, and distributed energy applications globally.
The Major Players in The Industry
- Air Liquide S.A.
- Linde plc
- Air Products and Chemicals, Inc.
- Shell plc
- BP p.l.c.
- TotalEnergies SE
- Equinor ASA
- Exxon Mobil Corporation
- Saudi Arabian Oil Company—Aramco
- ENGIE S.A.
- Siemens Energy AG
- Uniper SE
- RWE AG
- Plug Power Inc.
- Nel ASA
- Other Key Players
Key Development
- In January 2026, Air Liquide S.A. completed the EUR 2.85 billion acquisition of DIG Airgas, creating approximately EUR 900 million in combined South Korean sales and adding nearly 20 secured projects across industrial gases, clean energy and mobility.
- In August 2025, Linde plc highlighted its new European liquid-hydrogen trailer, which can transport up to 3.9 tons of liquid hydrogen, providing 50% more payload than standard 2.6-ton containers and helping reduce delivery trips and operating costs.
Report Scope
| Report Features | Description |
|---|---|
| Market Value (2025) | USD 28.8 Bn |
| Forecast Revenue (2035) | USD 129.8 Bn |
| CAGR (2026-2035) | 16.2% |
| Base Year for Estimation | 2025 |
| Historic Period | 2020-2024 |
| Forecast Period | 2026-2035 |
| Report Coverage | Revenue Forecast, Market Dynamics, Competitive Landscape, Recent Developments |
| Segments Covered | By hydrogen type (Green hydrogen, Blue hydrogen, Turquoise hydrogen, Others), By end-user industry (Chemicals and petrochemicals, Fertilizers, Oil refining, Iron and steel, Transportation and mobility, Others) |
| Regional Analysis | North America – The US & Canada; Europe – Germany, France, The UK, Spain, Italy, Russia & CIS, Rest of Europe; APAC– China, Japan, South Korea, India, ASEAN & Rest of APAC; Latin America– Brazil, Mexico & Rest of Latin America; Middle East & Africa– GCC, South Africa, & Rest of MEA |
| Competitive Landscape | Air Liquide S.A., Linde plc, Air Products and Chemicals, Inc., Shell plc, BP p.l.c., TotalEnergies SE, Equinor ASA, Exxon Mobil Corporation, Saudi Arabian Oil Company—Aramco, ENGIE S.A., Siemens Energy AG, Uniper SE, RWE AG, Plug Power Inc., Nel ASA, Other Key Players |
| Customization Scope | Customization for segments, region/country-level will be provided. Moreover, additional customization can be done based on the requirements. |
| Purchase Options | We have three licenses to opt for: Single User License, Multi-User License (Up to 5 Users), Corporate Use License (Unlimited Users and Printable PDF) |





































